← Back to the plain-language case
Abstract names March and October as best twice-yearly spraying months; body, table and data give September–November
PLoS Comput Biol (2020) · doi:10.1371/journal.pcbi.1007743 · PMC7200023
Summary
The abstract says the best ultra-low volume (ULV) strategy was spraying twice a year "in March and October", with a median of 172,000 infections [IQR 158,000–183,000], a 52% reduction from no spraying. The Results text, Table 2, the Discussion and the legends of Figs 4, 8 and 10 give these same figures, and the same 549 spray days, for a different month pair: September and November. One Results sentence repeats the abstract's "October and March". The authors' public source data reproduce the reported 172,000 [158,000–183,000] for September–November, which ranks 1st of the 66 month pairs tested. March–October has a median of 219,402 infections, ranks 16th, and gives a 39% reduction, not 52%. The paper's stated question is when to spray, so the abstract gives the wrong answer to it, although every number it reports is correct.
What the paper reports
The abstract's ULV headline:
"The ULV strategy with the fewest median infections was spraying twice yearly, in March and October, which led to a median of 172,000 infections [IQR: 158,000–183,000], a 52% reduction from baseline." (Abstract)
The abstract also states the paper's question:
"The optimal time to deploy these interventions and their relative epidemiological effects are, however, not well understood." (Abstract)
The Results give the same numbers to a different pair, and describe the general timing pattern:
"The best strategy for spraying twice yearly was spraying in September and November (172,000; IQR: 158,000–183,000) (Fig 4C). Generally, undertaking the first spray in August or September (typically, just before the dengue season) and the second in October or November (typically, near the start of the dengue season) led to the fewest infections (Fig 4C). In this case, the strategy that led to the fewest infections also led to the lowest average mosquito abundance: spraying in September and November (S4 Fig)." (Results, "Ultra-low volume spraying", paragraph 1)
The next paragraph uses the abstract's pair:
"Comparing the best strategies, spraying twice yearly (in October and March) averted the most infections, but required the most spraying campaigns: 22 campaigns of spraying, spending a median of 549 days spraying in total over 11 years." (Results, "Ultra-low volume spraying", paragraph 2)
Table 2 (ULV rows, columns: None | Adaptive threshold | Yearly | Twice yearly):
"Best strategy | N/A | When monthly incidence is 1σ above mean | September | September & November" "Number of infections, 2000–2010 (1,000s) [IQR] | 361 [347, 383] | 254 [210, 277] | 261 [250, 277] | 172 [158, 183]" "Days spent spraying [IQR] | 0 | 351 [341, 371] | 274 [272, 277] | 549 [545, 552]" (Table 2)
The Discussion and three figure legends agree with Table 2:
"The best strategy for ULV spraying was to spray twice per year, in September and November." (Discussion, "Summary of main findings")
"twice yearly corresponds to spraying in September and November." (Fig 4 legend, panel d; Fig 8 legend, panel c has "and twice yearly corresponds to spraying in September and November;")
"the bottom row the best twice yearly strategy (spraying in September and November)" (Fig 10 legend)
The Methods show that the two pairs are separate strategies, each with its own result:
"We tested yearly spraying starting in each month (12 strategies) and twice-yearly spraying in each pair of months (66 strategies) (Table 1)." (Methods, "Experiments")
"Comparison of the median predicted infections for twice yearly spraying strategies, beginning on the first days of the shown month." (Fig 4 legend, panel c)
What the paper's own numbers show
Method. I first listed every statement in the paper that names the best twice-yearly ULV pair, and checked each against the PMC archive. Seven statements name September and November (Results paragraph 1, twice; Table 2; the Discussion; the Fig 4, 8 and 10 legends). Two name March and October (the Abstract and Results paragraph 2). I then checked the arithmetic of the reported values. Finally, I used the source data from the GitHub repository given in the paper's Data Availability Statement. The file figures/scripts/spray_analysis_paired_all_years.RData holds 400 simulations × 3 outputs × 66 month pairs. I mapped pairs to columns with the pair-index formula from the authors' own Fig 4 script, and took infections from output column 3, the column that script uses for Fig 4. For each pair I computed the median, the IQR (R's default quantile, which numpy also uses) and the median number of spray days. These data reproduce the paper's no-spraying, yearly-September and best-threshold results, so they match the published analysis. All numbers below are printed by recompute.py.txt.
| Quantity | Location | Reported | Recomputed |
|---|---|---|---|
| Month pair with the fewest median infections (twice yearly, ULV) | Abstract; Results para 2 | March and October | September–November (rank 1 of 66) |
| Same | Results para 1; Table 2; Discussion; Fig 4d, 8c, 10 legends | September and November | September–November (rank 1 of 66) |
| Median infections [IQR], September–November | Results para 1; Table 2 | 172,000 [158,000–183,000] | 171,650 [158,131–183,442] (consistent) |
| Median infections [IQR], March–October | Abstract (as the best pair) | 172,000 [158,000–183,000] | 219,402 [208,280–230,152]; rank 16 of 66 |
| Reduction from no spraying, best twice-yearly pair | Abstract | 52% | 1 − 172/361 = 52.4%; from source data, Sep–Nov 52.4%, Mar–Oct 39.2% |
| No spraying, median [IQR] | Abstract; Table 2 | 361,000 [347,000–383,000] | 360,831 [346,748–383,264] (consistent) |
| Yearly September, median [IQR]; days | Results; Table 2 | 261,000 [250,000–277,000]; 274 | 260,708 [249,589–276,903]; 274 (consistent) |
| Spray days, twice yearly | Results para 2; Table 2 | 549 | 22 campaigns × 25 days = 550; median 549 for both Sep–Nov and Mar–Oct (median across all 66 pairs is 548–549, so this figure does not identify a pair) |
| Best ULV vs best TIRS | Results, TIRS | 17-fold | 172,000 / 9,900 = 17.4 (consistent) |
| Ranks of the four pairs with first spray Aug/Sep and second Oct/Nov | Results para 1 ("Generally, ...") | fewest infections | ranks 1–4 of 66 (consistent with the body) |
Two further checks need the RData file. Mar–Oct is not the best pair on the file's other outcome column either (rank 14 of 66, best is Sep–Nov), and not on mean infections (rank 15 of 66, best is Sep–Nov).
A secondary inconsistency, unrelated to the month pair. For the best TIRS strategy, the abstract gives "(9,900; [IQR: 8,720–11,400], a 94% reduction)". The Results give "9,900 infections (IQR: 8,720–11,300)", Table 2 gives "9.90 [8.72, 11.3]", and 1 − 9.9/361 = 97.3%. The Discussion's "97% reduction ... for repeated TIRS campaigns" is consistent with 97.3% (yearly TIRS gives 1 − 11.8/361 = 96.7%, also about 97%). The abstract's 94% and 11,400 do not match the body.
Figure
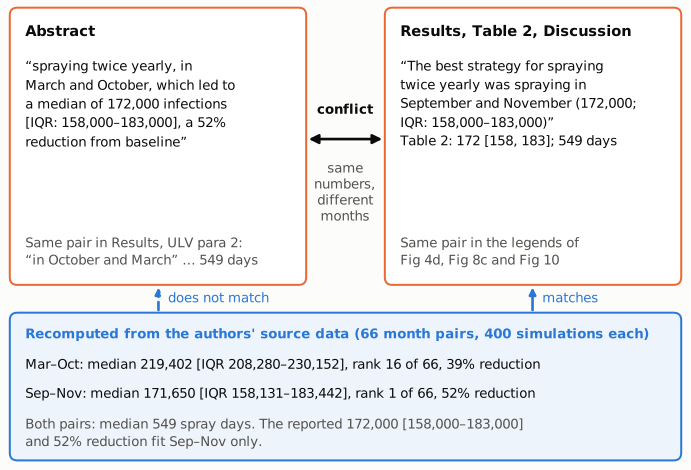
Figure 1. The two orange-bordered panels quote the paper. On the left, the abstract (and Results paragraph 2) name March and October as the best twice-yearly ULV pair. On the right, the Results, Table 2 and the Discussion (and the Fig 4d, 8c and 10 legends) name September and November. Both give the same 172,000 [158,000–183,000] infections and 549 spray days. The blue strip below gives values recomputed in recompute.py.txt from the authors' source data. September–November has median 171,650 [158,131–183,442], rank 1 of 66, a 52% reduction, and matches the reported result. March–October has median 219,402 [208,280–230,152], rank 16 of 66, a 39% reduction, and does not match.
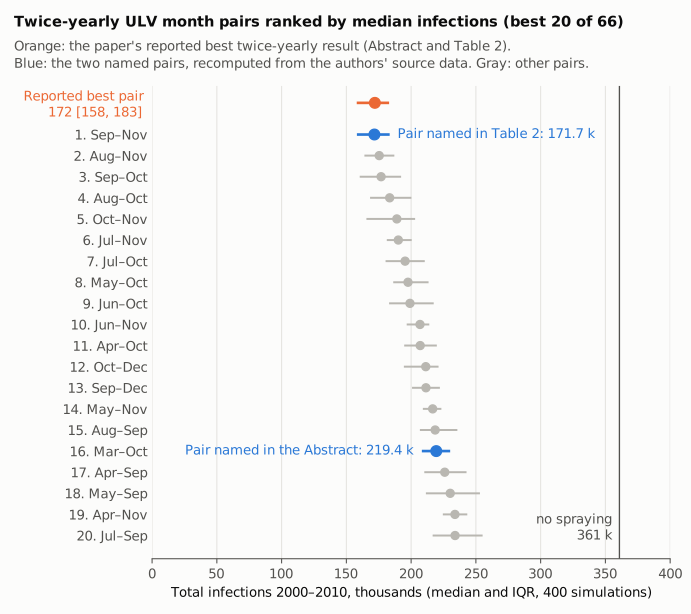
Figure 2. Median and IQR of total infections over 2000–2010 (400 simulations each) for the 20 best of the 66 twice-yearly ULV month pairs, recomputed from the authors' source data. The top row, in orange, is the paper's reported best result, 172 [158, 183] thousand. The two pairs the paper names are in blue. September–November, named in Table 2 and most of the body, sits at the reported value. March–October, named in the abstract, ranks 16th, with an IQR that does not overlap the reported one. The thin vertical line marks the no-spraying median (361,000). The axis starts at zero.
Why it matters
The month pair is the result the paper sets out to find. The abstract describes timing as "not well understood", and the title is about optimizing deployment. A reader of the abstract alone would plan the first of two yearly ULV campaigns for March. The body puts the best first spray in August or September, "just before the dengue season", and the Author summary advises starting non-residual spraying "close to the start of the dengue transmission season". On the authors' own data, March–October gives a median of about 47,800 more infections over 11 years than September–November (219,402 vs 171,650). That is a 39% reduction instead of 52%, and fifteen pairs do better.
The error does not change the infection counts, the 52% figure (which belongs to September–November), the ranking of twice-yearly over yearly and threshold ULV strategies, the advantage of TIRS, or the recommendation of threshold-based TIRS. The paper's conclusions in the body stand. The problem is that the abstract, the part most often read, indexed and cited, gives a timing the paper's own analysis does not support. Results paragraph 2 repeats it, so it also appears in the main text.
Explanations considered
Typesetting or archiving artifact. Ruled out. The conflicting items are plain month names, not symbols, decimals or table alignment. An earlier audit stage found the same wording in the PLOS XML, the PLOS PDF and the PLOS article page, matching the PMC copy word for word. On 2026-10-23 I fetched the PLOS article page and confirmed that the abstract still reads "in March and October".
March–October and September–November as the same strategy under a different calendar. Ruled out. The Methods treat twice-yearly spraying as 66 unordered month pairs, each starting "on the first days of the shown month" every calendar year. March–October and September–November are separate strategies with separate results. In the source data they have different distributions (medians 219,402 vs 171,650, non-overlapping IQRs).
The abstract refers to a different outcome or summary statistic. Not supported. The abstract says "fewest median infections" and gives the same 172,000 [158,000–183,000] as Table 2. In the source data, March–October is not the best pair on the other output column (rank 14) or on mean infections (rank 15). The Results also say September–November gave the lowest mosquito abundance (S4 Fig).
The 549 spray days as evidence for March–October. Not informative. Every twice-yearly pair has 22 campaigns of 25 days. The median number of spray days is 548–549 for all 66 pairs, so "549 days" in Results paragraph 2 fits either wording.
Two statements against seven. The abstract is not the only place with March and October: Results paragraph 2 uses it too. But the paper reports one best twice-yearly strategy, attaches one set of numbers to it, and those numbers belong to September–November in both the paper's table and the source data. The paper does not explain where the March/October wording came from, and nothing here depends on how it arose.
Status
As of 2026-10-23:
- Version of record. The PLOS article page (journals.plos.org, reached via doi.org) was fetched on 2026-10-23. Its abstract still says "spraying twice yearly, in March and October", and no correction notice was found. An earlier audit stage compared the PLOS XML, the PLOS PDF (28 pages, abstract on p. 1) and the Europe PMC full text with the PMC archive and found them identical, including Results paragraph 2's "in October and March", Table 2 and the figure legends.
- Supplements and source data. The Data Availability Statement points to a public GitHub repository. Its
figures/scripts/spray_analysis_paired_all_years.RDataand the R script that draws Fig 4 were used above. The script picks the best strategy per category as the minimum median in output column 3 (max.col(-x)), which gives September–November. The Fig 5c panel code draws campaign start lines at September and November. The supporting-information figures (e.g. S4 Fig) were not re-read for this write-up. - Corrections. Crossref lists one update for the DOI, a "new version" record dated 2020-05-05 that points to the article's own DOI and is not a correction notice. PMC and Europe PMC list no correction, retraction or expression of concern (
src/known.py). - PubPeer and the wider web. An earlier audit stage's web searches for the DOI or title with "correction", "erratum" or "PubPeer" found no relevant notice or thread. The PubPeer API returned HTTP 403, and the PLOS reader-comments page showed 0 comments. I could not repeat the web search on 2026-10-23 because the session's search quota was used up. The medRxiv preprint (10.1101/19007971) returned HTTP 403, so it is unknown whether the preprint has the same wording. The published peer-review history was not examined.
Sources: PMC7200023 (PubMed Central archive); https://journals.plos.org/ploscompbiol/article?id=10.1371/journal.pcbi.1007743; Crossref and PMC notice records for 10.1371/journal.pcbi.1007743; source data from the repository named in the paper's Data Availability Statement.
Suggested correction
Change the abstract sentence to: "The ULV strategy with the fewest median infections was spraying twice yearly, in September and November, which led to a median of 172,000 infections [IQR: 158,000–183,000], a 52% reduction from baseline." In Results ("Ultra-low volume spraying", paragraph 2), change "spraying twice yearly (in October and March)" to "spraying twice yearly (in September and November)". In the same notice, the authors could also reconcile the abstract's TIRS figures ("[IQR: 8,720–11,400], a 94% reduction") with the Results, Table 2 and the Discussion (IQR upper bound 11,300; 1 − 9.9/361 = 97%), or explain the basis of the 94%.