← Back to the plain-language case
The abstract's deaths-averted figures disagree with the Results and with the stated status quo
BMJ Glob Health (2020) · doi:10.1136/bmjgh-2019-001886 · PMC7170464
Summary
The abstract reports that screening options 1–3 would avert "7700 (27%)" cervical cancer (CC) deaths and option 4 "11 800 (40%)" deaths among women living with HIV in care in Kenya, 2020–2040. The Results report 10 702 (23.9%) and 15 612 (34.9%) for the same comparisons. The Results figures match the paper's stated status-quo total of 44 742 deaths: 10 702 / 44 742 = 23.9% and 15 612 / 44 742 = 34.9%. The abstract's do not: 7700 / 44 742 = 17.2% and 11 800 / 44 742 = 26.4%. Its count and percentage pairs imply a status-quo total of about 28 500–29 500 deaths, which appears nowhere in the paper or its supplement. The case figures agree between abstract and Results, so the conflict is limited to mortality. It affects the abstract's headline estimate of lives saved for every option. The direction and ranking of the options do not change.
What the paper reports
Abstract, Results paragraph:
All options will reduce CC cases and deaths compared with no scale-up. Options 1–3 will perform similarly, averting approximately 28 000 (33%) CC cases and 7700 (27%) deaths.
In contrast, option 4 would maximise health outcomes, averting 43 200 (50%) CC cases and 11 800 (40%) deaths, given greater care engagement.
Results, "Burden of HPV-related cervical disease under status quo", second paragraph:
These will reach a cumulative total of 86 115 CC cases and 44 742 CC-related deaths between 2020 and 2040 (figure 2A, B and supplementary material table S3).
Results, "Impact of CC screening and treatment options", first paragraph:
VIA-Cryo only, VIA-Cryo plus LEEP and HPV-DNA-Cryo plus LEEP are expected to perform similarly, averting approximately 32.6% (28 000) of CC cases and 23.9% (10 702) of CC deaths by 2040, compared with status quo (figure 2A, B - and supplementary table S3).
Results, "Impact of CC screening and treatment options", second paragraph:
In contrast to the above, scaling up an option with enhanced technologies (ie, same-day HPV-DNA test or digitally enhanced VIA) could reduce CC cases and deaths by 50.2% (43 200) and 34.9% (15 612), respectively (figure 2A, B - and supplementary table S3).
Methods, "Scale-up of CC screening and treatment care options":
Outcomes were compared with a scenario with no scale-up in CC screening and treatment, henceforth referred to as status quo.
All results were based on an average of 100 model runs.
The Discussion gives no mortality figures. The online supplement's Table S3 ("Predicted health outcomes among WHIV in care in Kenya from 2020 to 2040") lists CC cases and deaths in four five-year periods, 2020–2024 to 2035–2039, for the status quo and options 1–3. Table S5 gives the same for the sensitivity scenario "Enhanced technologies only", which matches the description of option 4.
What the paper's own numbers show
Method. I divided each reported count of deaths or cases averted by the status-quo total stated in the Results (44 742 deaths, 86 115 cases). I also divided each count by its own reported percentage, which gives the status-quo total that the count and percentage pair implies. As a second, independent source, I summed the five-year periods in supplementary Tables S3 and S5 to get each scenario's cumulative cases and deaths, and the numbers averted relative to the status quo. Finally I checked every contiguous window of those five-year periods, to test whether some shorter horizon reproduces the abstract's figures. Every number below is printed by recompute.py.txt.
| Quantity | Location | Reported | Recomputed from the paper's own numbers |
|---|---|---|---|
| Status-quo CC deaths, 2020–2040 | Results, status-quo paragraph | 44 742 | Table S3 sum (2020–2039): 41 704 (3038 fewer) |
| Status-quo CC cases, 2020–2040 | Results, status-quo paragraph | 86 115 | Table S3 sum (2020–2039): 86 116 |
| Options 1–3, deaths averted | Abstract | 7700 (27%) | 7700 / 44 742 = 17.2%; implied status quo 7700 / 0.27 = 28 519 |
| Options 1–3, deaths averted | Results, "Impact", para 1 | 10 702 (23.9%) | 10 702 / 44 742 = 23.9%; implied status quo 44 778 |
| Option 4, deaths averted | Abstract | 11 800 (40%) | 11 800 / 44 742 = 26.4%; implied status quo 11 800 / 0.40 = 29 500 |
| Option 4, deaths averted | Results, "Impact", para 2 | 15 612 (34.9%) | 15 612 / 44 742 = 34.9%; implied status quo 44 734 |
| Abstract minus Results, deaths averted | Abstract vs Results | — | options 1–3: −3002 deaths, +3.1 points; option 4: −3812 deaths, +5.1 points |
| Abstract percentages applied to 44 742 | Abstract | 27%, 40% | 12 080 and 17 897 deaths, matching neither count |
| Options 1–3, cases averted | Abstract; Results | 28 000 (33%); 28 000 (32.6%) | 28 000 / 86 115 = 32.5%; Table S3 mean of the three options 28 096 (32.6%) |
| Option 4, cases averted | Abstract; Results | 43 200 (50%); 43 200 (50.2%) | 43 200 / 86 115 = 50.2%; Table S5 "Enhanced technologies only" 43 226 (50.2%) |
| Options 1–3, deaths averted, from supplement | Table S3 | — | 8978, 9633, 10 236 (mean 9616; 23.1% of 41 704) |
| Option 4, deaths averted, from supplement | Table S5 | — | 13 898 (33.3% of 41 704) |
| Option 4 advantage over options 1–3 | Abstract vs Results | 4100 deaths, 13 points (abstract) | 4910 deaths, 11.0 points (Results) |
The Results' two mortality pairs both imply a status quo within 36 deaths of the stated 44 742, the difference expected from rounding the percentages to one decimal. The abstract's two pairs imply a status quo of 28 519 and 29 500. No death total of that size appears in the main text or in Tables S3 and S5, and the paper describes only one status-quo scenario. The case figures in the abstract and Results agree with each other, with the stated 86 115 and with the supplement, so the inconsistency is confined to deaths.
The supplement does not settle which mortality figures are right. Its status-quo deaths sum to 41 704, not 44 742. The gap of 3038 is about one year of deaths at the 2035–2039 rate (14 042 / 5 = 2808 per year), so the text's total may include the year 2040, which the five-year periods leave out. But the text's case total (86 115) equals the 2020–2039 sum (86 116), so the case and death totals in the same sentence would then cover different spans. Against the supplement's own baseline, the deaths averted (mean 9616 for options 1–3, 13 898 for option 4) are closer to the Results' figures than to the abstract's in both count and percentage (23.1% and 33.3%).
Figure
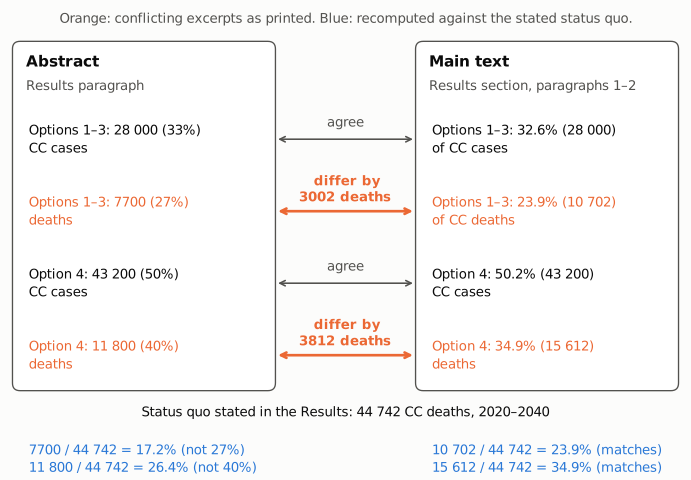
Figure 1. The four outcome statements the abstract and the Results both make, as short excerpts (the "Options 1–3" and "Option 4" prefixes are added to identify each statement; the numbers are as printed). Black rows and grey connectors: cases averted, which agree. Orange rows and connectors: deaths averted, which differ by 3002 deaths for options 1–3 and 3812 for option 4. Blue, bottom: each count of deaths averted divided by the status-quo total that the Results state, 44 742 deaths. The Results' percentages are reproduced. The abstract's are not: its counts correspond to 17.2% and 26.4%, not the printed 27% and 40%.
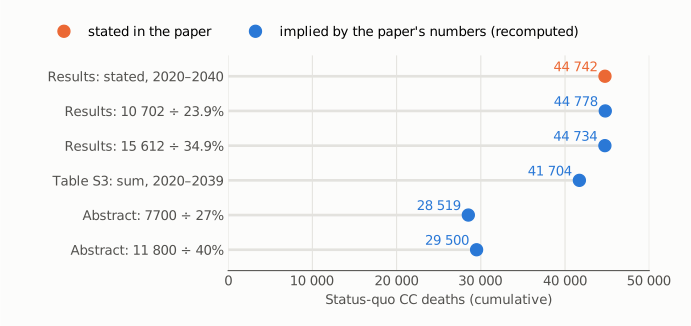
Figure 2. The cumulative status-quo CC death total, as stated in the Results (orange) and as implied by the paper's other numbers (blue): each reported count of deaths averted divided by its reported percentage, and the sum of the four five-year periods of supplementary Table S3. The Results pairs imply 44 778 and 44 734, against a stated 44 742. The supplement sums to 41 704. The abstract pairs imply 28 519 and 29 500, a baseline that appears nowhere in the paper. The axis starts at zero.
Why it matters
- The headline mortality estimates in the abstract are internally inconsistent. For both groups of options, the abstract's count and percentage cannot both be right against the paper's own status quo. Read against 44 742 deaths, the abstract understates the lives saved (by 3002 for options 1–3 and 3812 for option 4) and overstates the relative reduction (by about 3 and 5 percentage points). Most readers, and the indexing services that reproduce the abstract, see only these figures. In a modelling study meant to inform programme choices, the number of deaths averted is a main output.
- The comparison between options shifts. The abstract puts option 4's advantage over options 1–3 at 4100 deaths and 13 percentage points. The Results put it at 4910 deaths and 11.0 points.
- The qualitative conclusions are not affected. Every version of the numbers (abstract, Results, supplement) agrees that all options reduce deaths, that options 1–3 perform similarly, and that option 4 averts the most deaths. The case estimates, incidence projections and programmatic findings about losses to follow-up and screening frequency do not depend on the disputed figures.
- A second, smaller inconsistency sits between the main text and the supplement. The status-quo death total in the text (44 742) is 3038 higher than the supplement's tabulated periods (41 704), while the case total in the same sentence matches the supplement. Neither the abstract's nor the Results' mortality figures can be reproduced exactly from Tables S3 and S5.
Explanations considered
- Rounding of approximate counts. Ruled out. The abstract calls the figures approximate, but 7700 against 44 742 is 17.2%, nowhere near 27%. Reaching 27% would take 12 080 deaths averted, and no rounding of 10 702 gives 7700.
- A different baseline or outcome definition for the abstract. Not supported. The Methods define a single status quo, and the abstract's case percentages (33%, 50%) are computed against the same 86 115 cases as the Results. A death baseline of 28 500–29 500 appears nowhere in the text or supplement.
- A shorter time horizon. Does not account for the numbers. Of all contiguous windows of the supplement's five-year periods, only 2025–2039 gives percentages near the abstract's (27.5% for options 1–3 and 39.8% for option 4). But that window gives 9640 and 13 968 deaths averted, not 7700 and 11 800. It also gives 35.6% and 55.6% of cases averted, not the abstract's 33% and 50%. No window reproduces the abstract's counts.
- Deaths averted per case averted. Coincidence only. 7700 / 28 000 = 27.5%, which matches the abstract's "27%" for options 1–3, but 11 800 / 43 200 = 27.3%, not 40%.
- Reliance on a single option rather than the mean of options 1–3. Does not account for the numbers. The three options avert 8978, 9633 and 10 236 deaths according to Table S3, none close to 7700.
- Abstract carried over from an earlier analysis. Cannot be tested from the published material. The figures could come from an earlier model run or version of the manuscript, but the paper gives no indication of this, and whatever the source, the published abstract and Results disagree.
- A text-conversion artifact. Ruled out. The numbers are plain integers and percentages with no superscripts, minus signs or table cells involved. The same values appear in the PMC HTML page, the Europe PMC JATS XML (which uses thin-space thousands separators) and the PMC archive used here.
- The Results, not the abstract, being in error. Less likely. The Results' counts and percentages are consistent with the stated 44 742, and the supplement's deaths averted (9616 and 13 898 on average) are closer to the Results than to the abstract. The supplement's lower baseline (41 704) does mean that the Results' exact figures are not reproduced either; only the authors' model output can resolve which totals are intended.
- Side observation, not part of the main finding. The Results give the status-quo age-standardised incidence in 2020–2024 as 241 per 100 000 women-years. Table S3 gives 237 for the same period. The 2035–2039 values agree (218).
Status
- Version of record. The publisher's site (gh.bmj.com, reached through doi.org) and the publisher PDF returned HTTP 403 to automated requests. I checked the publisher-supplied text in three archived copies: the PMC HTML page, the Europe PMC full-text JATS XML, and the PMC archive read with
src/show.py. All three carry the numbers quoted above. Every quotation was checked verbatim against the PMC text. - Supplements. The online supplement (
bmjgh-2019-001886supp001.pdf, 22 pages, from the Europe PMC supplementary bundle) was text-extracted with PyMuPDF. Tables S3 and S5 supply the five-year values used above. Figure 2B of the paper (cumulative CC-related deaths), read visually, shows the status quo at about 45 000 deaths by 2040, consistent with the Results text. No numbers were taken from the figure. - Corrections and comments. As of 2026-10-24 I found no correction, erratum, retraction or expression of concern.
src/known.pyreturns no Crossref update relations, PMC notices or Europe PMC notices. The Crossref record has no update-to or updated-by entries, the PubMed record (PMID 32337077) has no CommentsCorrections entries, and Europe PMC lists no comments or corrections. The PubPeer API returned HTTP 404 for the DOI, and a web search for the title with "PubPeer" or "correction" found no thread or notice. - Sources. PMC article PMC7170464; Europe PMC full-text XML and supplementary files for PMC7170464; supplement
bmjgh-2019-001886supp001.pdf; Crossref; PubMed; Europe PMC; PubPeer; https://doi.org/10.1136/bmjgh-2019-001886.
Suggested correction
The authors could check the mortality figures against their model output and make the abstract agree with the Results. If the Results are correct, replace in the abstract
averting approximately 28 000 (33%) CC cases and 7700 (27%) deaths
with
averting approximately 28 000 (33%) CC cases and 10 700 (24%) deaths
and
averting 43 200 (50%) CC cases and 11 800 (40%) deaths
with
averting 43 200 (50%) CC cases and 15 600 (35%) deaths
The authors may also wish to state the period covered by the status-quo totals of 86 115 cases and 44 742 deaths, since the death total does not match the sum of the 2020–2039 periods in supplementary Table S3 (41 704) while the case total does. They may also wish to check the 2020–2024 age-standardised incidence (241 in the Results, 237 in Table S3).