← Back to the plain-language case
Ebola review calls case-fatality change non-significant while reporting OR 1.6, 95% CI excluding 1, p<0.001
BMJ Glob Health (2020) · doi:10.1136/bmjgh-2019-001955 · PMC7061886
Summary
This review of 34 Ebola virus disease outbreaks (1976–2019) states in its Abstract, Results and Abstract Conclusions that the case fatality rate (CFR) did not change significantly over four decades. It supports that statement with "OR in 2019 vs 1976=1.6 (95% CI 1.5 to 1.8), p<0.001". That interval excludes 1 and the P value is below 0.001, so the statistic contradicts the claim it is cited for. The Results text gives a different interval (1.5 to 1.6) for the same OR. The OR also points the wrong way for the paper's own CFRs (71% falling to 62% gives an OR of about 0.67, not 1.6). The Table 3 CFRs for three of the four periods and the overall CFR of "66% (62 to 71)" cannot be reproduced from the outbreak counts in Table 1. Those counts give a pooled CFR that falls from 71.3% to 41.5% (crude OR 0.29, 95% CI 0.24 to 0.34) and an overall CFR of 43.1%. The CFR trend is the review's only quantitative inference, and the Abstract Conclusions use it to support the claim that control challenges persist. As published, the reported statistics do not support the sentence they accompany. Whether the real trend is significant depends on an analysis the paper does not describe: a patient-level comparison finds a large decline, while analyses that allow for variation between outbreaks find no clear trend.
What the paper reports
Abstract, Methods:
Analyses of trends in case fatality were performed by calculating ORs between times.
Abstract, Results:
In the past four decades, a total of 34 EVD outbreaks affecting 34 356 cases and causing 14 823 deaths were reported in 11 countries in Sub-Saharan Africa. The overall case fatality rate (95% CI) was 66% (62 to 71) and did not change substantially over time (OR in 2019 vs 1976=1.6 (95% CI 1.5 to 1.8), p<0.001).
Abstract, Conclusions:
Sub-Saharan Africa continues to face considerable challenges in EVD control, whereby there are no significant changes in case fatality rates observed during the past four decades.
Methods, "Data extraction and analysis":
Additional analyses of trends in case fatality rates were performed by calculating ORs between periods using MedCalc statistical software (https://www.medcalc.org/calc/odds_ratio.php).
Results, "Context of EVD", fourth paragraph:
Case fatality rates varied from 71% during outbreaks in 1976–1986 to 62% during the later years. However, there was no statistically significant change over time (OR in 2019 vs 1976: 1.6 (95% CI 1.5 to 1.6)). The overall trend from 1976 to 2019 outbreaks shows a linear rate of change over time (table 3, figure 3).
Results, "Context of EVD", third paragraph:
During the past four decades, approximately 14 853 people have died from EVD outbreaks.
Table 3, "OR for case fatality rate of Ebola virus disease according to period" (columns: 1976–1986 | 1987–1997 | 1998–2008 | 2009–2019):
Death (n) | 454 | 348 | 733 | 13 288
Case fatality rate (%) | 71 | 67 | 64 | 62
OR (95% CI) | 1.6 (1.4 to 1.8) | 1.7 (1.5 to 1.9) | 1.4 (1.3 to 1.6) | 1.6 (1.5 to 1.6)
P value | <0.001 | <0.001 | <0.001 | <0.001
Table 1 lists each outbreak's year, country, virus, cases, deaths and CFR. Its total row:
Total | | | 34 356 | 14 823 |
Table 2, sex rows (columns: case | death | CFR (%)):
Gender | Male | 15 803 | 6373 | 46
Gender | Female | 18 553 | 8449 | 54
Table 3 does not state the comparison group or the direction of its ORs, and the paper does not say whether the analysis treated individual patients or outbreaks as the unit.
What the paper's own numbers show
Method. I entered the 34 outbreaks of Table 1 (year, cases, deaths) and assigned each multi-year outbreak (for example "2000–2001") to its first year. Grouping them into the four Table 3 periods reproduces Table 3's death counts exactly (454, 348, 733, 13 288), which confirms the grouping. For each period I computed the pooled CFR (deaths ÷ cases). I then computed crude odds ratios of death with Woolf 95% CIs, the CFR odds ratio implied by Table 3's own CFRs, and a chi-square test of equal CFR across periods. For each reported OR I also derived the z statistic its CI implies. These patient-level calculations treat every case as independent, as a crude OR from a 2×2 table does. The cases are concentrated in a few outbreaks: the 2014 outbreaks in Liberia and Sierra Leone alone account for 72.2% of all cases. So I also ran three outbreak-level analyses, which the paper does not report: a Spearman correlation of outbreak CFR with year, a quasi-binomial logistic model, and a DerSimonian–Laird random-effects meta-regression. Every number below is printed by recompute.py.txt.
| Quantity | Location | Reported | Recomputed from the paper's numbers |
|---|---|---|---|
| Does the cited OR show "no change"? | Abstract, Results | 1.6 (95% CI 1.5 to 1.8), p<0.001; "did not change substantially" | CI excludes 1; implied z = 10.1. By its own statistics the change is significant |
| Same OR in the body | Results text | 1.6 (95% CI 1.5 to 1.6); "no statistically significant change" | CI excludes 1 (implied z ≈ 28); also a different CI from the Abstract's for the same quantity |
| Table 3 ORs | Table 3 | 1.6, 1.7, 1.4, 1.6; all CIs above 1; all P < 0.001 | every CI excludes 1; none is a "no change" result |
| Direction of the OR, using Table 3's CFRs | Table 3; Results | 62% vs 71%, reported as "OR in 2019 vs 1976" = 1.6 | (0.62/0.38) ÷ (0.71/0.29) = 0.67 (0.56 to 0.79), p = 4.1 × 10⁻⁶; the inverse is 1.50 (1.26 to 1.78). A fall in CFR gives an OR below 1 |
| Deaths per period | Table 3 vs Table 1 | 454, 348, 733, 13 288 | 454, 348, 733, 13 288 (identical) |
| CFR, 1976–1986 | Table 3 | 71% | 454/637 = 71.3% |
| CFR, 1987–1997 | Table 3 | 67% | 348/467 = 74.5% |
| CFR, 1998–2008 | Table 3 | 64% | 733/1199 = 61.1% |
| CFR, 2009–2019 | Table 3; Results | 62% | 13 288/32 053 = 41.5% |
| OR of death, 2009–2019 vs 1976–1986 | from Table 1 | — | 0.285 (0.240 to 0.339), p ≈ 9 × 10⁻⁴⁶; the inverse is 3.50 |
| Equal CFR across the four periods | from Table 1 | "no statistically significant change" | χ² = 588, df = 3, p ≈ 4 × 10⁻¹²⁷ (patient level) |
| Overall CFR | Abstract | "66% (62 to 71)", labelled a 95% CI | pooled 14 823/34 356 = 43.1% (binomial 95% CI 42.6 to 43.7); unweighted mean of the 34 outbreak CFRs 61.8%. 66.0% is the mean of the four Table 3 CFRs and 62–71 is their range |
| Total deaths | Table 1; Abstract vs Results text | 14 823 vs "approximately 14 853" | Table 1 rows sum to 14 823; the text differs by 30 |
| CFR by sex | Table 2 | male 46, female 54 | male 6373/15 803 = 40.3%, female 8449/18 553 = 45.5%. 46.0% and 54.0% are each sex's share of all cases |
| Outbreak-level trend (not in the paper) | from Table 1 | — | Spearman ρ = −0.16 (p = 0.35); quasi-binomial OR 2009–2019 vs 1976–1986 0.29 (0.04 to 2.09), p = 0.21, dispersion 122; random-effects meta-regression OR per decade 0.81 (0.62 to 1.05), p = 0.11 |
The table supports three findings.
- The reported inference contradicts the reported wording. Every OR the paper prints (Abstract, Results, the four Table 3 columns) has a CI that excludes 1 and a P value below 0.001. The sentences that cite them say there was no significant change.
- The reported OR does not match the reported CFRs. For CFRs of 71% and then 62%, the OR of death for the later period is 0.67. Its inverse, 1.50 (1.26 to 1.78 with the Table 1 period sizes), is close to the reported 1.6 but describes the earlier period against the later. Neither the Abstract's CI (1.5 to 1.8) nor the Results' CI (1.5 to 1.6) is reproduced.
- Table 3's CFRs, apart from the first period, do not follow from Table 1. Table 3's death counts match Table 1 exactly. Its CFRs for 1987–1997, 1998–2008 and 2009–2019 differ from deaths ÷ cases by −7.5, +2.9 and +20.5 percentage points. The largest gap is in the period that holds 93% of all cases (32 053 of 34 356). They do not match the unweighted means of the outbreak CFRs either (76.5%, 53.5%, 64.9%, 58.9%). The Abstract's "66% (62 to 71)" is reproduced exactly by the mean and range of the four Table 3 CFRs, not by any pooled estimate or confidence interval.
Figure
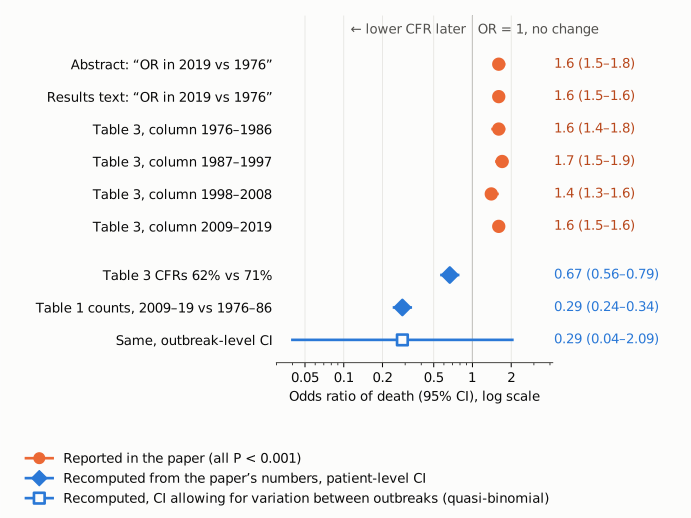
Figure 1. Odds ratios of death with 95% CIs on a log scale. The thin vertical line is OR = 1 (no change). Orange: every OR the paper reports for the CFR trend (Abstract, Results text, and the four columns of Table 3). All lie to the right of 1 with intervals that exclude it, and all carry P < 0.001, yet the paper says there was no significant change. Blue diamonds are recomputed from the paper's own numbers. The upper one is the OR implied by Table 3's CFRs (62% vs 71%). The lower one is the crude OR for 2009–2019 vs 1976–1986 from the Table 1 counts. Both lie to the left of 1, the opposite direction from the reported 1.6. The hollow blue square is the same Table 1 comparison with a CI widened for variation between outbreaks (quasi-binomial logistic model, dispersion 122). It is not an analysis the paper reports. It shows that the data are compatible with no change once outbreaks rather than patients are treated as the unit.
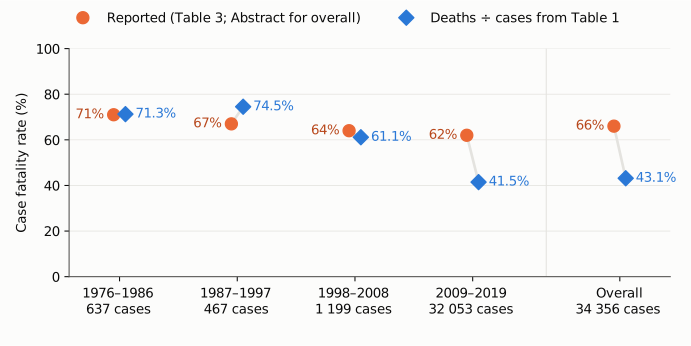
Figure 2. Case fatality rate for each Table 3 period and overall, on an axis from 0 to 100%. Orange circles: Table 3's CFRs and the Abstract's overall 66%. Blue diamonds: deaths ÷ cases from the outbreak rows of Table 1, grouped so that the deaths equal Table 3's. The first period agrees (71% vs 71.3%). The others differ, most of all in 2009–2019 (62% vs 41.5%) and overall (66% vs 43.1%).
Why it matters
The CFR trend is the only quantitative inference in the review. It is stated in the Abstract Results, the Abstract Conclusions and the Results text, and the Abstract Conclusions present it as evidence for the review's framing ("continues to face considerable challenges in EVD control, whereby there are no significant changes in case fatality rates"). A reader who takes the Abstract at face value gets a claim (no significant change), a statistic that contradicts it (CI excluding 1, p<0.001), and an overall CFR (66%) that is about 23 percentage points above the pooled figure implied by the paper's own outbreak table (43.1%).
The paper's numbers do not settle what the correct conclusion is, and this write-up does not claim to. Two readings are defensible, and neither matches the paper.
- Patient-level (as a crude OR implies). The CFR fell substantially and significantly, from 71.3% to 41.5% (OR 0.29, 95% CI 0.24 to 0.34). Under this reading the conclusion "no significant changes" is reversed.
- Outbreak-level. The fall is driven largely by the very large 2014 West African outbreaks (Sierra Leone 26%, Liberia 45%), and CFR varies greatly between outbreaks (Pearson dispersion 122). Allowing for that variation, the decline is not statistically significant (quasi-binomial p = 0.21; random-effects meta-regression OR per decade 0.81, 95% CI 0.62 to 1.05; Spearman ρ = −0.16, p = 0.35). Under this reading "no clear trend" may be defensible. It would then rest on a different analysis, with intervals that include 1, not on the published OR of 1.6 with p<0.001.
Either way, the published statistics cannot support the published sentence, and the overall CFR and three of the four period CFRs are not what the paper's own table implies. The review's qualitative synthesis (epidemiological, health-system and sociocultural challenges) and its recommendations (one-health surveillance, community engagement, research on diagnostics, drugs and vaccines, health-system resilience) do not depend on these numbers.
Explanations considered
- "Did not change substantially" means not clinically important, not non-significant. This does not account for the text. The Results say "no statistically significant change" and the Abstract Conclusions say "no significant changes", and the pooled CFR difference from Table 1 (about 30 percentage points) is large on any clinical scale.
- The OR compares each period with a reference, and 1.6 is in the stated direction. This does not account for the numbers. Table 3 does not name a reference group. If "2019 vs 1976" means the later period against the earlier, any fall in CFR gives an OR below 1: 0.67 from Table 3's CFRs, 0.29 from Table 1's counts. An OR of 1.6 can describe only the earlier period against the later. Even then, a CI excluding 1 means a significant change.
- The OR compares single years, 2019 against 1976. This does not rescue it. The only 2019 outbreak in Table 1 (Uganda) had 4 deaths among 4 cases, so the OR is undefined. Using the 2018–2019 DRC outbreak (2150/3220 = 66.8%) against the 1976 outbreaks (431/602 = 71.6%) gives OR 0.80 (0.66 to 0.97), p = 0.021, which is still below 1 and still significant.
- The Table 3 ORs are some other ratio. I tried several standard quantities: pairwise ORs between periods; each period's OR, risk ratio and CFR ratio against all other periods; and their inverses. None reproduces all four ORs with their CIs. The risk ratios of the first three periods against all others (1.67, 1.74, 1.44) are close to the reported 1.6, 1.7 and 1.4. Their CIs differ (1.59–1.76, 1.65–1.84, 1.37–1.51), and the fourth period's risk ratio is 0.62, not 1.6. The paper's method cannot be identified from what is published.
- Table 3's CFRs are outbreak-averaged rather than pooled. This does not account for the numbers. The unweighted means of outbreak CFRs per period are 76.5%, 53.5%, 64.9% and 58.9%, not 71, 67, 64 and 62. The overall mean across 34 outbreaks is 61.8%, not 66%.
- "66% (62 to 71)" is a genuine 95% CI from a model. Possible, but the numbers coincide exactly with the arithmetic mean (66.0%) and range (62–71) of the four Table 3 CFRs. A pooled estimate from Table 1 would be 43.1%, with a patient-level 95% CI of 42.6 to 43.7, about 1 point wide rather than 9.
- The statement is correct under an outbreak-level analysis. This is partly possible, as shown above: the trend is not significant once between-outbreak variation is allowed for. But the paper reports no such analysis, and the statistics it does report (CIs excluding 1, P < 0.001) are the opposite of a non-significant result. The text and its supporting statistics cannot both be right as printed.
- A conversion or typesetting artefact in PMC. Excluded. The publisher's PDF carries the same Abstract, Results and Table 3 text (see Status).
- Different case counts in Table 3 than in Table 1. Table 3 prints no case counts, but its deaths equal Table 1's period sums exactly. A different set of cases would have to produce identical deaths in all four periods, which is implausible.
Status
- Version of record. The live publisher pages (doi.org → gh.bmj.com) refused automated access (HTTP 403), and the PMC HTML page returned a bot check. The publisher's PDF (gh.bmj.com/content/bmjgh/5/3/e001955.full.pdf, as archived by the Internet Archive on 2023-12-05) was text-extracted. It carries the same Abstract sentences, the same Results sentence with "1.6 (95% CI 1.5 to 1.6)", and the same Table 3 cells as the PMC and Europe PMC XML. Every quotation above was confirmed verbatim against the PMC-archived text.
- Supplements and data. The article has no supplementary data. The Europe PMC supplementary bundle contains only the three figure images, the JATS XML has no supplementary-material element, and the data availability statement reads "Data are available upon request." Figure 3 (cases by year with a linear CFR trendline) reports no OR or test and was not reproduced here.
- Corrections and comments. As of 2026-10-23 I found no correction, erratum, retraction or expression of concern. Crossref lists no update relations (
update-toabsent,relationempty). PMC and Europe PMC list no correction or comment links (PMID 32201623). The Crossref Labs record, which includes Retraction Watch data, lists no updates, and the archived publisher landing page shows no notice. The PubPeer API refused automated access in this session (Cloudflare challenge). A web search for the title with "correction", "erratum" or "PubPeer" found only unrelated errata. - Sources. PMC article PMC7061886; Europe PMC full-text XML; publisher PDF (Internet Archive copy); Crossref REST API; Europe PMC search; web search.
Suggested correction
- Replace "did not change substantially over time" (Abstract), "there was no statistically significant change over time" (Results) and "there are no significant changes in case fatality rates" (Abstract Conclusions) with wording that matches whatever analysis is reported. The current ORs, with CIs excluding 1 and P < 0.001, indicate a significant difference.
- State the comparison and direction of every OR in Table 3 (which period against which reference), and the unit of analysis. Report a single, consistent CI for the "2019 vs 1976" OR; the Abstract gives 1.5 to 1.8 and the Results 1.5 to 1.6.
- Recompute the Table 3 CFRs as deaths ÷ cases from Table 1 (71.3%, 74.5%, 61.1%, 41.5%) and add the case counts to the table, or explain how the printed 67%, 64% and 62% were derived.
- Replace the overall "66% (62 to 71)" with the pooled CFR from Table 1 (43.1%) and a valid interval, or label it as the mean and range of the period CFRs if that is what it is.
- Because CFR varies widely between outbreaks and one region contributes most of the cases, consider a trend analysis that accounts for clustering by outbreak (for example random-effects or quasi-binomial models). Base the conclusion on its estimate and interval.
- Minor: correct "approximately 14 853" deaths to 14 823 (Table 1 total), and change the Table 2 "CFR (%)" entries for sex (46, 54) to 40.3 and 45.5, or relabel the column as the share of cases. The Table 2 age groups sum to 33 456 cases, 900 fewer than the 34 356 total, and the table does not say how the remaining cases are classified.