← Back to the plain-language case
Abstract says LabMol-149 has EC50 below 500 nM; Table 3 gives 1450 and 509 nM
PLoS Comput Biol (2020) · doi:10.1371/journal.pcbi.1007025 · PMC7048302
Summary
The Abstract reports that two of the five compounds chosen by the paper's deep-learning screen, LabMol-149 and LabMol-152, showed antiplasmodial activity "at low nanomolar concentrations (EC50 <500 nM)". The final paragraph of the Discussion says both compounds "completely satisfy" a criterion of EC50 <500 nM against sensitive and resistant strains. The paper's own Table 3 gives LabMol-149 EC50 values of 1.450 ± 0.524 μM against the sensitive 3D7 strain and 0.509 ± 0.177 μM against the resistant W2 strain. These are 1450 nM and 509 nM, so the compound is above the stated threshold on both strains, by a factor of 2.9 on 3D7. Only LabMol-152 (49 and 78 nM) meets the criterion. The headline count of qualifying compounds is therefore one, not two.
What the paper reports
Abstract:
Among them, two compounds, LabMol-149 and LabMol-152, showed potent antiplasmodial activity at low nanomolar concentrations (EC50 <500 nM) and low cytotoxicity in mammalian cells. Therefore, the computational approach employing deep learning developed here allowed us to discover two new families of potential next generation antimalarial agents, which are in compliance with the guidelines and criteria for antimalarial target candidates.
Author summary:
This allowed us to discover two new potential antimalarial candidates.
Discussion, final paragraph:
Moreover, two of these compounds (LabMol-149 and LabMol-152) completely satisfy the guidelines and criteria for discovery of new antimalarial drugs, i.e., activity at low nanomolar concentrations (EC50 <500nM) against sensitive and multiple resistant strains of Plasmodium spp. and SI greater than 10 folds [12,42].
Table 3, header and LabMol-149 row (columns: compound | EC50 (Pf3D7)(μM) | EC50 (PfW2)(μM) | CC50 (COS-7) (μM) | SIa | SIb):
LabMol-149 | 1.450 ± 0.524 | 0.509 ± 0.177 | >100 | >71.4 | >196
Table 3, the other two active candidate compounds:
LabMol-151 | 1.911 ± 0.292 | 1.616 ± 0.321 | 140.8 ± 11.2 | 73.7 | 87.1
LabMol-152 | 0.049 ± 0.029 | 0.078 ± 0.014 | 16.7 ± 10.3 | 340.8 | 214.1
Table 3 footer:
SIa: Selectivity index calculated by COS7 CC50/3D7 EC50; and SIb: Selectivity index calculated by COS7 CC50/W2 EC50; The data are expressed as mean ± SD of three independent assays.
Two related passages use different wording. Results, "Experimental validation":
The EC50 for each compound (Table 3) indicate that two compounds, 2-(4,6-diphenyl-1,2-dihydro-1,3,5-triazin-2-yl)phenol (LabMol-149), 4-{N-[3-(morpholin-4-yl)-1,4-dioxo-1,4-dihydronaphthalen-2-yl]acetamido}benzoic acid (LabMol-151) and N2-(3-fluorophenyl)-N4-[(oxolan-2-yl)methyl]quinazoline-2,4-diamine (LabMol-152), were potent at inhibiting the parasite growth, showing activities in submicromolar and low nanomolar range against both 3D7 and W2 strains.
Discussion, third paragraph:
Two compounds (LabMol-149 and LabMol-151) showed activity at submicromolar concentrations against asexual blood stages and low cytotoxicity in mammalian cells.
What the paper's own numbers show
Method. I converted every Table 3 EC50 from μM (the unit in the column header) to nM and compared each one with the 500 nM threshold stated in the Abstract and the Discussion. The Discussion applies that threshold to both sensitive and resistant strains, so a compound qualifies only if both its 3D7 and W2 values are below 500 nM. For LabMol-149 I also looked at mean − 1 SD, using the footer's statement that the values are mean ± SD of three assays. I recomputed every selectivity index from the footer's definitions (CC50/EC50), and checked the "submicromolar" (below 1 μM) wording against the same values. Every number below is printed by recompute.py.txt.
| Quantity | Location | Reported | Recomputed from the paper's numbers |
|---|---|---|---|
| LabMol-149 EC50, 3D7 | Table 3; Abstract and Discussion say <500 nM | 1.450 ± 0.524 μM | 1450 nM, 2.90 × the 500 nM threshold; mean − 1 SD = 926 nM |
| LabMol-149 EC50, W2 | Table 3; Abstract and Discussion say <500 nM | 0.509 ± 0.177 μM | 509 nM, 1.018 × the threshold (9 nM above it) |
| LabMol-152 EC50, 3D7 / W2 | Table 3 | 0.049 / 0.078 μM | 49 / 78 nM, both below 500 nM |
| LabMol-151 EC50, 3D7 / W2 | Table 3 | 1.911 / 1.616 μM | 1911 / 1616 nM, both above 500 nM |
| Tested LabMol compounds with EC50 <500 nM on both strains | Abstract; Discussion, final paragraph | two (LabMol-149 and LabMol-152) | one (LabMol-152) |
| LabMol-149 SIa | Table 3 | >71.4 | 100 / 1.450 = >69.0; 71.4 corresponds to an EC50 of 1.401 μM |
| LabMol-149 SIb | Table 3 | >196 | 100 / 0.509 = >196.5 |
| LabMol-151 SIa / SIb | Table 3 | 73.7 / 87.1 | 73.7 / 87.1 |
| LabMol-152 SIa / SIb | Table 3 | 340.8 / 214.1 | 340.8 / 214.1 |
| Chloroquine SIa / SIb | Table 3 | 4,545 / 289 | >4545.5 / >289.0 |
| Pyrimethamine SIa / SIb | Table 3 | 2,702 / 5.5 | >2702.7 / >5.5 |
| LabMol-149 "submicromolar" | Discussion, third paragraph | submicromolar | 3D7 1450 nM, not below 1 μM; W2 509 nM, below 1 μM |
| LabMol-151 "submicromolar" | Discussion, third paragraph | submicromolar | 1911 / 1616 nM, below 1 μM on neither strain |
The table's arithmetic is internally consistent. Every selectivity index recomputes from the printed EC50 and CC50 values, except LabMol-149's SIa, which is slightly high (71.4 against 69.0). The problem is the text. It counts LabMol-149 among the compounds below 500 nM, and the table does not support that for either strain. The Results passage also says "two compounds" and then names three.
Figure
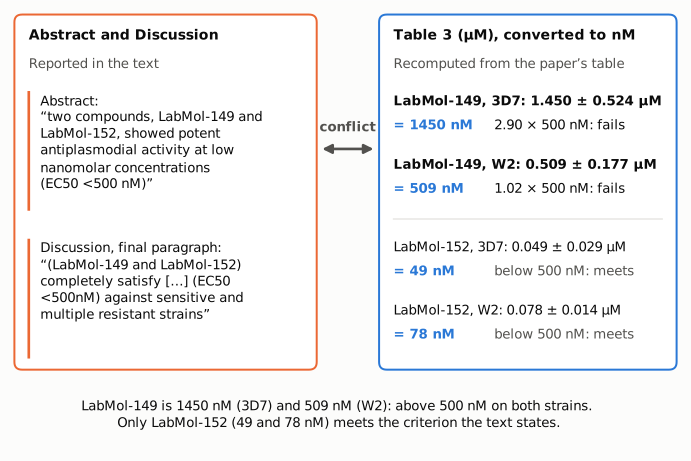
Figure 1. On the left (orange), the two passages that state the EC50 <500 nM criterion and name LabMol-149 and LabMol-152 as meeting it, quoted from the Abstract and the final paragraph of the Discussion. On the right (blue), the Table 3 values for the same two compounds, converted from μM to nM. LabMol-149 is 1450 nM against 3D7 (2.90 times the threshold) and 509 nM against W2 (1.02 times). LabMol-152 is 49 and 78 nM. Only LabMol-152 meets the criterion as the text states it.
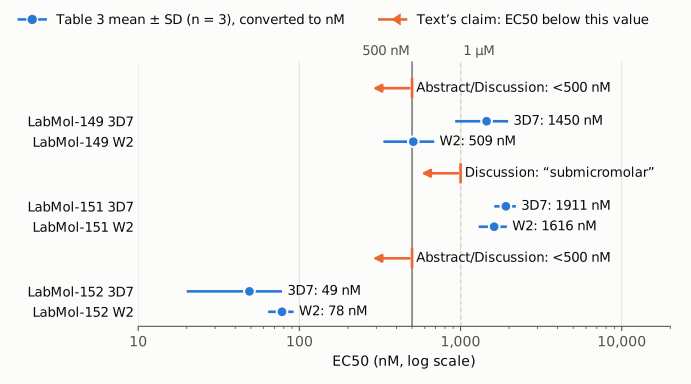
Figure 2. Table 3 EC50 values (blue dots, mean; blue lines, ± 1 SD of three assays) for the three active candidate compounds on one log-scaled nM axis. The solid vertical line marks 500 nM and the dashed line 1 μM. The orange markers show what the text says about each compound: below 500 nM for LabMol-149 and LabMol-152 (Abstract and final paragraph of the Discussion), and "submicromolar" for LabMol-151 (Discussion, third paragraph; that sentence also calls LabMol-149 submicromolar). LabMol-149's 3D7 interval lies entirely above 500 nM, and both LabMol-151 values lie above 1 μM. The W2 value for LabMol-149 sits at the threshold, and its ± 1 SD interval spans it.
Why it matters
The count of compounds meeting the potency criterion is the paper's headline experimental result. It appears in the Abstract ("two compounds ... (EC50 <500 nM)"), in the Author summary ("two new potential antimalarial candidates") and in the final paragraph of the Discussion, which says the two compounds "completely satisfy" the criteria for new antimalarial drugs. The Abstract also concludes that the approach found "two new families of potential next generation antimalarial agents, which are in compliance with the guidelines and criteria".
By the paper's own Table 3, one compound (LabMol-152, a quinazoline) meets the stated criterion. LabMol-149 fails it on the sensitive strain by a wide margin. Its 3D7 EC50 of 1450 nM is also above the 1 μM cut-off that the paper itself uses to label training compounds "active" (Methods, "Datasets": "1,058 active compounds with EC50 ≤ 1 μM"). On the resistant strain it is essentially at the threshold, at 509 nM. LabMol-149 remains an active and selective hit (SI above about 69 on 3D7 and 196 on W2), and nothing here questions the measurements themselves. But it is a low-micromolar hit, not a compound that satisfies the sub-500 nM criterion.
Readers who rely on the Abstract, for example to compile hit lists or to judge how well deep-learning virtual screening performs in antimalarial discovery, would count two qualifying compounds from two scaffold families where the data show one. The rest of the paper's conclusions, such as the QSAR models, the screen and LabMol-152's potency, do not depend on this. These are in vitro preclinical results, so there is no direct clinical consequence.
Explanations considered
- A μM/nM unit mix-up. This does not account for the numbers. The Table 3 header gives μM in the PMC text, the publisher's XML, its PDF and Europe PMC. Read in μM, LabMol-152's values (0.049 and 0.078) agree with the Results text ("EC50 = 0.049 μM and 0.078 μM"), and the reference drugs' values (chloroquine 0.011 μM, pyrimethamine 0.037 μM) are plausible in that unit. Read as nM, they would not be.
- A decimal slip in the 3D7 value (0.145 μM printed as 1.450 μM). This does not account for the numbers. With CC50 >100 μM, an EC50 of 0.145 μM would give SIa >689.7. The printed SIa (>71.4) corresponds to about 1.40 μM, so the table's own selectivity column supports a micromolar EC50. The W2 value (0.509 μM) also agrees with its SIb (100/196 = 0.510 μM).
- Assay variation. This does not account for the 3D7 value. The footer gives mean ± SD of three assays, and the 3D7 mean − 1 SD is still 926 nM, nearly twice the threshold. For W2 the mean is 9 nM above 500 nM, and its ± 1 SD interval (332–686 nM) spans the threshold, so W2 alone could be called borderline. The stated criterion requires activity on both strains, however, and 3D7 is not borderline.
- The claim refers to only one strain. This does not rescue it. The Discussion applies the criterion "against sensitive and multiple resistant strains". Even the more potent of LabMol-149's two values (509 nM, W2) is above 500 nM.
- A different, looser criterion was intended. The Results passage uses vaguer wording ("submicromolar and low nanomolar range"). The Abstract and the Discussion, however, state the 500 nM cut-off explicitly, citing references 12 and 42, and attribute it to LabMol-149. A looser 1 μM cut-off would still not be met on 3D7 (1450 nM).
- The compound names were swapped in the text. Substituting LabMol-151 for LabMol-149 does not help: LabMol-151 is 1911 and 1616 nM. LabMol-152 is the only tested compound below 500 nM on both strains.
- A conversion artifact in the PMC copy. This is excluded. The publisher's article page (Version 2, the final version), its JATS XML and its printable PDF carry the same text and the same Table 3 values as the PMC archive.
- The EC50 lies outside the assay range. This is not the case. The antiplasmodial assay used a 12-point series from 0.019 to 40 μM (Methods, "Antiplasmodial assay"), and 1.450 μM lies within it.
Status
- Version of record. The publisher's article page (journals.plos.org, reached from the DOI; shown as Version 2, with Version 1 as the uncorrected proof), its JATS XML and its printable PDF (21 pages, dated February 18, 2020) show the same Abstract sentence, the same Discussion sentences and the same Table 3 rows, with μM in the column header, as the PMC archive. The Europe PMC full-text XML matches them as well. Every quote above was confirmed verbatim against the PMC-archived text.
- Supplements. The article lists seven supporting files: S1–S4 File (XLSX QSAR training datasets) and S1–S3 Fig (TIF images). S1 File (1163 rows, SMILES and Outcome) and S3 File (1247 rows, SMILES and pEC50) were opened; both contain only literature training data, with no LabMol entries. None of the supporting files holds assay-level dose-response data for the tested compounds, so none of them can change the Table 3 EC50 values.
- Corrections and comments. As of 2026-10-23 I found no correction, erratum, expression of concern or retraction. PMC and Europe PMC list no notices. Crossref's only update record is the article's own DOI with type "new_version", dated 2020-02-28, which is PLOS's routine record for replacing the uncorrected proof with the final version; a Crossref relation search returned only the article's own components. The PLOS comments page shows "Reader Comments (0)". The PubPeer API returned no feedback for the DOI (the PubPeer web page itself refused automated access), and a web search found no discussion of the issue.
- Sources. PMC article PMC7048302; publisher page https://journals.plos.org/ploscompbiol/article?id=10.1371/journal.pcbi.1007025 and its comments page; PLOS JATS XML and printable PDF; Europe PMC full text; Crossref; PubPeer.
Suggested correction
- In the Abstract, change "two compounds, LabMol-149 and LabMol-152, showed potent antiplasmodial activity at low nanomolar concentrations (EC50 <500 nM)" so that it names LabMol-152 alone as meeting EC50 <500 nM. Describe LabMol-149 as active in the low-micromolar to high-nanomolar range (1.450 μM on 3D7, 0.509 μM on W2). Revise "two new families ... in compliance with the guidelines and criteria" and the Author summary's "two new potential antimalarial candidates" to match.
- In the final paragraph of the Discussion, restrict "completely satisfy the guidelines and criteria ... (EC50 <500nM)" to LabMol-152.
- In the third paragraph of the Discussion, replace "submicromolar" for LabMol-149 and LabMol-151, which are 1.450 / 0.509 μM and 1.911 / 1.616 μM, with "low micromolar" or the actual values.
- Minor: in the Results, "two compounds" is followed by three names; change it to "three compounds". Change LabMol-149's SIa from >71.4 to >69.0 (100/1.450), or state which EC50 value was used to compute it.