← Back to the plain-language case
Abstract reports adverse-event rates of 17% and 10%; Results and Table 3 give 62% and 55%
Arthritis Rheumatol (2019) · doi:10.1002/art.41012 · PMC6900077
Summary
The abstract of this phase IIb/III trial of fasinumab in osteoarthritis pain states that treatment-emergent adverse event (TEAE) rates "were 17% with fasinumab and 10% with placebo". The Results text and Table 3 give the TEAE incidence for the 16-week treatment period as 62% and 55%, and Table 3's counts reproduce those figures exactly (209/337 = 62.0%; 45/82 = 54.9%). No period, organ class, population or definition in the paper yields 17% and 10% together, while the discontinuation figures in the same abstract sentence do match the body. The abstract's only overall tolerability figure therefore understates the absolute adverse-event burden by about 45 percentage points in each arm and overstates the relative excess (1.7-fold implied vs 1.13-fold in the data).
What the paper reports
Abstract, Results:
Treatment-emergent adverse event rates were 17% with fasinumab and 10% with placebo, and 4% and 1% of patients, respectively, discontinued treatment.
Patients and Methods, Safety end points:
Safety was evaluated based on the frequency of treatment-emergent adverse events (TEAEs), AEs of special interest (adjudicated arthropathy and sympathetic nervous system dysfunction), and laboratory tests.
Results, Safety, paragraph 2:
During the 16-week treatment period, the incidence of TEAEs was 62% with fasinumab and 55% with placebo (Table 3). Nervous system and musculoskeletal symptoms were more frequent following treatment with fasinumab (17% and 19%, respectively) than with placebo (9% and 17%, respectively).
Results, Safety, paragraph 3:
The incidence of serious TEAEs during treatment was low (2% with placebo versus 1% with fasinumab).
A low proportion of patients discontinued therapy due to TEAEs (4% [n = 14] in the fasinumab group and 1% [n = 1] in the placebo group).
Results, Safety, paragraph 4:
During the 20-week follow-up, the incidence of TEAEs was higher in the combined fasinumab group than in the placebo group (48% versus 38%) (Table 3)
Table 3 ("TEAEs reported in >3% of patients during the treatment and follow-up periods, by system organ class (safety analysis set)"; columns: placebo n = 82 | 1 mg n = 85 | 3 mg n = 84 | 6 mg n = 85 | 9 mg n = 83 | combined n = 337), treatment period and follow-up period summary rows:
≥1 TEAE | 45 (54.9) | 54 (63.5) | 52 (61.9) | 55 (64.7) | 48 (57.8) | 209 (62.0)
≥1 posttreatment AE | 31 (37.8) | 36 (42.4) | 38 (45.2) | 42 (49.4) | 44 (53.0) | 160 (47.5)
Results, Disposition of the patients:
During the study, 419 patients received ≥1 dose of study medication (1 patient randomized to receive placebo and 1 randomized to receive 9 mg fasinumab discontinued before drug administration).
Discussion, paragraph 5:
Fasinumab was generally well tolerated in the present study. Although the rate of TEAEs was higher with fasinumab than with placebo, there were few discontinuations attributable to TEAEs.
What the paper's own numbers show
Method. I took the counts and group sizes from Table 3 (safety analysis set), checked that the four dose columns add up to the combined column in every row of Table 3 (summary, organ-class and preferred-term rows, 42 in all), and recomputed every printed percentage in all six columns. I compared the abstract's 17%/10% with the treatment-period and follow-up-period rows and with every system-organ-class row in Table 3. I also listed which integer counts would print as 17% of 337 and 10% of 82, and checked the full-analysis-set denominators (338 and 83). Every number below is printed by recompute.py.txt.
| Quantity | Location | Reported | Recomputed from the paper's numbers |
|---|---|---|---|
| Any TEAE, fasinumab, treatment period | Abstract, Results | 17% | 209/337 = 62.0% |
| Any TEAE, placebo, treatment period | Abstract, Results | 10% | 45/82 = 54.9% |
| Any TEAE, fasinumab vs placebo | Results, Safety ¶2 | 62% vs 55% | 62.0% vs 54.9% (agrees) |
| ≥1 TEAE, combined column | Table 3 | 209 (62.0) | 54 + 52 + 55 + 48 = 209 of 85 + 84 + 85 + 83 = 337; 62.0% (agrees) |
| Any AE, follow-up period | Results, Safety ¶4; Table 3 | 48% vs 38%; 160 (47.5) vs 31 (37.8) | 160/337 = 47.5%; 31/82 = 37.8% (agrees; not 17%/10%) |
| Discontinuation due to TEAE | Abstract; Results, Safety ¶3 | 4% vs 1% (n = 14, n = 1) | 14/337 = 4.2%; 1/82 = 1.2% (agrees) |
| Nervous system disorders, treatment period | Results, Safety ¶2; Table 3 | 17% vs 9% | 57/337 = 16.9%; 7/82 = 8.5% |
| Vascular disorders, treatment period | Results, Safety ¶3; Table 3 | 6% vs 10% | 19/337 = 5.6%; 8/82 = 9.8% |
| Serious TEAEs, treatment period | Results, Safety ¶3 | 1% vs 2% | no counts given; not 17%/10% |
| Counts that would print as 17% and 10% | derived | — | 56–58 of 337 fasinumab patients and exactly 8 of 82 placebo patients |
| Table 3 rows giving 17% and 10% together | Table 3 (all 42 rows, both periods) | — | none |
| Any TEAE with full-analysis-set denominators | Disposition (338, 83) | — | 209/338 = 61.8%; 45/83 = 54.2% |
| Abstract minus Table 3, treatment period | derived | — | −45.0 pp (fasinumab), −44.9 pp (placebo) |
| Table 3 rate ÷ abstract rate | derived | — | 3.65 (fasinumab), 5.49 (placebo) |
| Risk ratio, fasinumab vs placebo | derived | 17/10 = 1.70 implied | (209/337)/(45/82) = 1.130 |
| Absolute difference | derived | 7 pp implied | 7.1 pp |
| Fisher exact test, 209/337 vs 45/82 | derived | — | OR 1.34, two-sided p = 0.26 |
Table 3 is internally consistent: in all 42 rows (summary, organ-class and preferred-term) the dose columns sum to the combined column, and all 252 printed percentages, in every dose column, match their counts. The Results text agrees with Table 3. Only the abstract's TEAE rates differ.
Figure
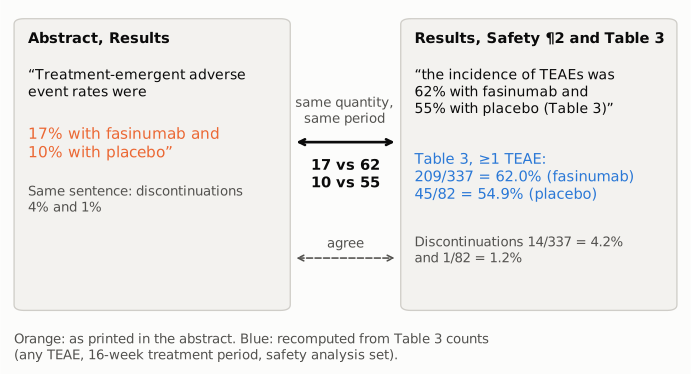
Figure 1. The conflicting statements, side by side. Left: the abstract's sentence, with the TEAE rates it prints in orange. Right: the Results (Safety, paragraph 2) sentence on the same quantity and the Table 3 "≥1 TEAE" counts, with the percentages recomputed from those counts in blue (209/337 = 62.0%, 45/82 = 54.9%). Both describe any TEAE in the 16-week treatment period. The discontinuation figures in the same abstract sentence (4% and 1%) agree with the body (14/337 = 4.2%, 1/82 = 1.2%).
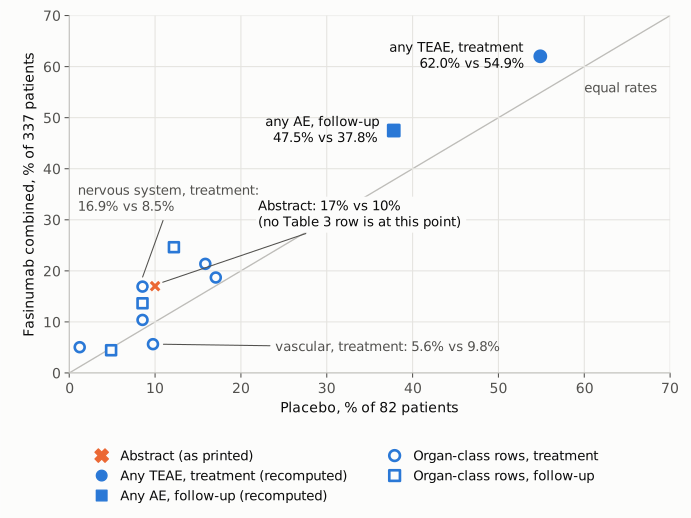
Figure 2. Every summary row and system-organ-class row of Table 3, plotted as the placebo rate (x) against the combined fasinumab rate (y), both recomputed from the counts (blue; filled for the any-adverse-event rows, hollow for organ classes; circles for the treatment period, squares for follow-up; preferred-term rows are omitted, as none exceeds 11% in either arm). The orange cross is the abstract's pair, 17% vs 10%. No row lies at that point: the nervous-system row matches the fasinumab figure but not the placebo one (16.9% vs 8.5%), and the vascular row matches the placebo figure but not the fasinumab one (5.6% vs 9.8%). The gray diagonal marks equal rates in the two arms.
Why it matters
The abstract sentence is the abstract's only statement of overall tolerability, and readers who use the abstract alone (indexing services, evidence summaries, secondary coverage) receive the wrong figure.
- Absolute burden. The abstract implies that about 1 in 6 fasinumab-treated patients and 1 in 10 placebo patients had a TEAE. Table 3 shows about 3 in 5 and 1 in 2 (62.0% and 54.9%). The abstract understates both arms by about 45 percentage points.
- Relative excess. The abstract's figures imply a 1.7-fold risk with fasinumab (a 70% relative increase). The data give a 1.13-fold risk (OR 1.34; Fisher exact p = 0.26). The absolute difference is about 7 points either way (7 pp as stated, 7.1 pp recomputed). So the abstract makes the overall burden look smaller and the difference between arms look proportionally larger than the data show.
- What is unaffected. The direction is the same in both versions: TEAEs were more frequent with fasinumab. The discontinuation figures (4% vs 1%), the arthropathy figures, the serious-TEAE statement in the body and all efficacy results are not affected. The body's statements that fasinumab was "generally well tolerated" and that "the rate of TEAEs was higher with fasinumab than with placebo" are worded consistently with Table 3. The abstract's Conclusion ("The observed benefit-to-risk relationship favors further clinical development to explore the lowest doses") rests mainly on the efficacy and arthropathy results, which are correct, but a reader weighing that conclusion from the abstract alone would be weighing it against an adverse-event rate of 17% rather than 62%.
Explanations considered
- A different study period. This does not account for the numbers. The treatment period gives 62.0% vs 54.9% and the follow-up period gives 47.5% vs 37.8%.
- A single system organ class. This does not account for the numbers. Nervous system disorders give 16.9% (17%) for fasinumab but 8.5% (9%) for placebo, and the Results text itself prints them as 17% vs 9%. Vascular disorders give 9.8% (10%) for placebo but 5.6% for fasinumab. No Table 3 row in either period gives 17% and 10% together; that would need 56–58 of 337 fasinumab patients and 8 of 82 placebo patients in the same row (Figure 2).
- Serious TEAEs. This does not account for the numbers. The Results text gives 1% with fasinumab and 2% with placebo.
- Treatment-related (drug-related) TEAEs. This cannot be checked, and the wording argues against it. The paper reports no treatment-related TEAE rate anywhere, and the abstract uses the same term, "treatment-emergent adverse event", that the Methods define as the safety end point.
- A different analysis population. This does not account for the numbers. Table 3 uses the safety analysis set (82 and 337), and the abstract itself refers to "1 of 337 treated patients". Using the randomized numbers (83 and 338) gives 54.2% and 61.8%.
- A conversion or typesetting artifact. This is excluded as far as the available copies allow. The same abstract sentence appears in the PMC article, the Europe PMC full-text XML and the PubMed record (PMID 31207169).
- A correction elsewhere. None was found (see Status).
Status
- Version of record. The publisher's landing page and PDF (acrjournals.onlinelibrary.wiley.com, reached from the DOI) returned HTTP 403 to automated access and could not be read. The abstract sentence, the Results sentences and the Table 3 rows quoted above are identical in the PMC article (live page and archived text), the Europe PMC full-text XML, and the PubMed and Europe PMC abstract records. Every quote above was checked verbatim against the PMC-archived text.
- Supplements. The single supporting file (ART-71-1824-s001.docx, from the Europe PMC supplementary-files endpoint) holds Supplementary Methods, Supplementary Table 1 (WOMAC physical function) and Supplementary Figures 1–4. It contains no adverse-event tables and does not resolve the discrepancy. A ClinicalTrials.gov record that appears to correspond to this study (NCT02447276) has no posted results; the article gives no registration number, so the match is unconfirmed.
- Corrections and comments. As of 2026-10-23 no correction, erratum, retraction or expression of concern was found. Crossref lists no update relations for the DOI; PMC, Europe PMC and the PubMed record list no correction or comment links; the Crossref Labs record shows no Retraction Watch entry. Web searches for an erratum, correction or PubPeer discussion found none. PubPeer itself could not be queried directly (API 404 / access challenge).
- Sources. PMC article PMC6900077; Europe PMC full text and supplementary files; PubMed PMID 31207169; Crossref and Crossref Labs records for doi:10.1002/art.41012; ClinicalTrials.gov NCT02447276.
Suggested correction
- In the Abstract (Results), replace "Treatment-emergent adverse event rates were 17% with fasinumab and 10% with placebo" with "Treatment-emergent adverse event rates during the 16-week treatment period were 62% with fasinumab and 55% with placebo", matching the Results text and Table 3 (209/337 and 45/82). The discontinuation figures in the same sentence (4% and 1%) are correct and can stay.
- If the 17% and 10% were intended to describe a different quantity, name it in the abstract and report it, with counts, in the Results or Table 3, since no such quantity currently appears in the paper.
- Ask indexing services (PubMed, Europe PMC) to carry the corrected abstract.