← Back to the plain-language case
The abstract's univariate diabetes odds ratio is inverted, and its p-value disagrees with Fig 5
PLoS Med (2019) · doi:10.1371/journal.pmed.1002961 · PMC6822721
Summary
The abstract and the Results say that type 2 diabetes is a risk factor for being a tuberculosis transmitter. They report the univariate result as "odds ratio 0.19 [95% CI 0.02–1.10], p < 0.003". Fig 5 of the same paper gives the counts behind this comparison: 5 of 23 transmitters and 3 of 61 other clustered cases had diabetes. It prints OR 5.14 (0.90–36.45) and p = 0.03 for them. Recomputed from those counts, the OR for transmitters vs others is 5.24 (exact 95% CI 0.92–37.08) and the two-sided Fisher p is 0.032. The text's 0.19 (0.02–1.10) is that estimate with the groups swapped (0.191, 0.027–1.089). So the text gives an OR pointing the opposite way from its own word "enriched", and a p-value ten times smaller than the counts support. This is the only risk factor named in the abstract. At the univariate level, the counts support a borderline association (p = 0.032, exact CI just including 1), not one with p < 0.003.
What the paper reports
Abstract, "Methods and findings":
Our data suggest that type 2 diabetes mellitus is a risk factor associated with being a transmitter (odds ratio 0.19 [95% CI 0.02–1.10], p < 0.003).
Results, section "Identification of transmitters allows association of risk factors to transmission", second paragraph:
Transmitters were significantly enriched in diabetic patients in both univariate (Fisher’s exact test; OR 0.19 [95% CI 0.02–1.10], p < 0.003) and multivariate (logistic regression; OR 23.77 [95% CI 2.53–339.69], p < 0.009) statistical analyses.
The same section, first paragraph, defines the comparison:
We combined likely transmitter cases together with the index cases predicted by TransPhylo (n = 23) and compared them to the other clustered cases (n = 61).
Methods, "Statistical analysis":
We selected the index cases and the samples with higher than 0.6 posterior probability of being transmitters as predicted by TransPhylo (23 transmitters compared to the remaining 84 clustered cases), with sensitivity analysis of the later threshold in S1 Text and S1 Table. Then, we computed the odds ratio (OR) and 95% confidence intervals (Fisher’s exact test) to explore epidemiological variables associated with being a transmitter.
Fig 5, Diabetes row. Fig 5 is an image, so this row was read from the publisher's figure file (journal.pmed.1002961.g005). Its columns are All Patients (n=84), Transmitter (n=23), Other samples (n=61), Odd ratio (95% IC), p-value*:
Diabetes | 8 (9%) | 5 (22%) | 3 (5%) | 5.14 (0.90-36.45) | 0.03
Fig 5 caption:
The figure shows estimated odd ratios for each risk factor tested. *Fisher’s exact test. Comparisons were made between transmitter cases and the rest of the clustered samples.
Discussion, fourth paragraph:
Still, our data suggest that certain risk and epidemiological factors are enriched among the transmitters, while others are depleted.
What the paper's own numbers show
Method. I took the diabetes counts from Fig 5 and rebuilt the 2×2 table: 5 of 23 transmitters and 3 of 61 other clustered cases had diabetes, 8 of 84 in all. For transmitters vs others, and again with the groups swapped, I computed the conditional maximum-likelihood OR with its central exact (Cornfield) 95% CI. These are the quantities R's fisher.test prints. I also computed the two-sided Fisher exact p. As a separate check that does not use the counts, I back-calculated a log-Wald p from the text's own interval, 0.02–1.10. I searched every 23-vs-61 table with more diabetes among transmitters for tables that would give Fisher p < 0.003. I did the same Wald back-calculation for the multivariate result, which I cannot recompute without individual data. Every number below is printed by recompute.py.txt (scipy).
| Quantity | Location | Reported | Recomputed from the paper's numbers |
|---|---|---|---|
| Diabetic transmitters | Fig 5 | 5 (22%) of 23 | 5/23 = 21.7% |
| Diabetic other clustered cases | Fig 5 | 3 (5%) of 61 | 3/61 = 4.9% |
| OR, transmitters vs others | Fig 5 | 5.14 (0.90–36.45) | conditional MLE 5.24 (exact 95% CI 0.92–37.08); sample OR 5.37. The median-unbiased estimate is 5.15, closer to the printed 5.14 |
| OR as given in the text | Abstract; Results | 0.19 (0.02–1.10) | Groups swapped (others vs transmitters): 0.191 (0.027–1.089). Equivalently 1/5.14 = 0.195, 1/36.45 = 0.027, 1/0.90 = 1.11 |
| Direction implied by the text's OR | Abstract; Results | "risk factor", "significantly enriched" | With others at 4.9%, an OR of 0.19 would mean 0.97% of transmitters had diabetes (0.22 of 23 people), not 21.7% |
| Fisher exact p | Fig 5 | 0.03 | two-sided 0.0324; one-sided 0.0324 |
| Fisher exact p | Abstract; Results | p < 0.003 | 0.0324 from the Fig 5 counts, about ten times larger |
| p compatible with the text's own CI | Abstract; Results | p < 0.003 | log-Wald p from 0.19 (0.02–1.10) ≈ 0.10. A central exact 95% CI that includes 1 means each one-sided exact p is at least 0.025, so the two-sided Fisher p is at least 0.025 |
| Counts needed for Fisher p < 0.003 | derived | — | With 3 of 61 diabetic others, at least 8 of 23 transmitters (Fig 5: 5). With 5 diabetic transmitters, 0 of 61 others (Fig 5: 3) |
| Multivariate logistic OR | Results | 23.77 (2.53–339.69), p < 0.009 | Not recomputable. Wald p from the CI: 0.011 using 23.77, or 0.007 using the CI's geometric midpoint (29.32). Consistent with the reported p and with OR > 1 |
| Size of the comparison group | Methods vs Results, Fig 5 | "remaining 84" vs n = 61 | 23 + 61 = 84, so 84 is the total, not the comparison group |
Figure
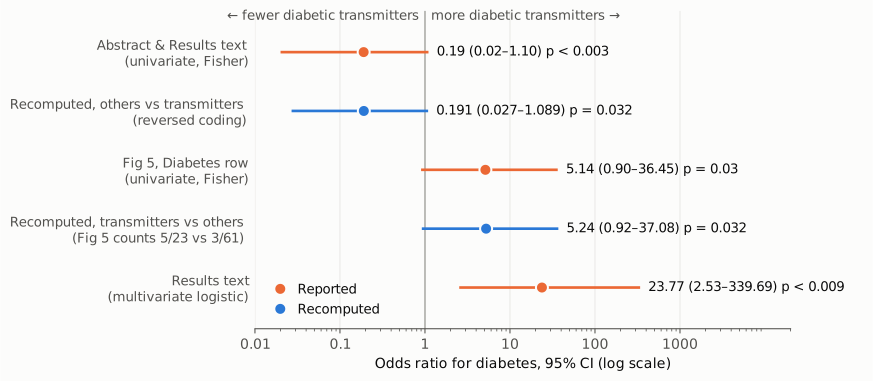
Odds ratios for diabetes with 95% confidence intervals on a log scale; the thin vertical line marks OR = 1 (no association). Orange: values printed in the paper (abstract and Results text, Fig 5, and the multivariate model). Blue: values recomputed from Fig 5's counts (5/23 transmitters vs 3/61 other clustered cases), once with transmitters as the index group and once with the groups swapped. The text's univariate interval coincides with the swapped-group recomputation. Fig 5's interval coincides with the transmitters-vs-others recomputation. The p-value printed next to the text's interval (p < 0.003) matches neither.
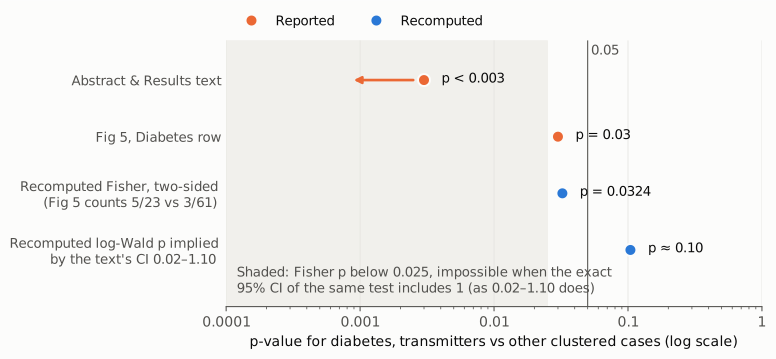
The same comparison on a p-value scale (log scale); the thin vertical line marks 0.05. Orange: the text's "p < 0.003" (the arrow shows that the bound is an upper bound) and Fig 5's p = 0.03. Blue: the two-sided Fisher p recomputed from Fig 5's counts (0.0324), and the log-Wald p implied by the text's own interval 0.02–1.10 (≈ 0.10). The shaded region (p < 0.025) is excluded for a Fisher test whose exact 95% CI includes 1. The text's value lies inside it.
Why it matters
The diabetes result is the only risk factor for transmission named in the abstract. It also serves as the example for the abstract's wider claim that "factors associated with likely transmitters are different to those of simply being in a transmission cluster". As printed, the univariate statistics cannot all be right together:
- An OR of 0.19 means transmitters had lower odds of diabetes, which is the opposite of the claimed enrichment.
- Its interval includes 1.
- p < 0.003 is incompatible with that interval and with the counts in Fig 5.
A reader who takes the abstract at face value gets a wrong direction and a strength of evidence about ten times greater than the data support. Recomputed from the paper's own counts, the univariate result is OR 5.24, two-sided Fisher p = 0.032, with an exact CI (0.92–37.08) that just includes 1. That is a borderline association resting on 5 diabetic transmitters, not a result with p < 0.003. The text describes the univariate analysis as showing transmitters "significantly enriched". That description holds only at p = 0.032, and the matching exact interval does not exclude 1.
What is not affected:
- Direction. The direction of the association is supported by the Fig 5 counts (22% vs 5%) and by the separate multivariate model (OR 23.77, 2.53–339.69). That model's reported p < 0.009 is close to the 0.011 back-calculated from its interval.
- Main conclusions. The paper's main conclusions do not rest on this number: index cases are often misidentified (14 of 21 clusters), and some transmission occurs before symptom onset (5 of 14).
Explanations considered
- Reversed reference group. This fully accounts for the OR and its interval. Swapping the groups in the Fig 5 table gives 0.191 (0.027–1.089), which matches "0.19 (0.02–1.10)". So does taking the reciprocal of Fig 5's 5.14 (0.90–36.45). It does not make the sentence correct: the text pairs this inverted OR with "risk factor" and "significantly enriched", and Fig 5 itself reports the comparison in the transmitters-vs-others direction.
- A different two-sided or one-sided convention for p. This does not account for p < 0.003. From the Fig 5 counts, the two-sided Fisher p is 0.0324, the one-sided p is 0.0324, and doubling the one-sided p gives 0.065. None is below 0.003. Fig 5 prints 0.03. One possibility is that "0.003" is a misplaced decimal for 0.03, but the paper gives no explanation, so this is an inference.
- A different comparison group (the Methods' "remaining 84"). This does not account for it either. The Results and Fig 5 both use 61 others, and 23 + 61 = 84 is Fig 5's "All Patients" total, so "remaining 84" appears to be a wording slip in the Methods. More generally, any table whose exact 95% CI includes 1, as the printed 0.02–1.10 does, has a Fisher p of at least 0.025. No choice of comparison group can then produce p < 0.003 together with that interval.
- Fisher's p and the exact CI disagreeing near 0.05. This is real, but it does not rescue the text. Fisher's two-sided p (summing tables no more likely than the one observed) and the central exact CI can disagree near the 0.05 boundary. That explains why Fig 5 shows p = 0.03 alongside an interval that just includes 1. It cannot produce a p ten times smaller.
- Small differences between Fig 5 and the recomputation (5.14 vs 5.24; 0.90–36.45 vs 0.92–37.08). These are minor and not part of the claim. They may reflect different software or estimators: the median-unbiased estimate is 5.15. Either way, the interval includes 1 and the estimate is above 1.
- The multivariate result. This is a separate logistic model, consistent in direction and in its own p-value. I cannot recompute it from the paper, and it is not part of the claim.
- Conversion artefact. Ruled out. The same text appears in the publisher's HTML, the publisher's manuscript XML, PMC and Europe PMC, and the Fig 5 values come from the publisher's own image file.
Two further observations, which do not affect the claim:
- Fig 5's HIV row repeats the Diabetes row's counts, 5 (22%) and 3 (5%), but with OR 1.01, and its "All Patients" entry for HIV is 7 rather than 8.
- In the comparison with non-clustered cases, the Results give transmitters as 27% diabetic. Neither 5/23 (21.7%) nor 6/23 (26.1%) rounds to 27%.
Status
- Version of record. The errors are in the version of record. I checked the PLOS Medicine article page (journals.plos.org/plosmedicine/article?id=10.1371/journal.pmed.1002961), the publisher's manuscript XML, PMC (PMC6822721), Europe PMC full-text XML and the locally archived PMC text. All carry the same abstract and Results wording. The Fig 5 values were read from the publisher's figure file (journal.pmed.1002961.g005).
- Supplements. I listed all 19 supplementary files (S1–S13 Figs, S1–S4 Tables, S1–S2 Text) and opened S1–S4 Tables and S1 Text. None gives the diabetes 2×2 table or an odds ratio for diabetes. S3 Table lists diabetes in 13 of the 109 cases with epidemiological data. S1 Table is a meta-analysis of clock rates, although the Methods cite it for the threshold sensitivity analysis.
- Corrections and comments. As of 2026-10-23 I found no correction, erratum, retraction or expression of concern. Crossref lists no update relations for the DOI, and PMC and Europe PMC list no notices. The PLOS article page shows "Reader Comments (0)". The PubPeer API asked for human verification, and the PubPeer search page refused automated access (HTTP 403), so I could not check PubPeer directly. A web search found no PubPeer page for the article.
- Sources. PMC6822721; https://journals.plos.org/plosmedicine/article?id=10.1371/journal.pmed.1002961 (HTML, manuscript XML, Fig 5 image g005, supplementary files); Europe PMC; Crossref; PubPeer.
Suggested correction
In the Abstract and in the Results ("Identification of transmitters..."), the univariate result should be reported in the same direction as the sentence and as Fig 5. Using Fig 5's own values, the replacement would be "odds ratio 5.14 [95% CI 0.90–36.45], p = 0.03". From the Fig 5 counts, the conditional maximum-likelihood estimate is "OR 5.24 [95% CI 0.92–37.08], p = 0.032".
Because that interval includes 1, the Results' "significantly enriched ... in both univariate ... and multivariate" analyses could be reworded. For example: diabetes was more frequent among transmitters (5/23 vs 3/61; Fisher's exact p = 0.03, OR 5.14, 95% CI 0.90–36.45) and was significantly associated in the multivariate model.
In the Methods, "the remaining 84 clustered cases" should read "the remaining 61 clustered cases (84 in total)".
The authors hold the individual data and could confirm these values, and the Fig 5 HIV row, against it.