← Back to the plain-language case
Abstract gives the 14-week odds ratio as 2.51; Table 2 counts give 5.02
PLoS Med (2019) · doi:10.1371/journal.pmed.1002832 · PMC6588214
Summary
The abstract of this randomized trial reports the odds ratio for initiating family planning by 14 weeks postpartum, voucher versus control, as 2.51 (CI 1.31–4.79, P < 0.001), whereas Table 2 reports 5.02 [2.27–11.10] for the same comparison. Table 2's own counts, 149 of 158 (voucher) and 122 of 159 (control), give the crude odds ratio the Methods specify, (149 × 37) / (9 × 122) = 5.02; no 2 × 2 table with these group sizes reproduces 2.51 (1.31–4.79), and that interval excludes 5.02. The abstract therefore understates a secondary-outcome effect by a factor of two, although direction, significance, the primary outcome and the conclusions are unchanged. Separately, the abstract, Results and Discussion print the primary outcome's upper confidence limit as 13.97, where Table 2 prints 18.97 and the counts support about 18–19.
What the paper reports
Methods, "Sample size and statistical analysis":
We compared dichotomous outcomes between study groups by estimating crude odds ratios (ORs) with 95% confidence intervals, and testing for differences between the two groups. We estimated P-values with chi-squared testing using a level of significance of 0.05.
Abstract, "Methods and findings":
By 8 weeks postpartum, family planning was initiated in 144 (91%) participants in the voucher group and 83 (52%) participants in the control group (odds ratio [OR] 9.42; CI 4.67–13.97, P < 0.001). We also found high family planning uptake rates for both groups, with higher rates among the intervention group at 12 weeks (OR 5.66; CI 2.65–12.12, P < 0.001), 14 weeks (OR 2.51; CI 1.31–4.79, P < 0.001), 16 weeks (OR 4.02; CI 1.66–9.77, P = 0.001), and 20 weeks (OR 3.65; CI 1.40–9.47, P = 0.004) postpartum.
Table 2, "Primary and secondary outcomes by treatment group" (columns: Outcomes | Routine Care (n = 159) | FP Voucher (n = 158) | OR (95% CI) | P-Value), rows under "Initiation of FP":
8 weeks postpartum | 83 (52.2%) | 144 (91.4%) | 9.42 [4.67–18.97] | <0.001
12 weeks | 115 (72.3%) | 148 (93.7%) | 5.66 [2.65–12.12] | <0.001
14 weeks | 122 (76.7%) | 149 (94.3%) | 5.02 [2.27–11.10] | <0.001
16 weeks | 134 (84.3%) | 151 (95.6%) | 4.02 [1.66–9.77] | 0.001
20 weeks | 139 (87.4%) | 152 (96.2%) | 3.65 [1.40–9.47] | 0.004
Results, second paragraph:
By 8 weeks postpartum (primary outcome), family planning was initiated in 144 (91%) participants in the family planning voucher group and 83 (52%) participants in the standard of care group (OR 9.42; CI 4.67–13.97; Table 2). Contraceptive use rates continued to increase between 8 and 20 weeks and remained consistently significantly higher among the intervention group.
Discussion, first paragraph:
We found that over 90% of women supported through this family planning voucher accessed family planning by 8 weeks postpartum, which corresponds to 9.42 (CI 4.67–13.97) increased odds of initiating family planning by 8 weeks postpartum.
The 14-week odds ratio is not given as a number anywhere else in the text. The Author summary and Discussion refer to the 12- to 20-week results only qualitatively.
What the paper's own numbers show
Method. For each time point I took the Table 2 counts and built the 2 × 2 table: voucher initiators out of 158 against control initiators out of 159. I then computed the crude (sample) odds ratio, the Woolf (log-Wald) 95% interval, the exact conditional interval, and the Pearson chi-squared P value without continuity correction, which is the test the Methods name. For each interval the paper prints, I also back-calculated the standard error of log OR it implies, its geometric midpoint and the Wald P value. Finally I searched every 2 × 2 table with group sizes 158 and 159 for one that reproduces the abstract's 14-week figures. Every number below is printed by recompute.py.txt.
| Quantity | Location | Reported | Recomputed from the paper's own numbers |
|---|---|---|---|
| 14-week OR | Abstract | 2.51 (CI 1.31–4.79), P < 0.001 | 5.02 = (149 × 37) / (9 × 122) = 5513 / 1098 |
| 14-week OR | Table 2 | 5.02 [2.27–11.10], P < 0.001 | 5.02; Woolf 2.33–10.81; exact 2.26–12.25; χ² = 19.73, P = 8.9 × 10⁻⁶ |
| Ratio of the two 14-week ORs | Table 2 vs Abstract | 5.02 / 2.51 | 2.000 |
| Is 5.02 inside the Abstract's CI? | Abstract | 1.31–4.79 | No |
| Wald P implied by the Abstract's own OR and CI | Abstract | P < 0.001 | SE(log OR) 0.331, z = 2.78, P = 0.0054 |
| 2 × 2 tables (n = 158, 159) giving 2.51 with Woolf CI 1.31–4.79 | — | — | none |
| Nearest tables with OR ≈ 2.5 | — | — | need voucher 141 (not 149) or control 138 (not 122); these contradict the printed 94.3% and 76.7% |
| Other effect measures from the 14-week counts | — | — | risk ratio 1.229; inverse OR 0.199; risk difference 17.6 points; none is 2.51 |
| 8-week OR (primary) | Abstract, Results, Discussion | 9.42 (CI 4.67–13.97) | 9.42; Woolf 5.01–17.70; exact 4.87–19.07 |
| 8-week OR (primary) | Table 2 | 9.42 [4.67–18.97] | as above; 18.97 is the log-symmetric mirror of 4.67 around 9.42 (9.42² / 4.67 = 19.00) |
| Geometric midpoint of the 8-week interval | Abstract vs Table 2 | 4.67–13.97 vs 4.67–18.97 | 8.08 vs 9.41 (point estimate 9.42) |
| 12-, 16-, 20-week ORs | Abstract and Table 2 (identical) | 5.66 [2.65–12.12]; 4.02 [1.66–9.77]; 3.65 [1.40–9.47] | 5.66 (2.73–11.73), P = 4.3 × 10⁻⁷; 4.02 (1.69–9.60), P = 0.0008; 3.65 (1.42–9.34), P = 0.0044 |
| ORs from 8 to 20 weeks | Abstract | 9.42, 5.66, 2.51, 4.02, 3.65 | 9.42, 5.66, 5.02, 4.02, 3.65 (strictly decreasing) |
| 8-week voucher percentage | Table 2 | 144 (91.4%) | 144 / 158 = 91.1% (Abstract and Results say 91%) |
At all five time points the Table 2 odds ratios reproduce exactly from the Table 2 counts. So do the P values, to their printed precision. The Table 2 intervals are centred on their odds ratios on the log scale (geometric midpoints 9.41, 5.67, 5.02, 4.03, 3.64). They are slightly wider than the Woolf intervals, with implied standard errors 1.02 to 1.11 times the Woolf values. I could not identify the exact interval procedure used. These small differences are not part of the finding. The abstract's 14-week line is the only one of the five whose point estimate disagrees with the counts. The 8-week upper limit printed in the text is the only one of these initiation intervals that is not symmetric on the log scale around its estimate: it sits 0.70 log units below 9.42 but only 0.39 above.
Figure
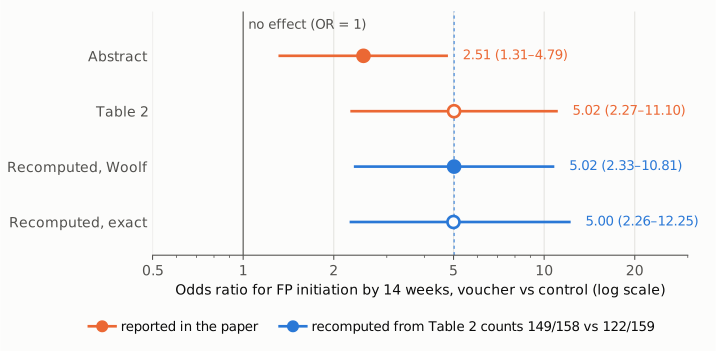
Figure 1. The odds ratio for initiating family planning by 14 weeks, voucher versus control, on a log scale. Orange rows are the values printed in the paper. Filled: the abstract, 2.51 (1.31–4.79). Open: Table 2, 5.02 (2.27–11.10). Blue rows are recomputed from the Table 2 counts, 149/158 versus 122/159. Filled: the crude odds ratio with Woolf interval, 5.02 (2.33–10.81). Open: the conditional maximum-likelihood estimate with exact interval, 5.00 (2.26–12.25). The dashed blue line marks the recomputed 5.02, which falls outside the abstract's interval. The solid grey line marks no effect (OR = 1). The log scale is the natural one for ratios and does not exaggerate the gap: the abstract value is half the recomputed one.
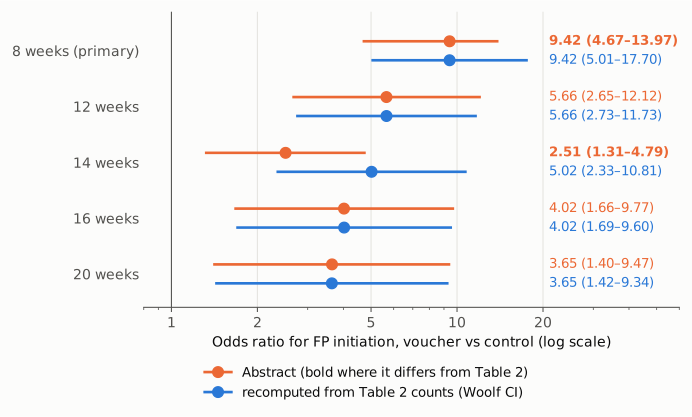
Figure 2. Odds ratios with 95% intervals at each time point, log scale. Orange: as printed in the abstract. Blue: recomputed from the Table 2 counts (Woolf interval). At 12, 16 and 20 weeks the two agree, apart from small differences in interval method. At 14 weeks the abstract's estimate is half the recomputed one, and it breaks an otherwise steady decline from 9.42 to 3.65 as uptake rises in the control arm. At 8 weeks the point estimates agree, but the abstract's upper limit, 13.97, falls short of the recomputed 17.70 and of the 18.97 in Table 2. Labels in bold mark the abstract values that differ from Table 2.
Why it matters
- The abstract misstates an effect size. Initiation by 14 weeks is a prespecified secondary outcome. The abstract is the most widely read and most often indexed part of the paper, and it is the only place the 14-week odds ratio appears in the text. A reader of the abstract alone sees a 14-week effect of about 2.5, with an interval that excludes the value the data give, about 5.0.
- It distorts the time course. The abstract's sequence 9.42, 5.66, 2.51, 4.02, 3.65 suggests the effect dips at 14 weeks and then recovers. The counts show a steady decline (9.42, 5.66, 5.02, 4.02, 3.65) as the control arm catches up. A meta-analyst who takes the 14-week estimate from the abstract would enter a value too small by half, with a standard error too small as well (0.331 rather than 0.391).
- The abstract's 14-week line is internally inconsistent. Its interval implies P ≈ 0.005, not the P < 0.001 printed beside it. The printed P matches the Table 2 result instead (χ² P = 8.9 × 10⁻⁶).
- The primary-outcome interval is misprinted in three places. The abstract, Results and Discussion give 4.67–13.97 for the 8-week odds ratio. Table 2, which the Results sentence cites, gives 4.67–18.97, and the counts support an upper limit of about 18–19. The point estimate and its significance are unaffected, but the stated precision of the main result is overstated at the upper end.
- What is not affected. The direction and statistical significance of every comparison, the primary-outcome estimate (9.42), the 12-, 16- and 20-week results, and the paper's conclusions are unchanged. The correct 14-week value strengthens rather than weakens the reported benefit.
Explanations considered
- A text-conversion or typesetting artifact. Ruled out. The publisher's HTML abstract and typeset PDF (p. 2 abstract, p. 13 Table 2) carry the same values. So do the Europe PMC full-text XML, where each number sits in its own table cell, and the PMC copy. The two values differ by exactly a factor of two, not by a dropped digit, decimal point or sign.
- A different interval method. Cannot explain it. The interval method changes the limits, not the point estimate. Every standard method applied to these counts (Woolf, exact, conditional MLE) gives an estimate of 5.0, with intervals from about 2.3 to 11–12.
- A different effect measure. Not supported. From the same counts the risk ratio is 1.23, the inverse odds ratio 0.199 and the risk difference 17.6 percentage points. None equals 2.51.
- An adjusted estimate. Not supported by the paper. The Methods mention multivariable logistic regression to assess confounding, but the paper reports no adjusted 14-week estimate and does not label the abstract value as adjusted. The other four odds ratios in the same abstract sentence are identical to the crude Table 2 values, and the abstract's "P < 0.001" agrees with the crude test, not with its own interval.
- A subgroup. Not supported. The only subgroup in Table 2 is women who wanted no pregnancy in the next 2 years (n = 72 per arm, as implied by its counts and percentages). Its odds ratios are 8.31 at 8 weeks and 4.01 at 6 months, and it has no 14-week row.
- An error in the Table 2 counts rather than the abstract. Not supported. The counts match their own percentages (149/158 = 94.3%, 122/159 = 76.7%) and give exactly the odds ratio and P value printed beside them. To obtain an odds ratio near 2.5 the voucher count would have to be 141 instead of 149, or the control count 138 instead of 122. Either would contradict the printed percentages and put the 14-week count out of order with its neighbours (148 at 12 weeks, 151 at 16 weeks; 115 and 134 in the control arm). No 2 × 2 table with these group sizes reproduces 2.51 (1.31–4.79). The abstract interval is also not simply the Table 2 interval halved: 2.27/1.31 = 1.73 and 11.10/4.79 = 2.32. I could not identify how the abstract figures were produced.
- A correction already issued. None found (see Status).
- The 8-week upper limit 13.97. It differs from Table 2's 18.97 in a single digit. Table 2's value is supported by three things: the counts (Woolf upper limit 17.70, exact 19.07), the log-scale symmetry of the other four initiation intervals, and the Results sentence's own citation of Table 2. The printed 13.97 makes the interval asymmetric around 9.42 (geometric midpoint 8.08).
- Side observation. Table 2 prints the 8-week voucher percentage as 91.4%; 144/158 is 91.1%. The abstract and Results round it to 91%. This affects no conclusion.
Status
- Version of record. The DOI resolves to the PLOS Medicine article page (journals.plos.org/plosmedicine/article?id=10.1371/journal.pmed.1002832). Three copies were checked: the HTML abstract, the publisher's 20-page printable PDF (text extracted with PyMuPDF; abstract on p. 2, Results p. 9, Discussion p. 10, Table 2 p. 13), and the Europe PMC full-text XML. All three carry the values quoted here: 2.51 (1.31–4.79) in the abstract, 5.02 [2.27–11.10] in Table 2, and 4.67–13.97 in the text against 4.67–18.97 in Table 2. Every quotation above was checked verbatim against the PMC-archived text with
src/show.py. - Supplements. S1 Text (counseling standard operating procedure), S2 Text (study protocol), S3 Text (follow-up tool) and S4 Text (CONSORT checklist). None contains outcome or source data. The deciding counts are already in Table 2.
- Corrections and comments. As of 2026-10-24 I found no correction, erratum, expression of concern or retraction.
src/known.pyreturns no Crossref update relations, no PMC notices and no Europe PMC notices. The Crossref record has no update-to or updated-by entries and an empty relation field. The PMC record lists no related notices, and the PLOS article page shows no correction notice and "Reader Comments (0)". The PubPeer API returned no record (HTTP 404) for the DOI, and a web search for the title with "PubPeer" found no thread. - Sources. PMC article PMC6588214; https://doi.org/10.1371/journal.pmed.1002832 (PLOS Medicine HTML and printable PDF); Europe PMC full-text XML; Crossref; Europe PMC; PubPeer; trial registration NCT02964169.
Suggested correction
In the abstract, replace
14 weeks (OR 2.51; CI 1.31–4.79, P < 0.001)
with
14 weeks (OR 5.02; CI 2.27–11.10, P < 0.001)
so that it matches Table 2 and the counts 149/158 versus 122/159.
In the abstract, the second paragraph of the Results and the first paragraph of the Discussion, replace the 8-week interval "CI 4.67–13.97" with "CI 4.67–18.97", as in Table 2. The authors may also wish to change the 8-week voucher percentage in Table 2 from 91.4% to 91.1% (144/158), and to state which interval method Table 2 uses, since its limits differ slightly from the Woolf intervals for the same counts.