← Back to the plain-language case
Abstract gives the earlier cohort's 70% accuracy as this trial's result; recomputed value is 63%
PLoS Med (2019) · doi:10.1371/journal.pmed.1002813 · PMC6546206
Summary
The abstract of this multi-institutional validation trial (MULTI-IMPROD, 338 men analysed) reports that "the accuracy and NPV of IMPROD bpMRI for SPCa were 70% (113/161) and 95% (71/75)". The NPV of 71/75 belongs to this trial. The accuracy of 113/161, however, is the figure printed in Table 3 for the earlier single-centre IMPROD trial (161 men). From the paper's own Table 2 counts, accuracy in the 338-man trial is (142 + 71)/338 = 213/338 = 63.0% (Wilson 95% CI 57.8%–68.0%). Table 3 prints this as 63%, but with the count 217/338, which is 64.2%. Overall accuracy is part of the trial's stated primary outcome, so the abstract overstates a primary-outcome result by 7.2 percentage points, by a value outside its 95% CI. It also hides the fall in accuracy between the earlier trial and the validation. The paper's headline conclusion, a high NPV, does not depend on this figure and stands.
What the paper reports
Abstract, Methods and findings (the primary outcome and the cohort):
The primary outcome of the trial was diagnostic accuracy—including overall accuracy, sensitivity, specificity, negative predictive value (NPV), and positive predictive value—of IMPROD bpMRI for clinically significant PCa (SPCa), which was defined as a Gleason score ≥ 3 + 4 (Gleason grade group 2 or higher). In total, 338 (338/364, 93%) prospectively enrolled men completed the trial.
Abstract, Methods and findings, the next sentence:
The accuracy and NPV of IMPROD bpMRI for SPCa were 70% (113/161) and 95% (71/75) (95% CI 87%–98%), respectively.
Methods, "Study end points":
The primary outcome of the trial was diagnostic accuracy—including overall accuracy, sensitivity, specificity, NPV, and positive predictive value—of IMPROD bpMRI for SPCa, which was defined as a Gleason score ≥ 3 + 4.
Table 3, title and rows (columns: Measure | MULTI-IMPROD trial | IMPROD trial):
Comparison between the current trial (MULTI-IMPROD trial) and the pre-validation cohort (IMPROD trial).
Patient cohort in total | 338 | 161
Sensitivity* | 97% (142/146) [93%–99%] | 95% (79/83) [88%–98%]
Specificity* | 37% (71/192) [31%–44%] | 44% (34/78) [33%–55%]
NPV* | 95% (71/75) [87%–98%] | 90% (34/38) [76%–96%]
PPV* | 54% (141/263) [48%–60%] | 64% (79/123) [55%–72%]
Accuracy* | 63% (217/338) | 70% (113/161)
Table 3, footnote:
*Sensitivity, specificity, NPV, PPV, and accuracy values are based on binary classification (IMPROD bpMRI Likert score 1–2 versus 3–5) for predicting prostate cancer with Gleason score ≥ 3 + 4.
Table 2, title (the table gives men per Likert score 1–5 by biopsy outcome; its cells are used below):
Prevalence of prostate cancer and clinically significant prostate cancer in different IMPROD bpMRI Likert score groups based on a cohort of 338 men.
Results, "Diagnostic accuracy", first paragraph (relevant to a secondary finding below):
SPCa was diagnosed in 5% (2/34), 5% (2/41), 12% (8/66), 39% (23/59), and 88% (121/138) of men with IMPROD bpMRI Likert scores of 1, 2, 3, 4, and 5, respectively (Table 2).
What the paper's own numbers show
Method. Table 2 gives, for each Likert score from 1 to 5, the number of men with no cancer, Gleason 3+3, Gleason 3+4 and Gleason > 3+4. I checked that each column sums to its printed total (338 in all). Using the Table 3 footnote's definitions (test positive = Likert 3–5; reference positive = SPCa, Gleason ≥ 3+4), I built the 2 × 2 table for the 338 men. From it I computed sensitivity, specificity, NPV, PPV and overall accuracy, (TP + TN)/N, each with a Wilson 95% CI, and compared them with Table 3 and the abstract. I did the same for the earlier IMPROD trial from its Table 3 counts. Every number below is printed by recompute.py.txt.
| Quantity | Location | Reported | Recomputed from the paper's numbers |
|---|---|---|---|
| 2 × 2 cells, this trial | Table 2 | (cell counts by Likert score) | TP = 8 + 23 + 111 = 142, FN = 2 + 2 = 4, FP = 263 − 142 = 121, TN = 75 − 4 = 71; N = 338 |
| Sensitivity, this trial | Table 3 | 97% (142/146) [93%–99%] | 142/146 = 97.3% [93.2–98.9]; matches |
| Specificity, this trial | Table 3 | 37% (71/192) [31%–44%] | 71/192 = 37.0% [30.5–44.0]; matches (lower bound differs by under one point) |
| NPV, this trial | Table 3; Abstract | 95% (71/75) [87%–98%] | 71/75 = 94.7% [87.1–97.9]; matches |
| PPV, this trial | Table 3 | 54% (141/263) [48%–60%] | 142/263 = 54.0% [48.0–59.9]; percentage matches, numerator printed one too low (141/263 = 53.6%) |
| Overall accuracy, this trial | Table 3 | 63% (217/338) | (142 + 71)/338 = 213/338 = 63.0% [57.8–68.0]; percentage matches, but 217/338 = 64.2% |
| Overall accuracy, as given in the abstract | Abstract | 70% (113/161) | 113/161 = 70.2%. Denominator 161 is not this trial's N (338); 70.2% lies outside the 57.8–68.0% CI of the recomputed value |
| Overall accuracy, earlier IMPROD trial | Table 3, IMPROD column | 70% (113/161) | (79 + 34)/161 = 113/161 = 70.2% [62.7–76.7]; identical to the abstract figure |
| NPV, earlier IMPROD trial | Table 3, IMPROD column | 90% (34/38) | 34/38 = 89.5% |
| Gap between abstract accuracy and this trial's accuracy | derived | — | 70.2% − 63.0% = 7.2 percentage points |
| SPCa in Likert 5 (secondary finding) | Results, "Diagnostic accuracy" | 88% (121/138) | Table 2: 37 + 74 = 111/138 = 80.4%. With 121 the per-score SPCa counts would total 156, not the 146 used throughout |
The abstract's single sentence therefore combines two cohorts: its NPV (71/75) comes from the 338 men of this trial, and its accuracy (113/161) from the 161 men of the earlier trial. Accuracy for this trial, from its own cells, is 63.0%, which is the percentage Table 3 prints.
Figure
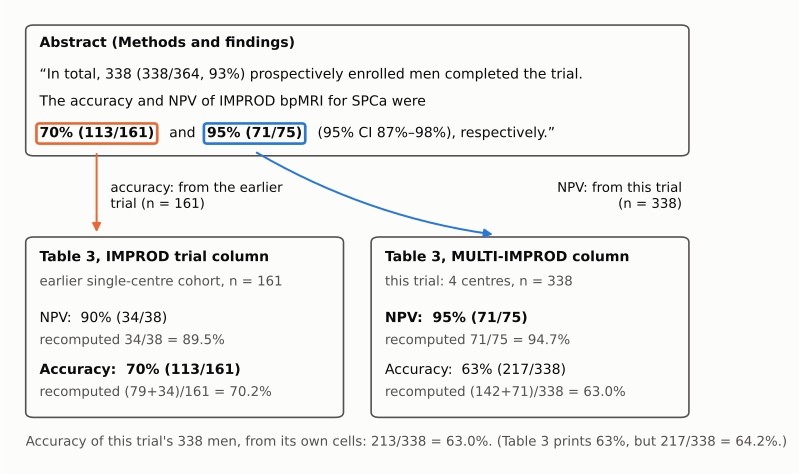
Figure 1. Where each number in the abstract sentence comes from. Top: the two consecutive abstract sentences, quoted verbatim; the accuracy figure (orange outline, as reported) and the NPV figure (blue outline) are boxed. Bottom: the two columns of Table 3, with each printed value and the value recomputed from that column's own counts (TP + TN over the cohort N for accuracy; TN over test negatives for NPV). The abstract's accuracy, 70% (113/161), is the earlier single-centre cohort's value; its NPV, 95% (71/75), is this trial's. The recomputed accuracy for this trial's 338 men is 213/338 = 63.0%. All numbers are from the paper's Abstract, Table 2 and Table 3, or from recompute.py.txt.
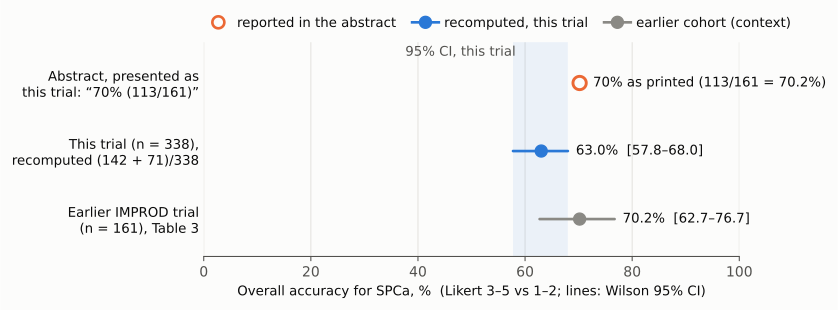
Figure 2. Overall accuracy for SPCa on one 0–100% axis. The hollow orange dot is the abstract's reported value (70%; 113/161 = 70.2%). The blue dot and line are the accuracy recomputed for this trial's 338 men from Table 2 (213/338 = 63.0%, Wilson 95% CI 57.8–68.0%, also shaded). The gray dot and line are the earlier IMPROD trial (113/161 = 70.2%, 62.7–76.7%), shown for context: the abstract value coincides with it and falls outside the CI for this trial.
Why it matters
- It is a primary-outcome figure in the abstract. The abstract and Methods both name overall accuracy as part of the primary outcome. The abstract gives 70% for this trial; the trial's own data give 63.0%. The abstract is the part of the paper most readers, indexers and guideline reviewers see.
- It hides the change between cohorts. Read correctly, accuracy fell from 70.2% in the earlier single-centre trial to 63.0% in the multi-institutional validation, in line with the falls in specificity (43.6% to 37.0%) and PPV (64.2% to 54.0%) shown in Table 3. The aim stated in the abstract is to validate the protocol in a multi-institutional setting, so this change is what a reader of a validation study needs to see. Quoting the earlier figure as the result makes the two cohorts look identical on this measure.
- What is not affected. The abstract's conclusion rests on the NPV, "IMPROD bpMRI demonstrated a high NPV for SPCa", and that value (95%, 71/75, CI 87%–98%) is reported correctly. So are the 97% sensitivity and the 22% (75/338) reduction in biopsies with 4/146 SPCa missed. The direction of the findings does not change; the magnitude of overall accuracy does.
- Smaller count errors. Table 3's accuracy count (217/338) and PPV count (141/263) do not match the 2 × 2 cells (213 and 142); the printed percentages are right. The Results text gives SPCa in Likert 5 as 88% (121/138), whereas Table 2 gives 111/138 = 80.4%. This last figure enters the description of how SPCa prevalence rises with Likert score, which readers use when weighing whether to biopsy a Likert 5 finding.
Explanations considered
- The abstract deliberately quotes the earlier cohort. Does not account for it. The preceding sentence introduces "338 (338/364, 93%) prospectively enrolled men", and the same sentence pairs the accuracy with this trial's NPV (71/75) using "respectively". Nothing in the abstract tells the reader that 113/161 comes from the earlier IMPROD trial (NCT01864135).
- A different definition, threshold or subgroup. Does not account for it. The Table 3 footnote states that all five metrics use the same cut (Likert 1–2 versus 3–5) and the same reference (Gleason ≥ 3+4). No subgroup of the 338 men with 161 members is reported; 161 is the total of the earlier cohort in Table 3. The 2 × 2 cells rebuilt from Table 2 reproduce Table 3's sensitivity, specificity and NPV and their CIs, and give an accuracy of 213/338 = 63.0%.
- Alternative definitions of SPCa in the supplements. Does not account for it. S1 Table and S2 Table (two alternative SPCa definitions) give MULTI-IMPROD accuracies of 62% (210/338) and 48% (163/338). In both, accuracy equals TP + TN over 338, and neither is 70% or uses 161.
- Rounding. Does not account for it. 70% against 63% is 7.2 percentage points.
- A text-conversion error in the PMC copy. Ruled out. The publisher's HTML and PDF print the same abstract sentence and the same Table 3 values; the PMC and Europe PMC XML carry each value in its own correctly aligned table cell.
- Is Table 3's 217/338 the true count, with 63% the slip? No. 217 is inconsistent with the table's own sensitivity and specificity numerators (142 + 71 = 213) and with 63% (217/338 = 64.2%). The percentage is right and the numerator is off by 4. Likewise the PPV numerator 141 should be 142 (TP), with no effect on the printed 54%.
- Likert 5 count of 121. Table 2 gives 37 + 74 = 111 men with SPCa among 138 at Likert 5, and only 111 makes the per-score counts sum to the 146 SPCa cases used throughout. The figure 121 does appear elsewhere in the paper as the number of SPCa cases detected by targeted biopsy (121/338 and 121/263), but that is a different quantity with different denominators, so it does not reconcile 121/138.
Status
- Version of record. The publisher's HTML (journals.plos.org/plosmedicine, article 10.1371/journal.pmed.1002813) and the publisher's PDF (abstract on page 2, Table 3 on page 8) print the abstract sentence and Table 3 exactly as quoted. The PMC and Europe PMC full-text XML match. Every quote above was checked verbatim against the PMC-archived text.
- Supplements. The paper lists three supplementary files: S1 CONSORT checklist, S1 Table and S2 Table (alternative SPCa definitions). S1 and S2 Table were downloaded from PLOS and parsed; they are discussed under explanation 3 and do not reconcile the abstract figure. The protocols.io record linked from Crossref (doi:10.17504/protocols.io.ynifvce) is the imaging protocol and holds no outcome data; it was not opened.
- Corrections and comments. As of 2026-10-23 no correction, erratum, expression of concern or retraction was found. Crossref lists no update relations for the DOI; PMC and Europe PMC list no correction notices (the PMC record links three related articles of type "commentary", none a correction); a Crossref search for a "Correction:" item with this title under the PLOS prefix found none; the PLOS article page shows no correction notice; a web search found only the original article. PubPeer could not be checked: its API and search page both returned an HTTP 403 (Cloudflare challenge) to automated access.
- Sources. PMC article PMC6546206; publisher page and PDF at journals.plos.org; S1 and S2 Table (PLOS supplementary files); Crossref; Europe PMC; ClinicalTrials.gov registrations NCT02241122 and NCT01864135 as cited in the paper.
Suggested correction
- Abstract, Methods and findings: replace "The accuracy and NPV of IMPROD bpMRI for SPCa were 70% (113/161) and 95% (71/75) (95% CI 87%–98%), respectively." with "The accuracy and NPV of IMPROD bpMRI for SPCa were 63% (213/338) and 95% (71/75) (95% CI 87%–98%), respectively." If a CI for accuracy is wanted, the Wilson 95% CI is 58%–68%. If the authors wish to compare with the earlier trial, say so explicitly (for example, "compared with 70% (113/161) in the pre-validation IMPROD trial").
- Table 3, MULTI-IMPROD column: change "Accuracy 63% (217/338)" to "63% (213/338)" and "PPV 54% (141/263)" to "54% (142/263)".
- Results, "Diagnostic accuracy", first paragraph: change "88% (121/138)" to "80% (111/138)" for Likert score 5, as in Table 2.