← Back to the plain-language case
Abstract reports low birthweight rising from 9.0% to 10.1%; Table 1 shows 8.2% to 8.3%
Int J Epidemiol (2018) · doi:10.1093/ije/dyy106 · PMC6422062
Summary
The abstract of this four-cohort study from Pelotas, Brazil, states that the prevalence of low birthweight (LBW, < 2500 g) "increased from 9.0% to 10.1%" between 1982 and 2015, and that LBW was "higher for boys". The paper's own Table 1 counts give 478/5811 = 8.2% in 1982 and 345/4151 = 8.3% in 2015. No cohort reaches 10.1%, and the abstract's 9.0% matches the 2004 value. The Results, Discussion and Key Messages all describe LBW as stable (P for trend = 0.80, which reproduces exactly from the counts), and Table 2 shows LBW higher for girls in all four cohorts. LBW is one of the two outcomes named in the title, so the abstract reports a change in direction and size, and a sex difference, that the paper's tables and text do not support. The preterm figures in the same abstract sentence check out.
What the paper reports
Abstract, Results (the full sentence):
Preterm births increased from 5.8% (1982) to 13.8% (2015), and LBW prevalence increased from 9.0% to 10.1%, being higher for boys and for children born to mothers with low income and brown or black skin colour.
Abstract, Methods:
Four population-based birth cohort studies were carried out in the city of Pelotas in 1982, 1993, 2004 and 2015, with samples ranging from 4231 to 5914 liveborn children. Low birthweight (LBW) was defined as <2500 g
Methods, statistical analysis paragraph:
All analyses were restricted to live, singleton newborns.
Results, first paragraph:
The numbers of liveborn singletons in the four cohorts were 5816, 5168, 4147 and 4164. Birthweight information was missing for 5 (0.09%), 17 (0.33%), 1 (0.02%) and 13 (0.31%) children, respectively.
Table 1, "<2500" row (1982 | 1993 | 2004 | 2015):
<2500 | 8.2 | 9.1 | 9.0 | 8.3
Results, paragraph on Table 1:
The proportion of newborns with low birthweight remained stable at around 8% to 9% throughout the period (P for trend = 0.80).
Results, paragraph on Table 2:
As expected due to the use of the same absolute cutoff for both sexes, prevalence was higher among girls than boys in the four cohorts. There was no evidence of a time trend in low birthweight for either sex.
Table 2, sex rows (% LBW, 95% CI; 1982 | 1993 | 2004 | 2015 | P for linear trend):
Male | 7.2 (6.3; 8.1) | 8.0 (6.9; 9.0) | 8.1 (7.0; 9.3) | 7.6 (6.5; 8.7) | 0.476
Female | 9.3 (8.2; 10.4) | 10.2 (9.1; 11.4) | 9.9 (8.6; 11.2) | 9.1 (7.8; 10.3) | 0.784
Discussion:
One important finding of our study is that—for the whole population—mean birthweight and LBW prevalence remained stable.
Key Messages box (in the PMC archive copy this box follows the Funding statement):
At the population level, mean birthweight remained stable from 1982 to 2015, as did low birthweight.
What the paper's own numbers show
Method. Table 1 gives the number of live singletons in each 500 g birthweight band, plus the number not weighed. For each cohort I added the four bands below 2500 g and divided by the number weighed (band total, which equals the cohort total minus those not weighed). I recomputed the chi-square test for linear trend over the four cohorts (Cochran-Armitage; the Methods name "the chi-square statistic for linear trend"), the 1982–2015 difference with a Wald 95% CI, and Wilson 95% CIs per cohort. As a control I recomputed the preterm percentages from Table 1's gestational-age counts. I compared the abstract's sex statement with Table 2, and searched every LBW value in Tables 1 and 2 for a 9.0 (1982) to 10.1 (2015) series. Every number below is printed by recompute.py.txt.
| Quantity | Location | Reported | Recomputed from the paper's numbers |
|---|---|---|---|
| LBW, 1982 | Abstract; Table 1 | 9.0% (abstract); 8.2 (Table 1) | (17+40+92+329)/5811 = 478/5811 = 8.23% (95% CI 7.55–8.96) |
| LBW, 1993 | Table 1 | 9.1 | 468/5151 = 9.09% (8.33–9.90) |
| LBW, 2004 | Table 1 | 9.0 | 372/4146 = 8.97% (8.14–9.88), the value the abstract gives for 1982 |
| LBW, 2015 | Abstract; Table 1 | 10.1% (abstract); 8.3 (Table 1) | (15+24+56+250)/4151 = 345/4151 = 8.31% (95% CI 7.51–9.19) |
| Weighed + not weighed = cohort total | Table 1 | 5816, 5168, 4147, 4164 | 5811+5, 5151+17, 4146+1, 4151+13: all match |
| LBW over all singletons, including the unweighed | Table 1 | — | 8.22%, 9.06%, 8.97%, 8.29% (no material change) |
| Highest LBW in any cohort | Table 1 | — | 9.09% (1993); no cohort rounds to 10.1% |
| Change 1982 → 2015 | Abstract vs Table 1 | +1.1 points (9.0 → 10.1), a 12.2% relative rise | +0.09 points (95% CI −1.01 to +1.18), a 1.0% relative rise |
| Linear trend, four cohorts | Results | P = 0.80 | χ² = 0.062, Z = 0.25, P = 0.803 (same with ordinal scores) |
| LBW by sex | Abstract vs Table 2 | "higher for boys" (abstract) | Table 2: girls higher in all four cohorts, by 2.1, 2.2, 1.8 and 1.5 points (Table 2 P = 0.003, 0.005, 0.044, 0.089) |
| Any Table 2 row running 9.0 → 10.1 | Table 2 | — | none (girls 9.3 → 9.1; poorest quintile 13.5 → 11.7) |
| Preterm (< 37 weeks), control | Abstract; Table 1 | 5.8% (1982), 13.8% (2015) | 265/4595 = 5.77%; 576/4164 = 13.83%: match |
Table 1, the trend P value in the Results, the Discussion and the Key Messages agree with one another. Only the abstract's LBW figures and its sex statement are out of line. The preterm half of the same abstract sentence reproduces exactly.
Figure
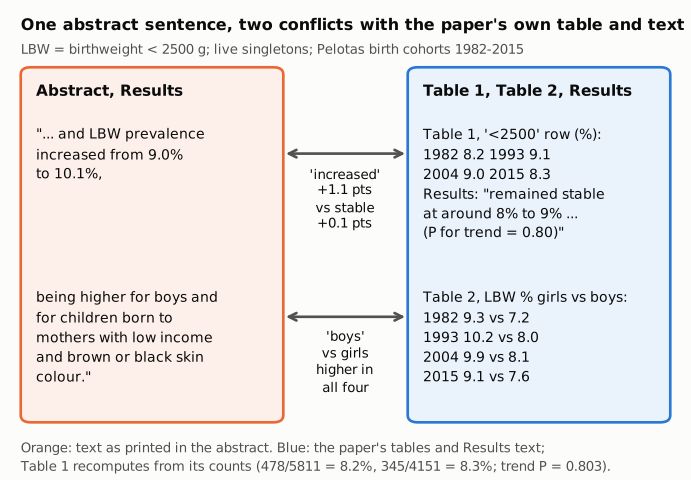
Figure 1. The abstract's Results sentence on LBW (left, orange: text as printed in the abstract) beside the paper's own tables and Results text (right, blue). The upper connector marks the conflict over direction: the abstract says LBW "increased" from 9.0% to 10.1% (+1.1 points), while Table 1 prints 8.2, 9.1, 9.0 and 8.3 and the Results call LBW stable (P for trend = 0.80). Recomputed from the Table 1 counts, LBW is 478/5811 = 8.2% in 1982 and 345/4151 = 8.3% in 2015 (+0.1 points), with trend P = 0.803. The lower connector marks the conflict over sex: the abstract says LBW was higher for boys, while Table 2 gives higher values for girls in every cohort (9.3 vs 7.2 in 1982, 10.2 vs 8.0, 9.9 vs 8.1, 9.1 vs 7.6 in 2015). All values come from the paper or from recompute.py.txt.
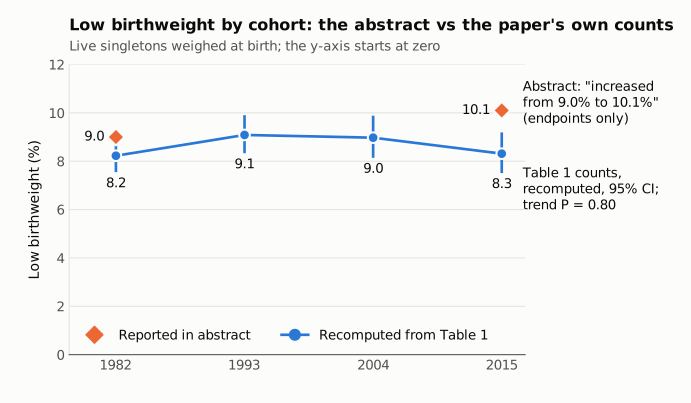
Figure 2. LBW prevalence by cohort, recomputed from the Table 1 counts (blue circles joined by a line, with Wilson 95% CIs), and the two values the abstract gives for 1982 and 2015 (orange diamonds). The abstract gives endpoints only, so they are not joined. The y-axis starts at zero. The recomputed series is flat at 8.2–9.1% (trend P = 0.80). The abstract's 1982 value (9.0%) lies just above the 1982 CI (7.55% to 8.96%), and its 2015 value (10.1%) lies above the whole 2015 CI (7.51% to 9.19%) and above every cohort.
Why it matters
LBW is one of the two outcomes in the title, and the abstract is the part of the paper most readers, indexers and evidence summaries use. The abstract tells them LBW rose by 1.1 percentage points (12% in relative terms) over 33 years. The paper's own data and its own conclusions say LBW did not change (+0.09 points, P = 0.80). A reader who takes the abstract at face value would cite a rising LBW trend in southern Brazil, which this paper does not show. The sex statement is reversed: the paper explains the female excess as expected "due to the use of the same absolute cutoff for both sexes", and the abstract says the opposite.
The paper's main conclusions are not affected. The preterm increase (5.8% to 13.8%), the stable mean birthweight, the income-group trends in mean birthweight, the adjusted 160 g decline and the caesarean-section interpretation are all stated correctly in the abstract and body. A flat LBW series is also what the abstract's own Background and Conclusions imply ("did not show reductions", "offset the expected improvements"), so the correct figures fit the paper's argument better than the printed ones. The LBW gradients by income and skin colour in the same abstract sentence are broadly consistent with Table 2 and were not examined further here.
Explanations considered
- A different denominator (excluding vs including unweighed babies). LBW over weighed newborns gives 8.23% and 8.31%; over all live singletons, 8.22% and 8.29%. Neither gives 9.0% or 10.1%. Does not explain it.
- A different population: all live births, including multiples. The abstract's Methods describe "samples ranging from 4231 to 5914 liveborn children", larger than the singleton counts, and multiples are mostly LBW. The paper does not report non-singleton counts or their birthweights, so this cannot be fully excluded from the paper's numbers alone. To reach 10.1% in 2015 would need at least 83 extra live births, every one of them LBW. If the 5914 maximum is the 1982 cohort (98 non-singletons), reaching 9.0% would need about 55% of them to be LBW. Against this, the Methods say "All analyses were restricted to live, singleton newborns", the paper reports no all-births LBW rates or trend test, and it states that LBW was stable. Even if the abstract figures came from an all-births tabulation, the abstract would still report a population and a trend that the paper's methods exclude and that its results contradict. This would also not explain the sex statement.
- The earlier three-cohort report. The paper cites its own 2008 report on the 1982, 1993 and 2004 cohorts (Cad Saude Publica 2008;24 Suppl 3:S390–S398), whose abstract says "We found a slight increase in the period in the low birth weight prevalence from 9% to 10%". The abstract's 9.0% → 10.1% resembles that earlier description, but this paper's tables and text use different figures. This may account for where the wording came from; it does not reconcile it with this paper's data.
- Gestational-age method (LMP vs best obstetric estimate). This changes only the preterm figures (the LMP-only reanalysis gives 5.8%, 11.2%, 16.2%, 17.7%). Birthweight does not depend on it. Does not explain it.
- A subgroup. No Table 2 row runs from 9.0 in 1982 to 10.1 in 2015 (girls 9.3 → 9.1, poorest quintile 13.5 → 11.7, black mothers 10.3 → 8.2). Does not explain it.
- A rounding or transcription issue in Table 1. The printed percentages reproduce from the counts to one decimal place, the band totals plus the unweighed equal the stated cohort sizes, and the trend P reproduces to 0.803. The table is internally consistent; the discrepancy is between the abstract and the table.
- A text-conversion artefact. The same abstract sentence appears in the publisher's version of record, Europe PMC full text, PubMed and the PMC archive copy. Not a conversion artefact.
Status
As of 2026-10-23:
- Version of record. The DOI resolves to the publisher's page (Int J Epidemiol 48 Suppl 1:i46–i53; online June 2018, print issue April 2019). Its abstract contains the same sentence ("LBW prevalence increased from 9.0% to 10.1%, being higher for boys ..."), and its Table 1 gives 8.2, 9.1, 9.0 and 8.3. The same text appears in Europe PMC full-text XML, the PubMed record (PMID 29939270) and the PMC archive copy.
- Supplements. The PMC/Europe PMC record has no supplementary material (Europe PMC hasSuppl = N). The publisher page lists a "Supplementary Data" entry with no files linked. No source data are available. The full PDF is behind a subscription and was not opened.
- Corrections. None found. Crossref shows no update-to, updated-by or relation entries; PMC and Europe PMC list no correction, erratum or retraction notices; the only linked item is a commentary on the supplement (doi:10.1093/ije/dyy214, "Commentary: A tale of many cities in one"), which is not an erratum. Web searches for a correction, erratum or corrigendum, and Retraction Watch, returned nothing relevant.
- PubPeer. Could not be checked: both the API and the search page returned HTTP 403.
- Sources. https://doi.org/10.1093/ije/dyy106; https://academic.oup.com/ije/article/48/Supplement_1/i46/5042986; Europe PMC REST full text for PMC6422062; PubMed efetch for PMID 29939270; Crossref API; Europe PMC record for doi:10.1590/s0102-311x2008001500004 (the 2008 report's abstract).
Suggested correction
In the abstract's Results, replace "and LBW prevalence increased from 9.0% to 10.1%, being higher for boys and for children born to mothers with low income and brown or black skin colour" with wording that matches Table 1, Table 2 and the Results, for example: "while LBW prevalence remained stable (8.2% in 1982 and 8.3% in 2015; P for trend = 0.80), being higher for girls and for children born to mothers with low income and brown or black skin colour." If the 9.0% and 10.1% figures come from a different population, such as all live births including multiples, the authors could say so, give that population's counts, and explain why it differs from the singleton population that the Methods specify for all analyses.