← Back to the plain-language case
IL-6 × leptin feeding interaction: reported F(1,11) = 0.563 gives p = 0.47, not 0.05
Cell Rep (2019) · doi:10.1016/j.celrep.2019.02.044 · PMC6418345
Summary
The Results report a two-way repeated-measures ANOVA on 6-h chow intake after co-injection of subthreshold leptin and IL-6 into the lateral parabrachial nucleus (lPBN; Figure 3J, n = 12 rats). They give the IL-6 × leptin interaction as "F(1, 11) = 0.563, p = 0.05". An F of 0.563 on (1, 11) degrees of freedom has an upper-tail p of 0.469. A p of 0.05 would take F = 4.84, about 8.6 times larger. The reported F and p therefore cannot both be correct. Taken at face value, the F shows no statistically significant interaction. This interaction is the only test of interaction reported for the paper's claim, repeated in the abstract, highlights, Discussion and conclusion, that IL-6 and leptin cooperate in the lPBN to reduce feeding. Every other F/p pair in the Results (15 of 16) is consistent with its recomputed p.
What the paper reports
Results, "Cooperative Interaction of Leptin and IL-6 on Food Intake Control":
Results indicated that IL-6 and leptin indeed interact to suppress food intake (two-way ANOVA: IL-6 alone: F(1, 11) = 0.21, p > 0.05; leptin alone F(1, 11) = 0.88, p > 0.05; interaction IL-6 × leptin F(1, 11) = 0.563, p = 0.05; Figure 3J).
Same paragraph, two sentences later:
BAT region temperature was unaffected (IL-6 alone: F(1, 11) = 4.524, p > 0.05; leptin alone F(1, 11) = 7.652, p < 0.05; interaction IL-6 × leptin F(1, 11) = 1.528, p > 0.05; Figure 3K).
Same paragraph, interpretation:
These results suggest that leptin and IL-6 can acutely act in concert, possibly by sharing a common downstream target, ultimately amplifying each other’s reduction of food intake.
Abstract (Summary):
Parabrachial IL-6 interacted with leptin to reduce feeding.
Highlights:
IL-6 interacts with leptin at the level of the lPBN to reduce food intake
Discussion, third paragraph:
In line with our hypothesis, injection of subthreshold doses of both ligands produced a clear reduction in feeding when co-applied to the lPBN indicating that IL-6 can amplify leptin’s anorexic effects at the level of the lPBN.
Discussion, concluding paragraph:
The latter point, along with the identified here cooperative interaction of exogenously applied IL-6 with leptin in the lPBN, highlights the emerging potential importance of the local circuit identified here for development of obesity therapeutics.
Figure 3 legend (panels J and K):
In a new cohort of 11-week-old male rats (n = 12) chow intake and BAT temperature were measured after intra-lPBN delivery of sub-threshold doses of IL-6 (0.1 μg) or leptin (0.1 μg) alone, or delivery of the two substances together into the lPBN.
two-way ANOVA (J and K) and one-way ANOVA (B–E, G, and I) were used for comparisons with Sidak’s post hoc test.
STAR Methods, microinjections, and Quantification and Statistical Analysis:
All injections were performed in a counterbalanced Latin square design, where each animal received each treatment.
p < 0.05 was considered statistically significant.
What the paper's own numbers show
Method. For every F statistic in the Results, which reports them in three sections (the lPBN leptin dose-response, Figure 3B–3I; the leptin/IL-6 interaction experiment, Figure 3J/3K; and the lPBN IL-6 knockdown, Figure 4G/4H), I computed the ANOVA p-value as the upper-tail probability P(Fdf1, df2 ≥ F) with scipy.stats.f.sf, using the F and degrees of freedom exactly as printed. With 12 rats each receiving all four treatments, F(1, 11) is the expected test for each effect in a 2 × 2 within-subject ANOVA. For df1 = 1, F equals t², so I also report the equivalent t and its one-sided p. All numbers below are printed by recompute.py.txt.
| quantity | location | reported | recomputed |
|---|---|---|---|
| IL-6 × leptin interaction, 6-h chow intake, F(1, 11) = 0.563 | Results, Fig 3J | p = 0.05 | p = 0.469 |
| F(1, 11) needed for p = 0.05 | derived | (implied by p = 0.05) | 4.844 (8.6 × the reported F) |
| F(1, 11) range whose p rounds to 0.05 (0.045 ≤ p < 0.055) | derived | n/a | 4.61 to 5.11 |
| Equivalent t(11) = √0.563; one-sided p | derived | n/a | t = 0.750; p = 0.234 |
| p for F = 0.563 with df1 = 1 and any df2 from 1 to 106 | derived | n/a | 0.45 to 0.59 |
| Smallest F (df1 = 1) that can reach p < 0.05 for any df2 | derived | n/a | 3.841 |
| Leptin dose, 6-h chow intake, F(2, 10) = 5.496 (printed "F (2, 10)") | Results, Fig 3B | p < 0.05 | p = 0.0245 (consistent) |
| Leptin dose, 12-h chow intake, F(2, 10) = 6.685 | Results, Fig 3C | p < 0.05 | p = 0.0143 (consistent) |
| Leptin dose, 24-h chow intake, F(2, 10) = 7.464 | Results, Fig 3D | p < 0.05 | p = 0.0104 (consistent) |
| Leptin dose, 24-h body weight, F(2, 12) = 7.55 | Results, Fig 3E | p < 0.01 | p = 0.00754 (consistent) |
| Leptin dose, core body temperature, F(2, 34) = 1.765 | Results, Fig 3G | p > 0.05 | p = 0.187 (consistent) |
| Leptin dose, locomotor activity, F(2, 34) = 3.493 | Results, Fig 3I | p < 0.05 | p = 0.0417 (consistent) |
| IL-6 main effect, chow intake, F(1, 11) = 0.21 | Results, Fig 3J | p > 0.05 | p = 0.656 (consistent) |
| Leptin main effect, chow intake, F(1, 11) = 0.88 | Results, Fig 3J | p > 0.05 | p = 0.368 (consistent) |
| IL-6 main effect, BAT temperature, F(1, 11) = 4.524 | Results, Fig 3K | p > 0.05 | p = 0.0569 (consistent) |
| Leptin main effect, BAT temperature, F(1, 11) = 7.652 | Results, Fig 3K | p < 0.05 | p = 0.0184 (consistent) |
| IL-6 × leptin interaction, BAT temperature, F(1, 11) = 1.528 | Results, Fig 3K | p > 0.05 | p = 0.242 (consistent) |
| Knockdown, interaction, F(17, 544) = 8.345 | Results, Fig 4G | p < 0.01 | p = 5.05 × 10⁻¹⁹ (consistent) |
| Knockdown, treatment, F(1, 32) = 7.548 | Results, Fig 4G | p < 0.05 | p = 0.00978 (consistent) |
| Knockdown, interaction, F(17, 544) = 4.944 | Results, Fig 4H | p < 0.01 | p = 5.28 × 10⁻¹⁰ (consistent) |
| Knockdown, treatment, F(1, 32) = 3.462 | Results, Fig 4H | p > 0.05 | p = 0.072 (consistent) |
Fifteen of the sixteen F/p pairs in the Results agree with the recomputation. The one that does not is the interaction on which the cooperative-effect claim rests. Its recomputed p is 9.4 times the printed value.
Figure
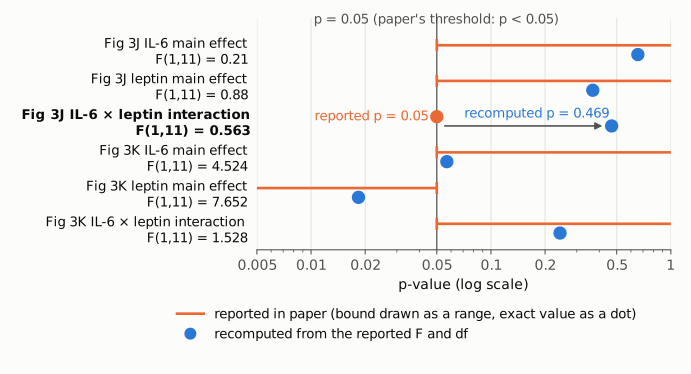
Figure 1. Each row is one F test from the Results paragraph on the leptin/IL-6 interaction experiment (Figure 3J, 6-h chow intake; Figure 3K, BAT temperature). Orange shows what the paper reports: a bound ("p > 0.05" or "p < 0.05") is drawn as the range it allows, and the one exact value (p = 0.05) as a dot. Blue dots are the upper-tail p-values recomputed from the printed F and degrees of freedom. The thin vertical line marks p = 0.05; the paper's own criterion is p < 0.05. Five recomputed values fall inside the range the paper states. For the IL-6 × leptin interaction on chow intake, F(1, 11) = 0.563 gives p = 0.469, not 0.05.
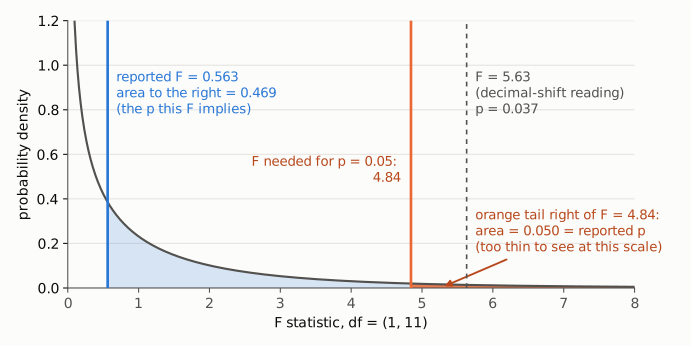
Figure 2. The density of the F distribution with (1, 11) degrees of freedom. The p-value of an ANOVA F test is the area to the right of the observed F. For the reported F = 0.563 (blue line) that area, shaded light blue, is 0.469. The reported p = 0.05 corresponds to the area to the right of F = 4.84 (orange line); that tail is too thin to see at this scale, and the arrow marks where it lies. The dashed line marks F = 5.63, a possible decimal-shift reading of the printed value, which would give p = 0.037. Nothing in the published material confirms that reading.
Why it matters
- The cooperative-effect claim rests on this one statistic. The leptin and IL-6 doses were chosen to be subthreshold, and neither main effect on 6-h chow intake was significant (p = 0.656 and 0.368). The claim that the two ligands "interact to suppress food intake" therefore depends entirely on the interaction term. With the printed F, the interaction has p = 0.469, so the data as reported do not show an interaction.
- The claim reaches the paper's summary statements. It appears in the abstract ("Parabrachial IL-6 interacted with leptin to reduce feeding"), in the highlights, in the Figure 3 title ("Cooperative Interaction of Leptin and IL-6 at the Level of the lPBN"), in the Discussion ("IL-6 can amplify leptin’s anorexic effects"), and in the concluding paragraph, where it is cited as relevant to obesity therapeutics. The Results also propose a possible mechanism (a shared downstream target, likely involving STAT3 phosphorylation).
- Even the printed p does not meet the paper's criterion. The Methods define significance as p < 0.05. As printed, p = 0.05 does not satisfy the paper's p < 0.05 criterion, so the text calls an interaction established at a printed p that the paper's own threshold would not count as significant.
- The paper's other main conclusions are not affected. The effects of lPBN IL-6 on food intake, body weight and BAT thermogenesis, and the effects of IL-6 knockdown, come from separate experiments and separate tests. The leptin dose-response F tests (Figure 3B–3I) and the Figure 4G/4H F tests all recompute consistently.
Explanations considered
- Different degrees of freedom. Does not account for it. With n = 12 rats in a within-subject (Latin square) design, F(1, 11) is the expected test. For F = 0.563 with df1 = 1, every denominator df from 1 to 106 gives p between 0.45 and 0.59. With df1 = 1, no F below 3.84 can reach p < 0.05 for any df2.
- A one-sided test. Does not account for it. The one-sided p for the equivalent t = 0.750 is 0.234, and the Methods describe no one-sided tests.
- The lower tail of F. Does not account for it. P(F ≤ 0.563) = 0.531, and the lower tail is not the ANOVA p-value.
- Rounding. Does not account for it. A p that rounds to 0.05 needs F between 4.61 and 5.11 on (1, 11) df. 0.563 is far outside that range.
- A decimal slip in F. Possible, but not verifiable. F = 5.63 would give p = 0.037, which is close to 0.05 though it would more naturally be reported as "p < 0.05". The supplements contain no per-animal data or ANOVA output to check it. If F was mistyped, the interaction would meet the threshold, and the correction would concern the reported statistics rather than the conclusion.
- A post hoc p placed next to the interaction F. Possible, but not what the text says. The Figure 3 legend states that Sidak's post hoc tests were used, and Figure 3J marks the combination group with a single asterisk. The p = 0.05 could be such a pairwise comparison (for example, combination versus vehicle). The sentence, however, attaches it to "interaction IL-6 × leptin F(1, 11) = 0.563". A post hoc difference between one treatment cell and vehicle would also not by itself establish an interaction (synergy), which requires the combined effect to exceed the sum of the two single-ligand effects.
- A text-conversion artifact. Ruled out. The publisher's typeset version shows the same values (see Status).
- A correction already issued. None found (see Status).
Status
- Version of record. The typeset Cell Reports article, Document S2 "Article plus Supplemental Information" (mmc2.pdf, 32 pages, in the PMC supplementary bundle retrieved from Europe PMC), was checked. On page 8 it reads "interaction IL-6 × leptin F(1, 11) = 0.563, p = 0.05; Figure 3J". The PDF text layer encodes "×" as "3", but a rendered image of the page shows ×, and the numbers are identical. The Europe PMC full-text XML and the live PMC page carry the same passage. The publisher's HTML pages (cell.com, sciencedirect.com) returned HTTP 403 to automated requests, and the doi.org route ended at a redirect stub. Every quotation above was checked verbatim against the PMC-archived text with
src/show.py. - Supplements. Document S1 (mmc1.pdf, Figures S1–S7) and Document S2 were searched. The Figure S4 legend (24-h chow intake for the same experiment) gives no interaction statistic. Neither file contains per-animal data or ANOVA output, and the PMC record lists no source-data file. The interaction F therefore cannot be reconstructed from published material.
- Corrections and comments. As of 2026-10-24 I found no correction, erratum, expression of concern or retraction.
src/known.pyreturns no Crossref update relations, PMC notices or Europe PMC notices. The Crossref record has empty update-to and updated-by fields, and the Crossref Labs record, which includes Retraction Watch data, lists no updates. The Europe PMC core record (PMID 30865890) has no comment or correction entries. The PubPeer API returned HTTP 404 for the DOI, and a web search for the title together with "PubPeer" found no thread. - Sources. PMC article PMC6418345; Europe PMC full-text XML and supplementary files (mmc1.pdf, mmc2.pdf); Crossref and Crossref Labs; Europe PMC; PubPeer; https://doi.org/10.1016/j.celrep.2019.02.044.
Suggested correction
The authors should consult the original ANOVA output for the Figure 3J experiment and correct the interaction statistic in the Results sentence
interaction IL-6 × leptin F(1, 11) = 0.563, p = 0.05
so that F and p agree. If F = 0.563 is correct, the interaction p is 0.47. The statements that IL-6 and leptin interact or cooperate to reduce feeding (abstract, highlights, Results, Figure 3 title, Discussion and conclusion) would then need to be revised or withdrawn, since neither main effect nor the interaction is significant. If the F value is the error (for example 5.63, for which p = 0.037), the corrected F and its exact p should be printed. In either case, as printed, p = 0.05 does not satisfy the paper's p < 0.05 criterion. If p = 0.05 is a Sidak post hoc comparison rather than the interaction test, it should be labelled as such and reported separately from the interaction F.