← Back to the plain-language case
Reported risk ratios are ratios of mean 1/2 codes, understating relative risk reductions for perpetration 9- to 28-fold
JAMA Network Open (2018) · doi:10.1001/jamanetworkopen.2018.1213 · PMC6324287
Summary
This secondary analysis of a cluster randomized trial reports that a school-based HIV/STD risk-reduction intervention reduced self-reported perpetration of forced sex. The reported "risk ratios" for perpetration are 0.978, 0.964, 0.959, 0.967 and 0.964 at 3–54 months, and the paper sums up the effect as "about a 3% reduction in risk". The paper's own counts give risk ratios of 0.39 to 0.67, which are relative reductions of 33% to 61%. Every reported value instead matches (1 + p₁)/(1 + p₀), the ratio of group means of an outcome coded 1 (no) and 2 (yes), which is the coding the Methods describe. After approximate adjustment for the arms' different sex mix, all 10 cumulative-incidence ratios in Table 3 are reproduced to three decimals. The direction of the effect and the significance tests are not affected. What is wrong is the published effect size, its confidence intervals, the sex-comparison ratios in Table 4 and the "3%" statement, and these are the numbers a reader, meta-analyst or guideline would take from the paper.
What the paper reports
Methods, "Outcomes":
Binary variables were used to assess history of ever perpetrating and experiencing forced sexual intercourse, with responses coded 1 for respondents not reporting ever experiencing the event and 2 for those reporting ever experiencing the event.
Methods, "Statistical Analysis" (the superscript is a reference number):
The efficacy of the HIV/STD intervention compared with the control intervention on the forced sex outcomes was tested using generalized estimating equation Poisson regression models, adjusting for gender and students clustered within schools.
Risk ratios42 and corresponding 95% confidence intervals are reported.
Abstract, "Results" (repeated word for word in the Results text):
Fewer intervention than control participants reported forced sex perpetration postintervention compared with the control group at 3 months (9 of 561 [2%] vs 20 of 491 [4%]; risk ratio [RR], 0.978; 95% CI, 0.959-0.997), 6 months (17 of 561 [3%] vs 35 of 491 [7%]; RR, 0.964; 95% CI, 0.941-0.988), 12 months (21 of 561 [4%] vs 42 of 491 [9%]; RR, 0.959; 95% CI, 0.934-0.985), 42 months (41 of 561 [7%] vs 56 of 491 [11%]; RR, 0.967; 95% CI, 0.937-0.998), and 54 months (52 of 561 [9%] vs 68 of 491 [14%]; RR, 0.964; 95% CI, 0.932-0.997).
Table 3 (columns: perpetrating RR (95% CI) | P | experiencing RR (95% CI) | P), first and last rows:
3 | 0.978 (0.959-0.997) | .02 | 0.983 (0.963-1.004) | .11
3-54 | 0.990 (0.982-0.999) | .02 | 0.992 (0.982-1.001) | .09
Table 4 (first five columns: follow-up | boys | girls | "Boys vs Girls, RR (95% CI)" | P), perpetration at 12 months:
12 | 58/495 (12) | 5/557 (1) | 0.904 (0.881-0.928) | <.001
Results text:
Table 4 shows reports of perpetrating and experiencing forced sex were significantly higher among boys compared with girls at each of the postintervention assessments
Among boys, the effect on perpetration of forced sex was significant at 3-month follow-up (RR, 0.952; 95% CI, 0.917-0.988), 6-month follow-up (RR, 0.934; 95% CI, 0.892-0.979), and 12-month follow-up (RR, 0.924; 95% CI, 0.879-0.972)
Discussion, "Limitations":
The magnitude of the intervention effects in this trial was modest, about a 3% reduction in risk.
What the paper's own numbers show
Method. With a log-link Poisson model, the exponentiated arm coefficient estimates the ratio of the outcome's means in the two arms. For a 0/1 outcome that ratio is the risk ratio p₁/p₀. For the 1/2 coding the Methods describe it is (1 + p₁)/(1 + p₀), which stays close to 1 whatever the risks are. For each reported ratio I computed, from the counts printed next to it (Table 2 cumulative and time-specific incidence; Table 4 counts by sex): the risk ratio with an unadjusted Wald CI; the ratio of 1/2-code means with an unadjusted CI; and, as alternative readings, the inverted "no event" ratio (1 − p₀)/(1 − p₁), 1 + risk difference, and the odds ratio. The paper's model is adjusted for sex, and the arms differ in sex mix (Table 1: 306 of 561 vs 251 of 491 girls), while boys report forced sex several times as often as girls (Table 4). I therefore also applied an approximate sex standardization: each arm's expected value under no intervention effect, using the pooled sex-specific risks from Table 4, divides out the confounding. All CIs computed here ignore clustering. They show the scale of each quantity and do not replace the trial's own clustered analysis. Every number below is printed by recompute.py.txt.
| Quantity | Location | Reported | Recomputed from the paper's numbers |
|---|---|---|---|
| Perpetration, 3 mo (9/561 vs 20/491) | Abstract; Results; Table 3 | RR 0.978 (0.959–0.997) | risk ratio 0.394 (0.18–0.86); ratio of 1/2-code means 0.976 (0.957–0.996); sex-standardized 0.978 |
| Perpetration, 6 mo (17/561 vs 35/491) | Abstract; Results; Table 3 | RR 0.964 (0.941–0.988) | risk ratio 0.425 (0.24–0.75); code-mean ratio 0.962 (0.938–0.986); sex-standardized 0.964 |
| Perpetration, 12 mo (21/561 vs 42/491) | Abstract; Results; Table 3 | RR 0.959 (0.934–0.985) | risk ratio 0.438 (0.26–0.73); code-mean ratio 0.956 (0.930–0.982); sex-standardized 0.959 |
| Perpetration, 42 mo (41/561 vs 56/491) | Abstract; Results; Table 3 | RR 0.967 (0.937–0.998) | risk ratio 0.641 (0.44–0.94); code-mean ratio 0.963 (0.933–0.995); sex-standardized 0.967 |
| Perpetration, 54 mo (52/561 vs 68/491) | Abstract; Results; Table 3 | RR 0.964 (0.932–0.997) | risk ratio 0.669 (0.48–0.94); code-mean ratio 0.960 (0.927–0.994); sex-standardized 0.964 |
| Experience, 3/6/12/42/54 mo | Table 3 | 0.983 / 0.977 / 0.966 / 0.963 / 0.972 | risk ratios 0.544 / 0.586 / 0.561 / 0.655 / 0.771; code-mean ratios 0.981 / 0.974 / 0.962 / 0.959 / 0.967; sex-standardized 0.983 / 0.977 / 0.966 / 0.963 / 0.972 |
| Time-specific incidence pooled over visits, perpetration (52/2717 vs 68/2302) | Table 3, row 3-54 | 0.990 | risk ratio 0.648; code-mean ratio 0.990 |
| Time-specific incidence pooled over visits, experience (72/2680 vs 82/2287) | Table 3, row 3-54 | 0.992 | risk ratio 0.749; code-mean ratio 0.991 |
| Width of reported CIs | Table 3 | SE(log) 0.0099–0.0186 | matches the unadjusted SE of the code-mean ratio (ratio 0.96–0.99 at all 10 points); the unadjusted SE of the log risk ratio is 8 to 40 times larger |
| Boys vs girls, perpetration 3 mo (26/495 vs 3/557) | Table 4 | 0.956 | boys/girls risk ratio 9.75; girls/boys code-mean ratio 0.955 |
| Boys vs girls, perpetration 54 mo (95/495 vs 25/557) | Table 4 | 0.878 | boys/girls risk ratio 4.28; girls/boys code-mean ratio 0.877 |
| Boys vs girls, experience 12 mo (72/494 vs 5/556) | Table 4 | 0.882 | boys/girls risk ratio 16.21; girls/boys code-mean ratio 0.881 |
| The 12 Table 4 "Boys vs Girls" values that have counts beside them | Table 4 | 0.875–0.994 | girls/boys code-mean ratio within 0.0015 of each reported value; boys/girls risk ratios 2.80–18.01. The two pooled 3–54 month values in this column (0.968, 0.965) have no counts beside them and are also below 1 |
| Size of effect | Discussion, Limitations | "about a 3% reduction in risk" | mean of (1 − reported perpetration RR) = 3.4%; relative reductions from the counts 61%, 57%, 56%, 36%, 33% (perpetration) and 46%, 41%, 44%, 34%, 23% (experience) |
| Significance | Table 3 | P = .02, .004, .002, .04, .03 (perpetration) | unadjusted two-proportion tests P = 0.015, 0.002, 0.001, 0.022, 0.020; the reported P values are somewhat larger, as clustering would make them |
Across the 24 reported ratios with counts beside them (Table 3 cumulative and pooled rows, Table 4 sex comparison), the crude ratio of 1/2-code means differs from the reported value by at most 0.0047 (RMS 0.0024). The small remaining gap in Table 3 is in the direction sex adjustment predicts: the intervention arm has more girls, so the crude comparison slightly favors it. The approximate sex standardization closes the gap at all 10 cumulative time points (largest difference 0.0004).
Figure
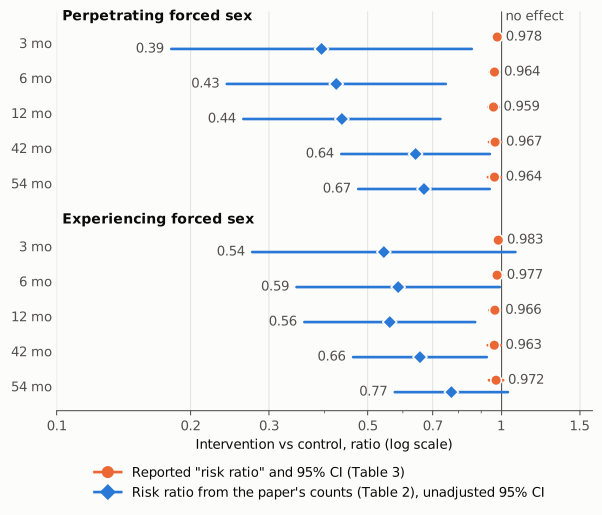
Figure 1. Intervention vs control on one log-scale axis, with the line at 1 marking no effect. Orange circles: the "risk ratios" and 95% CIs reported in Table 3 (and, for perpetration, in the Abstract and Results). The reported CIs are so narrow that they barely extend past the markers. Blue diamonds: the risk ratio p₁/p₀ computed from the cumulative-incidence counts printed beside them (Table 2 and Abstract), with an unadjusted 95% CI that ignores clustering, so the true intervals would be somewhat wider. The reported values sit at 0.96–0.98 at every time point. The counts give 0.39–0.67 for perpetration and 0.54–0.77 for experience. The direction agrees, but on the relative-reduction scale the size of the effect differs by a factor of 9 to 28 for perpetration (8 to 27 for experience).
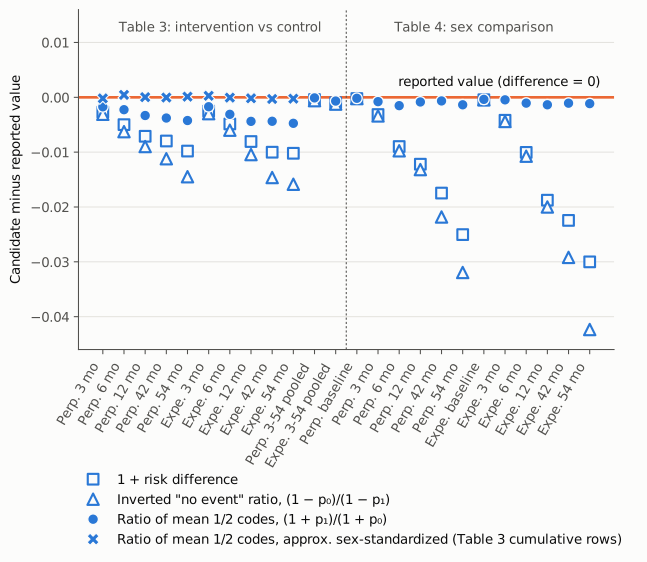
Figure 2. For each of the 24 reported ratios that have counts beside them, the difference between a candidate quantity computed from those counts and the reported value. The orange line at 0 is the reported value. Filled blue circles: ratio of mean 1/2 codes, (1 + p₁)/(1 + p₀) (for Table 4, girls over boys). Crosses: the same ratio after approximate sex standardization (Table 3 cumulative rows only, because the model was adjusted for sex). Hollow triangles: inverted "no event" ratio. Hollow squares: 1 + risk difference. The risk ratio and the odds ratio are off this scale (in the Table 3 cumulative rows the risk ratio is 0.20–0.58 below the reported values and the odds ratio 0.23–0.59 below). The two alternatives agree with the reported values only when events are rare, and they drift away as prevalence rises. The ratio of 1/2-code means stays within 0.005 everywhere, and within 0.0004 once sex is accounted for.
Why it matters
- The headline effect size. The Abstract and Results report perpetration "risk ratios" of 0.96–0.98, and the Limitations section turns these into "about a 3% reduction in risk". Read as risk ratios, these values say the intervention barely changed risk. The counts printed in the same sentence (9 of 561 vs 20 of 491 at 3 months) show the risk was cut by more than half at 3–12 months and by about a third at 42–54 months. The paper therefore understates its own finding. A reader who takes the numbers at face value, such as a meta-analyst pooling RRs or a program planner weighing cost against effect, would be misled by a factor of 9 to 28 on the relative-reduction scale (relative reduction from the counts divided by 1 − reported RR, at the five perpetration time points; 8 to 27 at the five experience time points).
- Precision. The reported intervals (for example 0.959–0.997) are intervals for the code-mean ratio. On the risk-ratio scale, the unadjusted intervals from the same counts are 0.18–0.86 at 3 months and 0.48–0.94 at 54 months. A meta-analysis would weight these estimates by the reported precision and would greatly overweight them.
- Table 4 and the sex comparisons. The column is labeled "Boys vs Girls, RR", but every value is below 1 although after baseline boys report forced sex 3 to 18 times as often as girls. The values match the girls/boys code-mean ratio. The Results text's qualitative statement that boys report more is correct, but the tabulated ratios point the other way. The intervention × sex interaction ratios (1.05–1.08 in the cumulative rows, 1.02 in the pooled 3–54 month rows) and the boys-only effects quoted in the Results (0.92–0.96) come from the same models. Their magnitudes cannot be read as multiplicative effects on risk, and the boys-only effects understate the effect for the same reason. The arm-by-sex counts needed to recompute them are not published.
- What still holds. For a 1/2-coded variable, a test of equal means is a test of equal proportions, so the coding does not invalidate the hypothesis tests. The unadjusted two-proportion P values from the counts are of the same order as the reported ones and slightly smaller, as expected before allowing for clustering. The Key Points, which give raw percentages (9% vs 14% at 54 months), are correct. The qualitative conclusions (the intervention reduced reported perpetration, and boys report more forced sex) are supported by the counts. What needs correcting is every effect estimate and CI, and the statement about the size of the effect.
Explanations considered
- The values are sex- and cluster-adjusted GEE estimates, so they need not equal crude ratios. This explains the 0.002–0.005 difference between the crude code-mean ratio and the reported values, and approximate sex standardization removes it. It cannot explain the gap to the risk ratio. Even in the extreme case where all events fell within one sex, the within-sex perpetration risk ratio at 3 months would be 0.37–0.42 (and 0.63–0.72 at 54 months), far from 0.978. Clustering mainly changes the standard errors. A working correlation structure could shift a point estimate somewhat, but the sex-standardized code-mean ratio already reproduces the reported values to three decimals, so there is no remaining gap for clustering to explain.
- The ratio is of "no event" probabilities, or inverted. This does not fit. (1 − p₀)/(1 − p₁) matches when events are rare but differs by up to 0.016 in Table 3 and 0.042 in Table 4 (Figure 2). It also would not be a risk ratio for the event the paper describes.
- The values are 1 + risk difference, and "3%" is an absolute reduction. This does not fit the tables. It deviates by up to 0.010 in Table 3 and 0.030 in Table 4 (Figure 2), and the paper labels the values as risk ratios from Poisson models. The perpetration absolute differences are 2.5–4.8 percentage points, so "3%" as an absolute difference would also be inaccurate at most time points, and the sentence says "reduction in risk".
- The values are odds ratios. No. The odds ratios from the counts are 0.38–0.74.
- A transcription or typesetting slip. No. The same pattern holds for all 24 printed ratios that have counts beside them, in the Abstract, Results, Table 3 and Table 4, and the CI widths match the code-mean scale. The PMC and Europe PMC copies of the publisher's JATS carry the same numbers.
- The ratio of 1/2-code means is the target quantity and only the label "risk ratio" is loose. Even read this way, the "about a 3% reduction in risk" statement and the "Boys vs Girls, RR" column describe risk, and the ratio of 1/2-code means is not a measure of risk. The Methods state that the 1/2 coding was used and that risk ratios are reported. The numbers show that these two statements describe different quantities.
- Table 4 orientation. Apart from the coding, the Table 4 values match girls/boys, not boys/girls as labeled. The direction of comparison in that column is therefore also mislabeled.
Status
- Version of record. The jamanetwork.com page could not be read: on 2026-10-23 the doi.org redirect target and the full-text page returned a bot-verification page (HTTP 403), as they had in an earlier check. The quoted passages and the reported values in Tables 2–4 were confirmed in the PMC-archived JATS, the live PMC page and the Europe PMC full-text XML (both retrieved 2026-10-23), which are identical at the quoted places. In the Europe PMC XML each Table 3 value sits in its own cell, so the columns are not misaligned. This is not a conversion artifact.
- Supplements. The only supplement is the trial protocol (jamanetwopen-1-e181213-s001.pdf). It contains no data or analysis output and does not bear on the computation.
- Corrections and comments. As of 2026-10-23, the only correction is "Error in Byline Order" (doi:10.1001/jamanetworkopen.2018.4304, PMC6324432; dated 2018-10-05 in Europe PMC, 2018-10-12 in Crossref). It changes only the author order. Crossref lists no update relations for the article DOI. Europe PMC (PMID 30646113) lists only that erratum and the invited commentary (doi:10.1001/jamanetworkopen.2018.1222). PubPeer could not be checked directly: its site and API returned Cloudflare blocks (HTTP 403) on 2026-10-23 and in an earlier check. Reader comments on the publisher page could not be checked, because that page could not be read. A general web search for the article title with "correction", "comment" and "letter" found the article, its university press releases, repository copies and the byline-order correction, and no letter, comment or blog post on the effect estimates.
- Sources. Paper as archived in PMC (PMC6324287; Tables 1–4, Methods, Results, Discussion); the live PMC page and the Europe PMC full-text XML (2026-10-23); Crossref and Europe PMC records; a general web search (2026-10-23). The publisher's page and PubPeer were attempted but could not be read. Calculations:
recompute.py.txtin this folder.
Suggested correction
- Refit the GEE models with the outcomes coded 0/1, for example as a log-link Poisson or log-binomial model with robust standard errors, adjusted for sex and clustering as described. Replace every risk ratio and 95% CI in the Abstract, the Results text (including the boys-only estimates) and Table 3, including the pooled 3–54 month rows.
- Recompute Table 4 on the 0/1 scale, state the direction of the comparison (boys vs girls) so that it matches the values, and re-estimate the intervention × sex interaction ratios.
- Revise "The magnitude of the intervention effects in this trial was modest, about a 3% reduction in risk" to reflect the corrected estimates. The crude risk ratios from the published counts suggest relative reductions of roughly a third to more than a half for perpetration.