← Back to the plain-language case
Significance statement says tracer chromosome goes "exclusively" with X; Results report 28 of 42 cells
Proc Natl Acad Sci U S A (2018) · doi:10.1073/pnas.1809583115 · PMC6310853
Summary
The paper's Significance statement says that male Ts65Dn translocation mice carrying a maternally derived supernumerary chromosome place this "tracer" chromosome "exclusively" in the haploid set that contains the X chromosome. The only experiment behind that sentence is in Results (Fig. 4 H–L). It reports the tracer in the X-containing hemisphere in "the majority of cases": n = 28/42 cells, P = 0.022. That is 66.7% (exact 95% CI 50.5% to 80.4%), with 14 of 42 cells (33.3%) not counted on the X side. The reported P reproduces as a one-sided binomial test against 0.5 (0.0218; two-sided 0.0436). The paper's own Fig. 4L also shows some tracer markers below the chromosome 16 midpoint, which the legend defines as the Y-containing hemisphere. The Significance statement thus describes as all-or-none a modest majority that only just reaches significance, in the experiment that the Results present as the direct test of the parental-origin model. The paper's main finding, that homologs are kept apart in mitosis, rests on other experiments and is not affected.
What the paper reports
Male translocation mice with a maternal-derived supernumerary chromosome display the tracer chromosome exclusively to the haploid set containing the X chromosome.
— Abstract, Significance statement
Using 3D chromosome imaging of a translocation mouse with a supernumerary chromosome, we found that this maternally derived chromosome is positioned by parental origin. These data, taken together, support the identity of haploid sets by parental origin.
— Abstract (main)
In the majority of cases we examined, the hemisphere containing the translocated chromosome 1716 also contained the maternally derived X chromosome (n = 28/42 cells, P = 0.022; Fig. 4 H–L and Movie S7).
— Results › In Vitro and in Vivo Segregation of Mouse Chromosomes, paragraph 2 (the plain-text archive renders 1716 as "1716")
To identify which X-, or Y-containing haploid set was most likely associated with the translocation chromosome, we first determined the approximate boundary between the haploid sets by finding the midpoint of the pair of homologous chromosome 16. We then mapped the position of the translocated chromosome (Fig. 4L).
— Same paragraph, immediately before
A maternally derived supernumerary chromosome segregates with the X chromosome.
— Fig. 4 legend, title sentence
The X- or Y-containing hemisphere domains are defined as being above/below the plus sign (+), respectively.
— Fig. 4 legend, panel L (n = 42)
Movie S7. The translocated chromosome in the Ts65Dn MEFs was consistently detected in the same hemisphere as the maternal-derived X chromosome.
— SI Appendix, movie legends (the Results cite Movie S7 alongside n = 28/42)
Center of mass calculations were used for hemisphere localization; however, chromosomes that were positioned with the majority of their staining along the boundary of the hemispheres, due to the limits of resolution, were scored to support the null hypothesis, which goes against our model, in the calculation of the one-tailed P value which gives rise to an underestimation of statistical significance.
— Materials and Methods › Statistical Analysis
Although our data support the paradigm (13, 14, 47) that haploid sets are derived by parental origin, there are limitations to our analysis.
— Discussion, paragraph 3
The same paragraph adds that in the reciprocal (paternal) cross the tracer "localized to the boundary between two nuclear hemispheres, making it difficult to determine its association to either X- or Y-containing hemispheres (SI Appendix, Fig. S5 C–I)."
What the paper's own numbers show
Method. The Methods state that hemisphere assignments were tested with a binomial distribution against p = 0.5, using a one-tailed P value. I recomputed every count that the paper reports with a P value, as one-sided P(X ≥ x | n, 0.5), as two-sided exact P, and as the single-term binomial probability b(x; n, 0.5) that the Methods formula writes out. For the tracer result I computed the exact (Clopper–Pearson) 95% CI for the proportion. As a separate, approximate check, I read the positions of the tracer circles and the chromosome 16 midpoint markers ("+") off the published Fig. 4 image (757 × 449 px) by pixel colour. Each circle was classed as above, within ±3 axis units of, or below its local midpoint. All numbers below are printed by recompute.py.txt.
| Quantity | Location | Reported | Recomputed |
|---|---|---|---|
| Tracer 1716 in the maternal-X hemisphere | Significance statement | "exclusively", i.e. 42/42 (100%) | — |
| Same result | Results, mouse section para 2; Fig. 4 H–L | n = 28/42 cells, P = 0.022, "the majority of cases" | 66.7%; exact 95% CI 50.5% to 80.4% (excludes 100%); one-sided P = 0.0218, two-sided P = 0.0436 |
| Cells not counted in the X hemisphere | Same | — | 14/42 (33.3%) |
| Margin over the significance threshold | Same | — | smallest count out of 42 with one-sided P < 0.05 is 27; the reported 28 is one cell above it |
| Compatibility with a near-exclusive effect | Same | — | if the true share were 90%, P(≤ 28 of 42) = 3.5 × 10⁻⁵; if 95%, 8.5 × 10⁻⁹ |
| Tracer circles vs midpoint, read from the image (approximate) | Fig. 4L (n = 42) | no count given in the legend | 41 of 42 circles resolved: 35 above (X side), 2 within ±3 units, 4 below (Y side), all 4 among the nuclei at the right of the plot |
| XY one per hemisphere, WT male MEFs | Results, mouse section para 1; Fig. 4 E, F | 28/42, P = 0.022 | one-sided P = 0.0218 (match) |
| Chr 16 homologs in separate hemispheres, Ts65Dn MEFs | Results, mouse section para 2; SI Fig. S5 A, B | 28/42, P = 0.022 | one-sided P = 0.0218 (match) |
| Chr 17 homologs, WT MEF anaphase | Results, mouse section para 1 | 28/36, P = 0.001 | one-sided 0.0006 (match) |
| Chr 4, HUVEC metaphase / anaphase | Results, Homologous and XY section para 1 | 15/20, P = 0.021; 28/38, P = 0.003 | 0.0207; 0.0025 (match) |
| XX, female HUVEC metaphase / anaphase | Same section, para 2 | 18/24, P = 0.011; 32/42, P = 0.001 | 0.0113; 0.0005 (match) |
| XY, male HUVEC metaphase | Same section, para 2 | 19/28, P = 0.044 | 0.0436 (match) |
| XY, male HUVEC anaphase (side finding) | Same section, para 2; Fig. 2 D–F | 20/28, P = 0.001 | one-sided 0.0178, two-sided 0.0357, b(x) 0.0116; none gives 0.001 (that would need about 23/28) |
Two things follow. First, every reported P except one reproduces as a one-sided binomial tail probability, so the 28/42 count is the paper's own figure for this result, not a typo. Second, a count of 28/42 is a majority, not an exclusive pattern, and the CI rules out anything near 100%.
The image read-out is resolution-limited and is not meant as a recount. It suggests more circles above the midpoint than the 28 counted in the text. One possible reason is the Methods' rule that boundary chromosomes were scored against the model. I do not treat this difference as a second error. The read-out matters here only because it shows tracer markers on the Y side of the boundary in the paper's own figure.
Figure
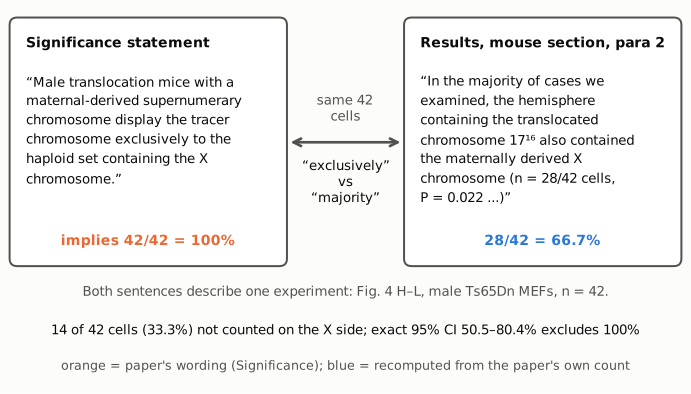
Figure 1. The same experiment described in two places. Left: the Significance statement, whose word "exclusively" implies the tracer is in the X-containing set in all cells (orange, the paper's wording). Right: the Results sentence that reports the experiment, n = 28/42 cells, which is 66.7% (blue, recomputed from the paper's own count). The connector marks that both sentences describe the same 42 cells. Below: the 14 cells not counted on the X side, and the exact 95% CI, which excludes 100%.
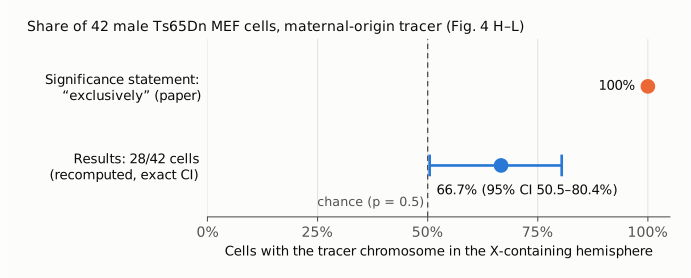
Figure 2. Share of the 42 male Ts65Dn MEF cells with the maternal-origin tracer chromosome in the X-containing hemisphere, on one 0–100% axis. Orange: the share implied by "exclusively" in the Significance statement (100%). Blue: the share reported in Results, 28/42 = 66.7%, with its exact 95% CI (50.5% to 80.4%), computed in recompute.py.txt. The dashed line marks the chance value of 50% used as the null in the paper's binomial test. The lower CI limit lies just above that line, and the upper limit lies well below 100%.
Why it matters
- It is the summary sentence for the paper's only direct test of parental origin. The Results open this experiment with "To directly test whether each haploid set is derived by parental origin". The main abstract then draws the conclusion that the data "support the identity of haploid sets by parental origin". The Significance statement is the version most readers see, and it gives an all-or-none result.
- The size of the effect is overstated. The data show a tracer on the X side in two of three cells. The evidence against chance is modest: one-sided P = 0.022, two-sided P = 0.044, and one cell fewer on the X side (27/42, P = 0.044) would still be significant, but 26/42 (P = 0.082) would not. The CI lower limit (50.5%) sits just above the null.
- The figure title and the movie legend repeat the categorical form. The Fig. 4 legend title ("segregates with the X chromosome") gives no qualifier, and the SI legend for Movie S7 says "consistently detected in the same hemisphere as the maternal-derived X chromosome". Meanwhile the panel the Fig. 4 title describes (Fig. 4L) shows tracer markers below the midpoint.
- The supporting evidence is otherwise limited. The authors' Discussion notes that the reciprocal paternal cross could not assign the tracer to either hemisphere. The Results qualify the interpretation ("If the 1716 chromosome behaves similarly to other wild-type autosomes"). Neither qualification reaches the Significance statement.
- Repeated count. The identical "n = 28/42 cells, P = 0.022" is given for three different measurements in the mouse section: XY separation in WT MEFs, chromosome 16 homolog separation in Ts65Dn MEFs, and tracer-with-X co-localization. The n = 42 given for the XY and tracer measurements matches the Fig. 4 legend, and identical counts can occur by chance. The per-cell data are not in the paper or the SI Appendix, so the three counts cannot be checked independently.
- What does not change. The direction of the tracer result (more often with the X than chance), the antipairing of homologs, and the haploid-set separation in human and mouse cells all rest on the other counts above, which reproduce. One exception: the XY HUVEC anaphase P (reported 0.001, recomputed 0.018 one-sided) is misreported but is still below 0.05.
Explanations considered
- "Exclusively" means the tracer is in one set rather than split across both. The sentence names the set ("the haploid set containing the X chromosome"), so it is a claim about which set, and the Results give that as 28/42.
- Loose wording in a lay summary. The main abstract avoids the word, saying only that the chromosome "is positioned by parental origin". But the Significance statement is part of the published abstract, and the word has a clear meaning that the reported count does not support. Whatever the reason for the wording, it does not change what the numbers show.
- The 14 remaining cells may include boundary cells rather than Y-side cells. The Methods say that boundary chromosomes were "scored to support the null hypothesis". So some of the 14 may be ambiguous rather than clearly on the Y side. This could explain why the image read-out shows more than 28 circles above the midpoint. It does not rescue "exclusively": the paper's own count is 28/42, and Fig. 4L, read by the legend's definition, has about 4 tracer markers below the midpoint, that is, on the Y side.
- A different population or experiment behind the Significance sentence. The Significance statement refers to "translocation mice with a maternal-derived supernumerary chromosome" (male). That is the Ts65Dn maternal × WT paternal cross in Fig. 4 G–L (n = 42). The in vivo embryo panels (Fig. 4 M–P) are painted for chromosomes 16 and 17 and report no tracer-with-X count. The Results cite Movie S7 for the same n = 28/42. No other tracer count appears in the paper.
- A conversion or typesetting artefact. The wording is the same in the publisher's XML archived in PMC, in Europe PMC's full text and on the live PMC page. The companion "PNAS Plus Significance Statements" record (PMC6310825) repeats the clause with "exclusively". The disputed numbers (28/42, 0.022) are plain text, with no superscripts or table cells involved. The only conversion artefact is the chromosome label 1716, which the plain-text archive renders as "1716".
- A typo in the count. The count 28/42 and its P value are mutually consistent (one-sided 0.0218), and the text describes it as "the majority of cases", so the body is internally coherent. The discrepancy lies between the body and the Significance statement.
None of these accounts for the gap between "exclusively" and 28 of 42 cells.
Status
As of 2026-10-23:
- Version of record. The publisher pages (pnas.org, reached through the DOI redirect, and the PDF and SI URLs) returned HTTP 403 to automated access. I therefore checked the publisher-deposited text: the JATS XML archived in PubMed Central (PMC6310853, read with
src/show.py), the Europe PMC full-text XML (title and DOI checked; 115(52):E12235–E12244, PMID 30530674) and the live PMC article page. Every quote from the article above was checked verbatim against the PMC-archived text, and all three sources carry the same wording and numbers. The companion "PNAS Plus Significance Statements" record (PMC6310825) was read on the live PMC page; its Europe PMC full text returned HTTP 500. - Supplements. The SI Appendix (pnas.1809583115.sapp.pdf, from the Europe PMC supplementary-files archive; its md5, 629446949a72863dfbeb0748dcfc62b9, matches the PMC listing) was read in full as text. It contains Figs. S1–S5 and legends for Movies S1–S7, but no per-cell table and no separate count for the tracer-with-X assignment. Fig. S5 A–B covers the maternal cross (n = 42) and Fig. S5 C–I the reciprocal paternal cross (n = 34). The Movie S7 legend is quoted above. The movies were not viewed; Movie S7 was not in the archive.
- Figure image. Fig. 4 was read from the published image file (link below) for the approximate Fig. 4L read-out. No part of it is reproduced here.
- Corrections and notices.
src/known.pyreturned no Crossref update relations and no PMC or Europe PMC notices. A Europe PMC search for the DOI returns only the article and the companion record. - PubPeer and the wider web. The PubPeer API and search page both returned HTTP 403, so PubPeer could not be queried directly. Web searches made earlier in this verification, for the title together with correction, erratum or PubPeer, and for PubPeer together with the DOI, found no correction and no PubPeer thread. They could not be repeated for this write-up because the session's web-search quota was used up. A PubPeer thread therefore cannot be fully ruled out.
- Sources. https://pmc.ncbi.nlm.nih.gov/articles/PMC6310853/ ; https://pmc.ncbi.nlm.nih.gov/articles/PMC6310825/ ; Europe PMC REST (search, full text and supplementary files for PMC6310853); https://api.crossref.org/works/10.1073/pnas.1809583115 ; published Fig. 4 image, https://cdn.ncbi.nlm.nih.gov/pmc/blobs/c3f5/6310853/c1c7e28b198f/pnas.1809583115fig04.jpg .
Suggested correction
In the Significance statement, replace "display the tracer chromosome exclusively to the haploid set containing the X chromosome" with wording that matches the Results, for example: "display the tracer chromosome more often in the haploid set containing the X chromosome (28 of 42 cells, 67%; one-sided binomial P = 0.022)". Correspondingly, the Fig. 4 legend title could read "A maternally derived supernumerary chromosome segregates preferentially with the X chromosome", and "consistently" in the Movie S7 legend could be replaced by "in most cells (28/42)". The authors may also wish to:
- state the boundary-scoring rule next to the 28/42 count, and give the numbers of cells on the X side, on the Y side and on the boundary in Fig. 4L;
- confirm the three separate "n = 28/42 cells, P = 0.022" counts in the mouse section against the source data; and
- correct the XY HUVEC anaphase P value (20/28 gives one-sided P = 0.018, not 0.001).