← Back to the plain-language case
Abstract reports type 2 diabetes odds ratios as evidence of higher case-fatality in type 1 diabetes
Circulation (2018) · doi:10.1161/CIRCULATIONAHA.118.034986 · PMC6287897
Summary
This national Scottish cohort study of 3.25 million people reports, in its Abstract, that 30-day case-fatality after an incident heart failure hospitalization "was higher in type 1 diabetes mellitus for men (odds ratio, 0.96; 95% CI, 0.95–0.96) and women (odds ratio, 0.98; 95% CI, 0.97–0.98)". Both odds ratios are below 1 and both intervals lie entirely below 1, so as printed they mean 4% and 2% lower odds of death, not higher. The same figures, digit for digit, are the Results' estimates for type 2 diabetes versus no diabetes. The Results give the type 1 estimates as OR 1.91 (95% CI 1.68–2.18) in men and OR 1.31 (1.05–1.65) in women, and the model coefficients in the online supplement reproduce both sets. The paper presents raised case-fatality in type 1 diabetes as a first-reported finding, so the Abstract's numbers misstate one of its main results: they point the wrong way and understate the type 1 odds ratio about 2.0-fold in men and 1.34-fold in women. The direction of the finding stated in the body of the paper, and the analysis itself, are not affected.
What the paper reports
Abstract, Results:
Thirty-day case-fatality was similar among people with type 2 diabetes mellitus and without diabetes mellitus, but was higher in type 1 diabetes mellitus for men (odds ratio, 0.96; 95% CI, 0.95–0.96) and women (odds ratio, 0.98; 95% CI, 0.97–0.98).
Abstract, Conclusions:
Despite falling incidence, particularly in type 1 diabetes mellitus, heart failure remains ≈2-fold higher than in people without diabetes mellitus, with higher case-fatality in those with type 1 diabetes mellitus.
Results, "Case-Fatality of Incident Heart Failure Hospitalization", paragraph 2 (the paragraph beginning "Thirty-day case-fatality results"; last sentence). Paragraph 1 of this section is a single sentence giving the overall 30-day case-fatality (14.2%).
However, it was similar in people with type 2 diabetes mellitus and in people without diabetes mellitus, for men the OR was 0.96 (95% CI, 0.95–0.96), and for women the OR was 0.98 (95% CI, 0.97–0.98).
Same section, paragraph 3 (beginning "However, case-fatality was higher"):
However, case-fatality was higher among people with type 1 diabetes mellitus compared with people without diabetes mellitus; the difference was larger for men (OR, 1.91; 95% CI, 1.68–2.18) than for women (OR, 1.31; 95% CI, 1.05–1.65).
Same section, paragraph 2 (first sentence), on where the model is given:
Thirty-day case-fatality results obtained from logistic regression models adjusting for age, sex, and deprivation are shown in Figure 3 (see the Appendix in the online-only Data Supplement for model coefficients, including interactions).
Discussion, paragraph 6 (beginning "Unlike incidence, for case-fatality"):
However, among people with type 1 diabetes mellitus, case-fatality was 1.3-fold higher in women and 1.9-fold higher in men.
Discussion, paragraph 7 (beginning "Women therefore have"):
In combination, this means that compared with women without diabetes mellitus, women with type 1 diabetes mellitus have around a 2.5-fold higher risk of having an incident heart failure admission which results in death within 30 days. For the equivalent comparison in men, there is almost a 4-fold difference in risk.
Discussion, paragraph 11 (beginning "Fewer studies have examined"):
Indeed, ours is the first population-based study of which we are aware to compare case-fatality after heart failure admissions in people with and without type 1 diabetes mellitus, and we are not aware that the high case-fatality in patients with type 1 diabetes mellitus has been reported previously.
Online-only Data Supplement (cir-138-2774-s001.pdf), Table S11, "Heart failure case-fatality model, coefficients and standard errors" (logistic regression; selected rows, estimate and standard error):
sex 0.041 (0.02); typet1dm 0.649 (0.104); typet2dm -0.046 (0.031); sex:typet1dm -0.375 (0.158); sex:typet2dm 0.021 (0.044)
What the paper's own numbers show
Method. I compared the Abstract's odds ratios with the two sets of odds ratios in the Results, string for string. For each odds ratio I computed the change in odds, (OR − 1) × 100, and noted which side of 1 its confidence interval lies on. I checked the internal consistency of the type 1 estimates (log-scale midpoint of the CI, implied standard error and z) and their agreement with the rounded figures in the Discussion. I then recomputed all four diabetes-versus-no-diabetes odds ratios from the supplement's Table S11 by exponentiating the coefficients: the main-effect diabetes terms give the estimates for men, and adding the sex-by-diabetes interaction gives the estimates for women (the sex term is positive and the paper says case-fatality "was higher in women than in men", so sex = 1 codes women). I also tested two other readings of the Abstract's numbers: the reciprocal of the printed ORs, and type 1 versus type 2. Every number below is printed by recompute.py.txt.
| Quantity | Location | Reported | Recomputed from the paper's numbers |
|---|---|---|---|
| OR, case-fatality, "type 1" vs none, men | Abstract, Results | 0.96 (95% CI 0.95–0.96), called "higher" | 4% lower odds (CI 5% to 4% lower); CI entirely below 1 |
| OR, "type 1" vs none, women | Abstract, Results | 0.98 (0.97–0.98), called "higher" | 2% lower odds (CI 3% to 2% lower); CI entirely below 1 |
| OR, type 2 vs none, men / women | Results, Case-Fatality ¶2 | 0.96 (0.95–0.96) / 0.98 (0.97–0.98) | identical to the Abstract figures (string comparison: True) |
| OR, type 1 vs none, men | Results, Case-Fatality ¶3 | 1.91 (1.68–2.18) | 91% higher odds (CI 68% to 118% higher); CI log-midpoint 1.914; z = 9.74 |
| OR, type 1 vs none, women | Results, Case-Fatality ¶3 | 1.31 (1.05–1.65) | 31% higher odds (CI 5% to 65% higher); CI log-midpoint 1.316; z = 2.34 |
| Rounded type 1 ORs | Discussion ¶6 | "1.3-fold" (women), "1.9-fold" (men) | 1.3 and 1.9: match the Results, Case-Fatality ¶3 values, not the Abstract |
| Type 1 vs none from model, men | Table S11 | typet1dm 0.649 | exp(0.649) = 1.914 |
| Type 1 vs none from model, women | Table S11 | 0.649 + (−0.375) | exp(0.274) = 1.315 (1.314–1.317 over coefficient rounding; Results 1.31) |
| Type 2 vs none from model, men | Table S11 | typet2dm −0.046 | exp(−0.046) = 0.955, rounds to 0.96 |
| Type 2 vs none from model, women | Table S11 | −0.046 + 0.021 | exp(−0.025) = 0.975, rounds to 0.98 |
| Size of the misstatement | derived | Abstract 0.96 / 0.98 | correct type 1 OR is 1.91/0.96 = 1.99× (men) and 1.31/0.98 = 1.34× (women) the printed value |
| Alternative reading: reciprocal | derived | 0.96 / 0.98 | 1/0.96 = 1.042, 1/0.98 = 1.020: not 1.91 or 1.31 |
| Alternative reading: type 1 vs type 2 | derived | 0.96 / 0.98 | 1.91/0.96 = 1.99, 1.31/0.98 = 1.34: not 0.96 or 0.98 |
| Women, incidence × case-fatality | Discussion ¶7 | "around a 2.5-fold higher risk" | 2 × 1.31 = 2.62 (consistent); with the Abstract value, 2 × 0.98 = 1.96 |
The Abstract's two odds ratios and four confidence limits are the type 2 estimates from Case-Fatality paragraph 2 of the Results. The type 1 estimates in Case-Fatality paragraph 3 are internally consistent, agree with the Discussion, and are reproduced from the supplement's model coefficients. Neither alternative reading turns the Abstract's numbers into a type 1 estimate.
Minor points found in the same checks (separate from the main issue).
- The OR per calendar year for case-fatality is 0.967 (95% CI 0.961–0.973) in the Abstract and 0.967 (0.961–0.974) in Results, Case-Fatality paragraph 4 (beginning "Trends in case-fatality"). Table S12 (year −0.033, SE 0.003) gives 0.9675 (0.9619–0.9732), so the Abstract limit is the one that matches. The 3.3% annual decline matches 1 − 0.967.
- The same paragraph labels both interaction terms "calendar year/type 2 interaction". The first, 1.011 (0.959–1.065), sits in the type 1 clause and matches Table S12's year:typet1dm term (exp(0.01) = 1.010, CI 0.958–1.065), so its label should read type 1.
- Wald intervals computed from the Table S11 standard errors are 1.56–2.35 for type 1 vs none in men (paper 1.68–2.18) and 0.90–1.01 for type 2 vs none in men (paper 0.95–0.96), and Table S11 gives z = −1.48, P = 0.138 for the type 2 term. The type 2 interval printed in the paper lies entirely below 1, although the text calls the groups "similar"; the supplement's P value fits the word "similar". The paper's intervals may have been derived another way, so this is noted, not counted as an error.
- The sensitivity-analysis crude rates reproduce: 34 893 / 38 080 361.9 py = 0.92, 11 551 / 1 885 715.8 py = 6.13 and 635 / 237 683.5 py = 2.67 per 1000 py (printed 0.9, 6.1, 2.7).
Figure
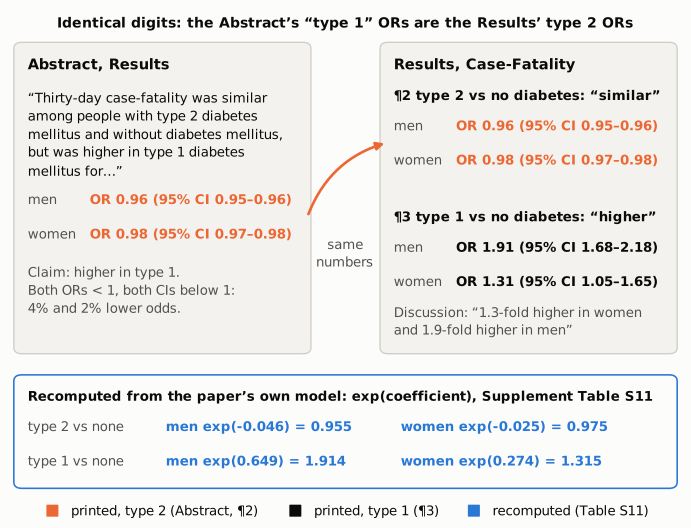
Figure 1. Left: the Abstract's sentence on case-fatality, with the two odds ratios it gives for type 1 diabetes. Right: the two paragraphs of the Results (Case-Fatality section) that give the diabetes-versus-no-diabetes odds ratios, paragraph 2 for type 2 diabetes and paragraph 3 for type 1 diabetes. The values printed in the Abstract (orange) are identical, to every digit, to the type 2 values in paragraph 2, which the paper calls "similar" to no diabetes. The type 1 values printed in paragraph 3 (black: 1.91 and 1.31) do not appear in the Abstract. Bottom (blue): the same four odds ratios recomputed by exponentiating the case-fatality model coefficients in Supplement Table S11, which assign 0.955 and 0.975 to type 2 and 1.914 and 1.315 to type 1.
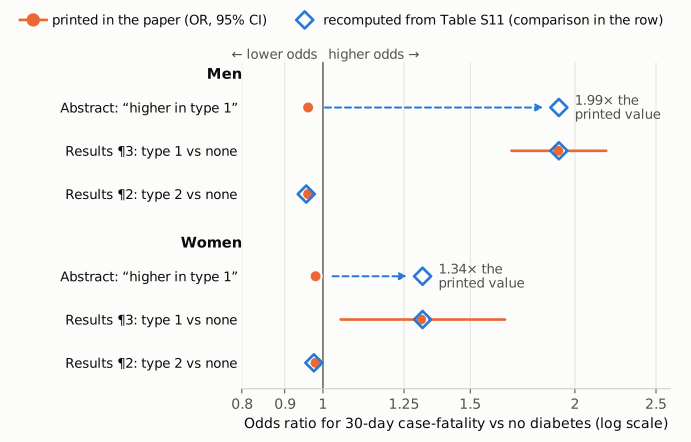
Figure 2. Odds ratios for 30-day case-fatality versus no diabetes on a log scale, with OR = 1 as the reference line. Orange dots and lines are the odds ratios and 95% confidence intervals printed in the paper: the Abstract's values for "higher in type 1" and the Results values for type 2 (Case-Fatality paragraph 2) and type 1 (paragraph 3). Blue diamonds are the odds ratio for the comparison each row names, recomputed from Table S11 coefficients (point estimates only; Table S11 gives no covariance for the women's sums). For the Results rows the printed and recomputed values coincide. For the Abstract rows the printed value lies left of 1 while the type 1 value the sentence describes lies at 1.914 in men and 1.315 in women; the dashed arrows mark the gap.
Why it matters
Raised case-fatality in type 1 diabetes is the paper's one new case-fatality result: the Discussion describes the study as the first population-based comparison of case-fatality after heart failure admission in people with and without type 1 diabetes, and the Abstract's Conclusions rest on it ("with higher case-fatality in those with type 1 diabetes mellitus"). Readers who see only the Abstract, for example in PubMed, have no other source for the effect size. A reader who takes the Abstract's numbers at face value would conclude that the odds of death within 30 days are 4% (men) and 2% (women) lower in type 1 diabetes, with intervals that exclude 1, which contradicts the word "higher" in the same sentence. A reader who notices the contradiction cannot recover the correct effect size from the Abstract. The correct estimates (91% and 31% higher odds) are about 2.0 and 1.34 times the printed odds ratios.
The error does not reach the analysis or the direction of the paper's conclusions. The Abstract's wording, the Results, the Discussion (1.9-fold and 1.3-fold), and the combined-risk statements (about 2.5-fold in women, using 1.31; almost 4-fold in men) all state or use the correct type 1 values, and the full-text Conclusion states the correct direction ("case-fatality also being higher in people with type 1 diabetes mellitus") without giving values. Figure 3 and Table 2, which show predicted and stratified case-fatality, do not carry the wrong odds ratios. The incidence results are not involved.
Explanations considered
- The Abstract's numbers are type 1 estimates of a different contrast. This does not account for the numbers. The reciprocals of the printed ORs are 1.042 and 1.020, and type 1 versus type 2 gives 1.99 and 1.34. Neither reading produces 0.96 and 0.98, and the printed intervals, 0.95–0.96 and 0.97–0.98, are identical to the ones the Results print for type 2. (They are narrower than even the type 2 term in Table S11 supports; see the note on Wald intervals above.)
- Rounding or a typographical slip in one digit. This does not account for the numbers. All six figures (two odds ratios, four confidence limits) match the type 2 estimates exactly, and they differ from the type 1 estimates in every digit and in direction.
- The Abstract describes a different model from the Results. This does not account for the numbers. The Abstract says all estimates are adjusted for age, sex, socioeconomic status and calendar year, but the type 2 figures it carries are the ones the Results give from the cross-sectional case-fatality model, and Table S11 reproduces them. The calendar-year model (Table S12) has no sex-by-diabetes interaction, so it cannot yield a pair of sex-specific estimates; its diabetes terms give exp(0.47) = 1.60 for type 1 and exp(−0.017) = 0.983 for type 2, so in that model too the type 1 odds ratio is above 1.
- A conversion or typesetting error in the archived text. This is excluded. The publisher-supplied JATS XML in Europe PMC, the PubMed abstract (PMID 29950404) and the university repository copy labelled "Published Version" all carry the same Abstract sentence with 0.96 (0.95–0.96) and 0.98 (0.97–0.98). The numbers involve no minus signs, superscripts or table cells that conversion could alter.
- The supplement explains the Abstract's figures. This is excluded. The supplement's case-fatality model (Table S11) assigns these values to type 2 diabetes and gives type 1 odds ratios of 1.914 (men) and 1.315 (women; 1.31 within coefficient rounding), as in the Results.
- Most likely account. The Abstract appears to have taken the odds ratios from the type 2 sentence of the Results and attached them to the type 1 clause. The source of the transposition cannot be determined from the published material.
Status
- Version of record. The publisher pages (ahajournals.org, reached from doi.org) returned HTTP 403 to automated requests for both HTML and PDF, and the PMC page returned a reCAPTCHA. The publisher text was therefore confirmed through three independent copies: the publisher-supplied JATS XML in Europe PMC (PMC6287897/fullTextXML), the PubMed abstract (PMID 29950404, via E-utilities efetch) and the University of Glasgow repository record (eprints.gla.ac.uk/163955), whose file is labelled "Published Version". All three carry the Abstract sentence quoted above with the same values. Every quotation from the article above was confirmed verbatim against the PMC-archived text with
src/show.py; paragraph numbers count every paragraph of the section from 1, including the one-sentence opening paragraph of the Case-Fatality section. The Table S11 and S12 values (a condensed list of selected rows, not a verbatim excerpt) were checked against the supplement PDF, cir-138-2774-s001.pdf, pages 13–14. - Supplements. The online-only Data Supplement (cir-138-2774-s001.pdf, 22 pages), obtained from the Europe PMC supplementary-files archive for PMC6287897, was read. Table S11 (case-fatality model) and Table S12 (case-fatality over time) are quoted and used above. They confirm that 0.96 and 0.98 are type 2 estimates and 1.91 and 1.31 are type 1 estimates.
- Corrections and comments. As of 2026-10-24 I found no correction, erratum, expression of concern or retraction. Crossref lists no update relations for the DOI; PMC and Europe PMC list no correction notices or comment links (Europe PMC
commentCorrectionListis empty). A web search for corrections, errata or comments on the article found none. The PubPeer API refused automated access (human-verification challenge), so PubPeer could not be checked directly. - Sources. PMC article PMC6287897; Europe PMC full-text XML and supplementary files for PMC6287897; PubMed record 29950404; University of Glasgow repository record 163955; Crossref metadata for doi:10.1161/CIRCULATIONAHA.118.034986.
Suggested correction
- In the Abstract, Results, replace the odds ratios in the case-fatality sentence with the type 1 versus no-diabetes estimates from the Results: "…but was higher in type 1 diabetes mellitus for men (odds ratio, 1.91; 95% CI, 1.68–2.18) and women (odds ratio, 1.31; 95% CI, 1.05–1.65)." If the type 2 estimates are wanted in the Abstract, attach them to the type 2 clause.
- In Results, Case-Fatality paragraph 4 (beginning "Trends in case-fatality"), relabel the first interaction term (1.011; 95% CI, 0.959–1.065) as the calendar year/type 1 interaction.
- Reconcile the upper confidence limit of the OR per calendar year (0.973 in the Abstract, 0.974 in the Results); Table S12 supports 0.973.
- Optional: state how the confidence intervals for the case-fatality odds ratios were obtained, since Wald intervals from the Table S11 standard errors are wider (for example 1.56–2.35 for type 1 in men, and 0.90–1.01 for type 2 in men).