← Back to the plain-language case
Abstract cites non-significant interaction odds ratios as evidence that correct fluid significantly reduced mortality
Lancet Child Adolesc Health (2018) · doi:10.1016/S2352-4642(18)30130-5 · PMC6004535
Summary
The abstract states that correct fluid prescription "significantly reduced the risk of early mortality (within 2 days) in all subgroups". It supports this with five adjusted odds ratios (AORs): 1·23, 0·95, 1·70, 1·50 and 0·86. These five values, with their CIs, are the "Multiplicative interaction" column of Table 2, which the table footnote defines as OR11/(OR10 × OR01), and they can be recomputed from the table's other cells. They measure how much the fluid association differs between children with and without a clinical sign. They are not the effect of correct fluid in either group. All five 95% CIs include 1 (approximate p = 0.50, 0.87, 0.07, 0.22, 0.58), and three of the five point estimates are above 1. So the statistics the abstract cites do not show a significant reduction in any subgroup. The same table, read for the correct-versus-wrong contrast within each stratum, does point to lower odds of early death with correct fluid in every subgroup. The headline direction may therefore hold, but the estimates, their label and the significance claim in the abstract's key fluid result are wrong as printed. Table 2 also contains two cell errors in its additive-interaction column.
What the paper reports
Abstract, Findings:
Correct fluid prescription significantly reduced the risk of early mortality (within 2 days) in all subgroups: abnormal respiratory signs (AOR 1·23, 0·68–2·24), abnormal circulatory signs (0·95, 0·53–1·73), pallor (1·70, 0·95–3·02), dehydration signs only (1·50, 0·79–2·88), and abnormal neurological signs (0·86, 0·51–1·48).
Abstract, Interpretation:
the prescription of recommended rehydration guidelines reduces risk of death
Research in context, Added value of this study:
Our findings also show that comorbidities are common and that correct fluid prescription is associated with reduced risk of death in these patients.
Methods, Data analysis (third paragraph, on effect modification):
We calculated the relative excess odds due to interaction, the attributable proportion, and the multiplicative interaction odds ratio (OR).
Results (effect-modification paragraph), where the same numbers appear under their correct name:
In fact, positive multiplicative interactions (OR>1) for association of incorrect fluid management with death in children with dehydration signs (OR 1·50, 95% CI 0·79–2·88), respiratory signs (OR 1·23, 0·68–2·24), and pallor (OR 1·70, 0·95–3·02) are evidence of interaction (figure 3).
Table 2, "Interactions of fluid management with risk factors for in-hospital early deaths" (columns: Multiplicative interaction | Fluid wrong and symptom present (OR10) | Fluid right and symptom present (OR11) | Fluid right and symptom absent (OR01) | RERI | Attributable proportion):
Pallor | 1·70 (0·95 to 3·02) | 2·16 (1·66 to 2·82) | 1·07 (0·69 to 1·67) | 0·29 (0·21 to 0·41) | -0·38 (-1·07 to 0·31) | -0·35 (-1·09 to 0·38)
Circulatory | 0·95 (0·53 to 1·73) | 1·92 (1·47 to 2·51) | 0·64 (0·40 to 1·03) | 0·35 (0·25 to 0·50) | -0·63 (-1·19 to -0·06) | -0·98 (-2·06 to 0·11)
Dehydration signs only | 1·50 (0·79 to 2·88) | 0·96 (0·70 to 1·33) | 0·38 (0·26 to 0·55) | 0·26 (0·15 to 0·45) | 0·25 (-0·18 to 0·48) | 0·40 (-0·53 to 1·33)
Neurological | 0·86 (0·51 to 1·48) | 3·57 (2·75 to 4·64) | 1·15 (0·77 to 1·72) | 0·37 (0·25 to 0·54) | -1·80 (-2·71 to -0·88) | -1·56 (-2·61 to -0·52)
Respiratory | 1·23 (0·68 to 2·24) | 3·18 (2·35 to 4·31) | 1·17 (0·80 to 1·73) | 0·30 (0·18 to 0·49) | -1·31 (-2·16 to -9·45) | -1·11 (-1·90 to -0·33)
Table 2 footnote (excerpts):
Interaction exists if RERI is not zero (RERI=OR11 – OR10 – OR01 + 1).
Multiplicative interaction=OR11/(OR10 × OR01).
The reference group was fluid wrong and symptom absent (OR00)=1·00.
Discussion, final paragraph:
Importantly, prescription of recommended rehydration guidelines reduces risk of death in this group of children.
What the paper's own numbers show
Method. I compared the five abstract values with each column of Table 2. Using the footnote formulas, I recomputed the multiplicative interaction OR, the RERI and the attributable proportion (AP) from the three cell ORs in each row (OR10, OR11, OR01; OR00 = 1). For each printed 95% CI, I took the standard error of log(OR) as (ln upper − ln lower)/(2 × 1.96) and derived an approximate two-sided Wald p value. Within the "symptom present" stratum, the effect of correct versus wrong fluid is OR11/OR10, because both cells share the reference OR00. Within the "symptom absent" stratum it is OR01. The paper does not report a CI for OR11/OR10. I approximated one by adding the two variances on the log scale and ignoring their covariance. Both estimates are contrasts against the same reference group, so their covariance is usually positive, and in that case the approximate interval is wider than the true one. Every number below is printed by recompute.py.txt.
| Quantity | Location | Reported | Recomputed from the paper's numbers |
|---|---|---|---|
| Respiratory "AOR" for correct fluid | Abstract; Table 2, multiplicative interaction | 1·23 (0·68–2·24) | Identical to Table 2 interaction OR; OR11/(OR10·OR01) = 1.17/(3.18 × 0.30) = 1.23; CI includes 1; p ≈ 0.50 |
| Circulatory "AOR" | Abstract; Table 2 | 0·95 (0·53–1·73) | Identical to interaction OR; 0.64/(1.92 × 0.35) = 0.95; CI includes 1; p ≈ 0.87 |
| Pallor "AOR" | Abstract; Table 2 | 1·70 (0·95–3·02) | Identical to interaction OR; 1.07/(2.16 × 0.29) = 1.71; CI includes 1; p ≈ 0.07 |
| Dehydration signs only "AOR" | Abstract; Table 2 | 1·50 (0·79–2·88) | Identical to interaction OR; 0.38/(0.96 × 0.26) = 1.52 (rounding of the inputs allows 1.47–1.58); CI includes 1; p ≈ 0.22 |
| Neurological "AOR" | Abstract; Table 2 | 0·86 (0·51–1·48) | Identical to interaction OR; 1.15/(3.57 × 0.37) = 0.87 (rounding allows 0.85–0.89); CI includes 1; p ≈ 0.58 |
| Cited CIs that exclude 1 | Abstract | "significantly reduced … in all subgroups" | 0 of 5; 3 of 5 point estimates are above 1 |
| Correct vs wrong fluid, symptom present (OR11/OR10) | Derived from Table 2 | not reported | Respiratory 0.37 (≈0.23–0.60); circulatory 0.33 (≈0.19–0.57); pallor 0.50 (≈0.30–0.83); dehydration only 0.40 (≈0.24–0.65); neurological 0.32 (≈0.20–0.52). Approximate CIs, covariance ignored |
| Correct vs wrong fluid, symptom absent (OR01) | Table 2 | 0·30, 0·35, 0·29, 0·26, 0·37 | Same values; all five printed CIs exclude 1 |
| Identity linking the two | Table 2 footnote | interaction = OR11/(OR10·OR01) | (OR11/OR10) / OR01 equals the interaction OR in every row: the interaction OR is the ratio of the two within-stratum fluid effects |
| Dehydration signs only, RERI | Table 2 | 0·25 (−0·18 to 0·48) | OR11 − OR10 − OR01 + 1 = 0.38 − 0.96 − 0.26 + 1 = 0.16; the printed CI's midpoint is 0.15 |
| Dehydration signs only, AP | Table 2 | 0·40 | RERI/OR11 = 0.16/0.38 = 0.42 with the recomputed RERI; 0.25/0.38 = 0.66 with the printed RERI |
| RERI and AP, other four rows | Table 2 | e.g. −0·38, −0·63, −1·80, −1·31 | Recompute to −0.38, −0.63, −1.79, −1.31; the AP CI midpoints in all four rows, and the RERI CI midpoints for circulatory, pallor and neurological, match the point estimates. The respiratory RERI CI midpoint (−5.81) does not (see next row) |
| Respiratory RERI CI | Table 2 | −1·31 (−2·16 to −9·45) | Upper limit (−9.45) is below both the point estimate and the lower limit, which is impossible; a symmetric interval around −1.31 would end near −0.46 |
So the abstract's numbers are the Table 2 interaction ORs. The cell ORs in each row reproduce them, so the column labels are internally consistent. None of the five is significant. The contrast the abstract's sentence describes (correct versus wrong fluid within a subgroup) is a different quantity. Table 2 points to it being below 1 in all five subgroups, in both strata, but the paper does not report it.
Figure
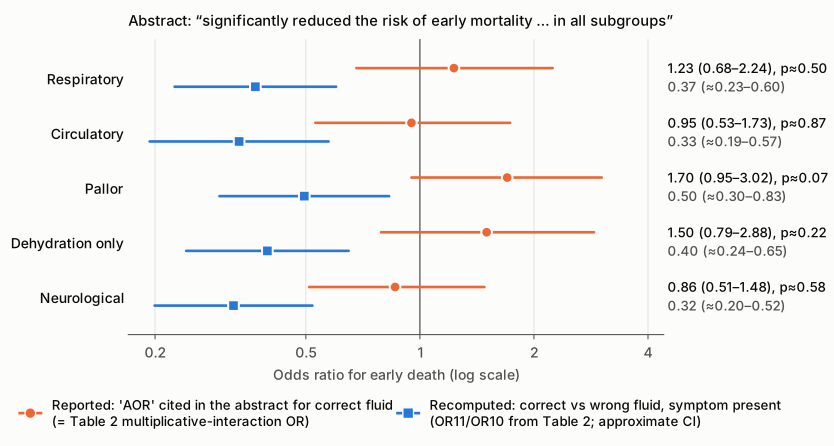
Figure 1. One log-scale odds-ratio axis; the vertical line marks OR = 1. Orange circles and lines are the five values the abstract cites as AORs for correct fluid prescription, with their printed 95% CIs. They are identical to Table 2's multiplicative-interaction column. Each crosses 1, and the approximate p value is printed beside it. Blue squares are the odds ratio for correct versus wrong fluid among children with the sign present, recomputed from the same Table 2 row as OR11/OR10. Their intervals are approximate because the covariance of the two estimates is not reported and is ignored here. All five blue estimates lie below 1. The abstract's sentence describes the blue quantity but cites the orange numbers.
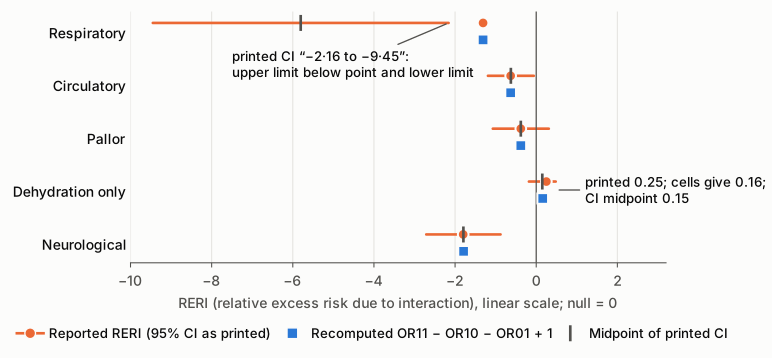
Figure 2. Table 2's RERI column on a linear axis; the vertical line marks 0. Orange: RERI and 95% CI as printed. Blue squares: OR11 − OR10 − OR01 + 1 from the same row. Gray ticks: midpoint of the printed CI. In three rows (circulatory, pallor, neurological) the three agree. For dehydration signs only, the printed point (0.25) differs from both the formula (0.16) and the CI midpoint (0.15). For respiratory signs, the printed point (−1.31) matches the formula, but the printed interval runs from −2.16 to −9.45, so the point lies outside it and the CI midpoint (−5.81) is far from it.
Why it matters
The effect of correct fluid prescription is one of the paper's two stated aims and is named in its title. The abstract's Findings sentence is the only place in the summary that quantifies it, and the Interpretation ("reduces risk of death") and the closing Discussion sentence are the abstract-level and concluding statements of it. The body gives one other quantitative statement: "The predicted probability of early in-hospital death was reduced by 6% when derived from model II with correct fluid prescription compared with when fluid prescription is wrong" (Results, effect-modification paragraph). That is an overall model prediction, not a subgroup estimate, and it is printed without a CI or test, so it does not support "significantly … in all subgroups". A reader of the abstract alone would take the five AORs as subgroup treatment effects. Three are above 1 and none excludes 1, so the reader would see a contradiction or would misread interaction estimates as effects of fluid prescription. Meta-analysts and guideline reviewers who extract the abstract figures would record five non-significant ORs, some pointing to harm, for a result the paper calls a significant reduction. The Results paragraph also calls three non-significant interaction ORs "evidence of interaction". The data do not support that claim on the multiplicative scale. On the additive scale, the RERI CIs for pallor and dehydration signs only include 0, and the respiratory RERI CI is unusable as printed. The paper's own cells point to a consistent protective association of correct fluid. The defect is therefore in which estimates are reported and how they are described, not necessarily in the direction of the conclusion. The magnitude and precision of the subgroup effects cannot be checked from what is published.
Explanations considered
- Text-conversion or extraction artifact. Not supported. The version-of-record check found the same sentence and numbers in the publisher-deposited JATS XML in Europe PMC and in the separately supplied MEDLINE abstract (PMID 29971245). The publisher's typeset Figure 3 image was also inspected. Its interaction panel ("Adjusted odds ratios (model II-interactions)") shows the five abstract subgroups (plus airway signs) with CIs crossing 1. In the XML, Table 2's cells are aligned with their headers.
- The abstract values are the within-subgroup fluid effects and the Table 2 column is mislabelled. Not supported. Each value equals OR11/(OR10 × OR01) recomputed from the other cells in its row, within input rounding. The Results paragraph calls the same numbers "multiplicative interactions". Neither within-stratum effect (OR11/OR10 or OR01) is close to any of the five values.
- "Significantly" refers to something other than the cited ORs, such as the additive interaction. It does not account for the numbers. The sentence attaches the five ORs directly to the claim. RERI is a measure of interaction, not of the effect of fluid. Its printed CIs include 0 for pallor (−1.07 to 0.31) and dehydration signs only (−0.18 to 0.48), so it is not significant in all subgroups either.
- "Significantly" refers to the within-stratum correct-versus-wrong contrasts, and the wrong column was copied into the abstract. This would explain the wording. The approximate intervals for OR11/OR10 and the printed intervals for OR01 all exclude 1. But the paper never reports those subgroup estimates with CIs, so the claim remains unverifiable as published, and the numbers it does cite contradict it. The approximate intervals here ignore a covariance that only the authors' model output provides.
- Rounding. Rounding explains the small gaps between printed and recomputed interaction ORs (for example 1.50 against 1.52, inside the rounding range 1.47–1.58). It cannot move any CI to exclude 1. It also cannot explain the dehydration RERI (0.25 against 0.16, with a CI midpoint of 0.15 and an AP that matches 0.16) or the respiratory RERI interval, whose upper limit lies below its lower limit.
Status
As of 2026-10-23:
- Version of record. The publisher's HTML and PDF could not be opened directly. doi.org redirected to an Elsevier placeholder, and thelancet.com returned HTTP 403. The abstract sentence, Table 2 and the interaction values were confirmed in three publisher-derived copies: the publisher-deposited JATS XML in Europe PMC (CC BY), the MEDLINE abstract (PMID 29971245), and the publisher's Figure 3 image (gr3.jpg).
- Supplements. The Europe PMC supplementary bundle for PMC6004535 contains only the article figures (gr1–gr3). The JATS XML has no supplementary-material element or appendix reference. No source of subgroup-specific correct-versus-wrong fluid ORs with CIs was found. A web appendix listed on the journal site could not be ruled out, because that site returned HTTP 403.
- Corrections and retractions. Crossref update metadata, PMC notices and Europe PMC notices list no correction, erratum, expression of concern or retraction. A web search for the title with "correction" or "erratum" found no correction notice.
- Linked commentary. The PMC record links an accompanying Comment in the same journal: "Treating dehydrating diarrhoea at district hospital level in sub-Saharan Africa: from policy to reality", Lancet Child Adolesc Health 2018, pp 471–472, doi:10.1016/S2352-4642(18)30166-4, PMID 30169312. Its text was not read. It is not open access, Europe PMC holds no abstract or full text for it, and the journal and ScienceDirect pages returned HTTP 403. Whether it repeats or relies on the abstract's "significantly reduced … in all subgroups" claim is therefore not known.
- PubPeer. PubPeer's API returned a human-verification challenge (HTTP 403) to scripted access, so it could not be queried directly. A web search for the title together with "PubPeer" found no thread. Absence of a PubPeer discussion is therefore not fully confirmed.
- Sources. Article as archived in PMC (PMC6004535); Europe PMC JATS XML and supplementary files; MEDLINE record PMID 29971245; Crossref record for doi:10.1016/S2352-4642(18)30130-5; Europe PMC and Crossref records for the linked Comment (PMID 30169312, doi:10.1016/S2352-4642(18)30166-4), metadata only.
Suggested correction
- In the abstract Findings, replace the five interaction ORs with estimates of the quantity the sentence describes. One option is the adjusted OR for correct versus wrong fluid within each subgroup (OR11/OR10, with a CI from the fitted model including the covariance term). Another is the overall adjusted OR for correct fluid. Alternatively, keep the interaction ORs but describe them accurately, for example: "There was no evidence that the association of correct fluid prescription with early mortality differed by clinical sign on the multiplicative scale (interaction ORs 0·86–1·70, all 95% CIs including 1)." Remove "significantly" and "in all subgroups" unless subgroup-specific estimates with CIs excluding 1 are reported.
- In the Results effect-modification paragraph, revise "are evidence of interaction" for the three interaction ORs whose CIs include 1.
- In Table 2, correct the dehydration-signs-only RERI. The footnote formula gives 0.16, consistent with the printed CI midpoint (0.15) and the printed AP (0.40, against 0.42). Correct the respiratory RERI CI, whose printed upper limit (−9·45) cannot be right; a symmetric interval would end near −0.46.
- Consider adding a column to Table 2 with the within-stratum correct-versus-wrong fluid OR and its CI for each sign, so readers can check the abstract's claim directly.