← Back to the plain-language case
The abstract's anxiety odds ratio (5.80) lies outside its own 95% CI (1.19 to 4.22)
Ann Rheum Dis (2017) · doi:10.1136/annrheumdis-2017-212000 · PMC5867422
Summary
The abstract reports that high fear scores on the FAIR questionnaire were associated with high HADS anxiety, "OR 5.80, 95% CI (1.19 to 4.22)". The point estimate is above the upper limit of its own interval, which a Wald interval cannot produce. The geometric centre of the printed interval is 2.24, while the abstract's other four odds ratios sit at the centres of their intervals to within rounding. Figure 3, the paper's forest plot, splits HADS anxiety into two categories. Read by pixel, its 8–10 vs <8 row has an interval of about 1.20 to 4.18, which matches the abstract's interval, and its >10 vs <8 row has an OR of about 5.97, which matches the abstract's 5.80. The abstract therefore appears to pair the estimate of one category with the interval of the other, without naming either. Under either pairing the association remains positive and its interval excludes 1, but the size of the effect given in the abstract is not a valid estimate-interval pair.
What the paper reports
Abstract, Results (identical in the PMC archive and in the publisher's typeset PDF):
High fear scores were associated with high Arthritis Helplessness Index scores (OR 6.85, 95% CI (3.95 to 11.87)); high Hospital Anxiety and Depression Scale anxiety (OR 5.80, 95% CI (1.19 to 4.22)) and depression (OR 2.37, 95% CI (1.29 to 4.37)) scores; low education level (OR 3.48, 95% CI (1.37 to 8.83)); and high perceived disease activity (OR 2.36, 95% CI (1.10 to 5.04)).
Methods, statistical analysis:
Univariate, then multivariate logistic regression was used to identify patient variables (including demographic, social and economic characteristics; disease status, and anxiety/depression and helplessness levels) independently associated with the highest compared with the lowest fear score cluster.
Results, "Factors associated with fear scores" (the text gives no numbers and refers to Figure 3):
Cluster 1 (high fear scores) was associated with higher global rating of disease activity by the patient, high AHI helplessness scores and high HADS anxiety and depression scores.
Figure 3 caption:
High scores indicate those >75 (shown in red); moderate scores, 50–75 (shown in blue); and low scores, <50. Data are presented as ORs (95% CIs).
Figure 3 itself is an image. Its HADS anxiety block has two rows, labeled "8-10 vs <8" and ">10 vs <8". It shows markers on a log axis from 0.1 to 10 and prints no numbers.
Discussion, second and third paragraphs:
In contrast, a strong association was observed between FAIR scores and scores on the AHI (≥20) or HADS (≥10 for anxiety and ≥8 for depression), all of which are non-specific markers of psychological distress.
In agreement with this, we observed a robust association between fears and non-specific measures of psychological distress, such as the AHI, the HADS anxiety score and, to a lesser extent, the HADS depression score.
What the paper's own numbers show
Method. An odds ratio from logistic regression with a Wald interval satisfies CI = exp(b ∓ 1.96·SE) with OR = exp(b). So the OR must lie inside its interval and equal the interval's geometric centre, √(lower × upper), up to rounding. Each arm of the interval implies an SE(log OR): ln(OR/lower)/1.96 for the lower arm and ln(upper/OR)/1.96 for the upper arm. The two must agree and both must be positive. I applied this to all five odds ratios in the abstract.
Figure 3 gives the HADS anxiety association in two categories, so I also measured its red markers (high vs low fear cluster) by pixel position. I calibrated the log axis on its tick marks at 0.1, 1 and 10, which are exactly 194 px per decade apart, so 1 px is about 1.2% of an OR. As a check on the method, the four abstract ORs that correspond to a single Figure 3 row read 0.4% to 2.1% high, and their lower limits match to within 0.02. Upper ends beyond 10 are cut off at the edge of the plot, as the AHI row shows: its printed upper limit is 11.87, but the line stops at about 9.8. Every number below is printed by recompute.py.txt.
| Quantity | Location | Reported | Recomputed from the paper's numbers |
|---|---|---|---|
| HADS anxiety OR and 95% CI | Abstract | 5.80 (1.19 to 4.22) | OR lies outside its CI: 1.58 above the upper limit (a factor of 1.37) |
| Geometric centre of the HADS anxiety CI | Abstract | — | √(1.19 × 4.22) = 2.24; reported OR / centre = 2.59 |
| SE(log OR) implied by each arm, HADS anxiety | derived | — | lower arm 0.808, upper arm −0.162 (a negative SE is impossible); symmetric SE 0.323 |
| Interval of the printed width centred on 5.80 | derived | — | 3.08 to 10.92 |
| AHI OR and 95% CI | Abstract | 6.85 (3.95 to 11.87) | centre 6.85; arms 0.281 / 0.280 (consistent) |
| HADS depression OR and 95% CI | Abstract | 2.37 (1.29 to 4.37) | centre 2.37; arms 0.310 / 0.312 (consistent) |
| Low education OR and 95% CI | Abstract | 3.48 (1.37 to 8.83) | centre 3.48; arms 0.476 / 0.475 (consistent) |
| High perceived activity OR and 95% CI | Abstract | 2.36 (1.10 to 5.04) | centre 2.35; arms 0.389 / 0.387 (consistent) |
| HADS anxiety 8–10 vs <8 | Figure 3 (image, no numbers) | marker and line | OR ≈ 2.28, line ≈ 1.20 to ≈ 4.18: matches the abstract's interval and its centre (2.24) |
| HADS anxiety >10 vs <8 | Figure 3 (image, no numbers) | marker and line | OR ≈ 5.97, line ≈ 3.03 to ≥ 9.94 (cut off at 10): matches the abstract's point estimate (5.80) |
| Figure-reading check, AHI / depression / education / activity | Figure 3 vs Abstract | 6.85 / 2.37 / 3.48 / 2.36 | read as 6.88 / 2.42 / 3.52 / 2.41 (ratio to printed 1.004 to 1.021) |
| Significance, if the OR is 2.24 with the printed CI | derived | — | z = 2.50, p ≈ 0.013 |
| Significance, if the OR is 5.80 with an SE like the printed CI's | derived (illustration only) | — | 3.08 to 10.92; z = 5.44 |
The lower end of the Figure 3 >10 row (≈ 3.03) lies close to the lower limit of an interval of the printed width centred on 5.80 (3.08). Its lower arm implies an SE of 0.346, against 0.323 for the printed interval. That fits the reading that 5.80 is the >10 estimate and that its own interval was replaced by the 8–10 interval.
A separate, smaller inconsistency turned up in the same abstract. It does not affect the odds ratios:
| Quantity | Location | Reported | Recomputed |
|---|---|---|---|
| Mean FAIR score, RA | Abstract vs Results | Abstract: "51.2 (±25.4) in RA"; Results: "51.8±25.4" | Overall mean 54.9 with axSpA 60.5 (n = 432 and 240) implies an RA mean of 51.79, so 51.8 fits. With 51.2, the overall mean would be 54.52, not 54.9 |
Figure
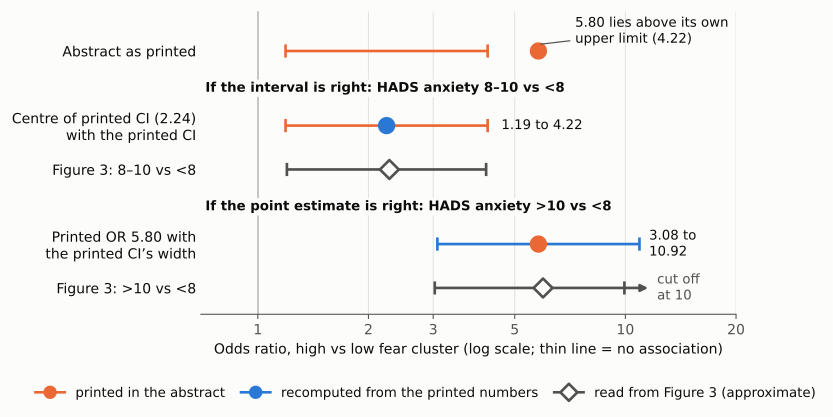
Figure 1. HADS anxiety odds ratios for the high vs low fear cluster, on one log axis with the null value (OR = 1) as a thin vertical line. Orange marks are numbers printed in the abstract. Blue marks are recomputed from them: the geometric centre of the printed interval (2.24) and an interval of the printed width centred on the printed OR (3.08 to 10.92). Gray hollow diamonds are approximate readings of the two HADS anxiety rows of the paper's Figure 3, measured by pixel position; the >10 row's line runs to the edge of that plot at 10, so its upper end is a lower bound. The printed pair (top row) is impossible because 5.80 lies above 4.22. Each of the two consistent pairings agrees with one Figure 3 row, and both lie wholly above 1.
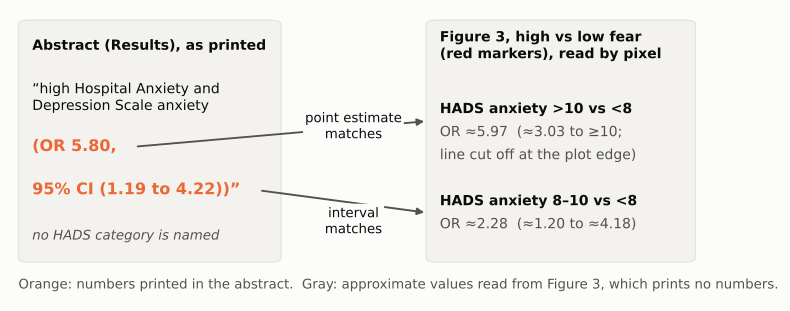
Figure 2. The abstract's estimate and interval trace to different rows of Figure 3. The printed interval, 1.19 to 4.22, matches the 8–10 vs <8 row (≈ 1.20 to ≈ 4.18). The printed point estimate, 5.80, matches the >10 vs <8 row (≈ 5.97). The abstract names neither category. Figure 3 values are approximate readings, because the figure prints no numbers.
Why it matters
The HADS anxiety estimate is one of five headline associations in the abstract, and for most readers the abstract is the only place it appears as a number. The Results text gives no odds ratios, and Figure 3 shows them only graphically.
- The printed pair cannot be used as published. A reader or meta-analyst who takes the SE from the printed interval and the estimate from the printed OR gets a log OR that is about one SE above the interval's upper limit. A reader who back-calculates from either arm alone gets an SE of 0.808 or a negative one.
- The size of the anxiety effect depends on which number is right. With the >10 category the OR is about 5.8, close to the AHI estimate (6.85) and well above depression (2.37). With the 8–10 category it is about 2.2–2.3, about the same as depression. The Discussion's statement that the association is with "the HADS anxiety score and, to a lesser extent, the HADS depression score" holds for the >10 category but not for the 8–10 category. The abstract does not say which category its number refers to, and readers have no way to tell.
- Direction and significance are not affected. Both consistent pairings lie wholly above 1 (z = 2.50 for 2.24 with the printed interval). Figure 3, which appears to be drawn correctly, shows the same. The abstract's conclusion that "High fear scores were associated with psychological distress" is unaffected.
Explanations considered
- Conversion or typesetting artifact in PMC. This is excluded. The publisher's typeset PDF (InDesign file, created 2018-01-11) has the same numbers, as do the PMC HTML, the Europe PMC XML and the PubMed record. The numbers involve no minus signs, superscripts or table cells that a conversion could garble.
- An asymmetric (profile-likelihood or exact) interval. This does not account for the numbers. An asymmetric interval still contains its own estimate, and 5.80 lies outside 1.19 to 4.22. The other four abstract intervals are symmetric on the log scale (their two arms differ by at most 0.002 in SE units), which indicates that Wald intervals were used.
- A different confidence level (90% or 99%). This does not account for the numbers. Any interval for an estimate contains that estimate, whatever its level.
- A single-digit misprint in the OR. This does not fit. With the printed interval, an OR of 2.80, 3.80, 4.80 or 5.30 gives arms of 0.437/0.209, 0.592/0.053, 0.712/−0.066 and 0.762/−0.116. Only a value near 2.24 makes the arms agree, and 2.24 is not one keystroke away from 5.80.
- A misprint in the interval. This is possible but less likely than the pairing explanation. The printed interval is not arbitrary: it matches the Figure 3 8–10 row to within the precision of the reading at both ends.
- The abstract's estimate and interval come from the two HADS anxiety categories of Figure 3. This accounts for all the numbers. The interval matches the 8–10 vs <8 row, and the point estimate matches the >10 vs <8 row. Which category the abstract meant to report cannot be confirmed without the regression output. The words "high ... anxiety" and the Discussion's cut-off of "≥10 for anxiety" suggest the upper category. Even so, ≥10 is not the same as the figure's >10, and a score of 10 falls in the figure's 8–10 row.
- Imprecise figure reading. This does not change the conclusion. The impossibility of the printed pair follows from the abstract's numbers alone. The figure readings agree with the four unambiguous abstract ORs to within about 2%, while the two HADS anxiety rows differ from each other by a factor of about 2.6.
Status
- Version of record. I checked the publisher's typeset PDF (6 pages, Adobe InDesign CS6, created 2018-01-11, from the PMC open-access bucket,
PMC5867422.1.pdf). Its abstract reads "Scale anxiety (or 5.80, 95% CI (1.19 to 4.22))" and "51.2 (±25.4) in rA", where "or" and "rA" are the PDF's small-caps text, and its Results read "(51.8±25.4; 52 (33–71))". The publisher's web pages (ard.bmj.com, ard.eular.org) returned HTTP 403 to automated access. The PMC HTML, Europe PMC full-text XML and the PubMed record (PMID 29102955) carry the same values. The article appeared online in 2017 and in print in 2018 (77(2):258–263). Every quote above was confirmed verbatim against the PMC-archived text. - Figure 3. I measured the publisher's image
annrheumdis-2017-212000f03.jpg(703 × 1015 px) from Europe PMC.recompute.py.txt --figure <file>repeats the measurement, and the script records the file's SHA-256 hash. - Supplements. The four supplementary files (a flow chart, a correlation figure, ROC curves and tables of the questionnaire items) contain no odds ratios and do not resolve the inconsistency.
- Corrections and comments. As of 2026-10-23 I found no correction, erratum, expression of concern or retraction. Crossref lists no update relations for the DOI, PMC and Europe PMC list no correction or comment links, PubMed has no CommentsCorrections entry, and the typeset PDF carries no notice. PubPeer's API and search page refused automated access (Cloudflare challenge and HTTP 403). A web search found no PubPeer entry and no discussion of these numbers.
- Sources. PMC article PMC5867422; publisher PDF via the PMC open-access bucket; Figure 3 and supplementary files via Europe PMC; Crossref; Europe PMC; PubMed; PubPeer (attempted).
Suggested correction
- In the abstract, replace "OR 5.80, 95% CI (1.19 to 4.22)" with an estimate and interval from the same row of the regression output, and name the category. For example: "HADS anxiety >10 vs <8 (OR 5.80, 95% CI (x to y))", or the 8–10 vs <8 estimate with 1.19 to 4.22, whichever was intended. Reporting both categories would remove the ambiguity.
- Give the Figure 3 odds ratios and intervals as numbers, in the figure or in a table (online if necessary), so that readers do not have to read them off the plot. Extending the axis past 10 would show the full AHI and HADS >10 intervals.
- Make the HADS anxiety cut-off consistent between the Discussion ("≥10 for anxiety") and Figure 3 (">10").
- Minor: change the abstract's RA mean FAIR score from 51.2 to 51.8, which agrees with the Results and with the overall mean of 54.9.