← Back to the plain-language case
Abstract's age pattern for all STIs except HSV-2 is contradicted by the paper's syphilis estimates
PLOS Medicine (2018) · doi:10.1371/journal.pmed.1002511 · PMC5828349
Summary
This individual participant data meta-analysis of 18 HIV prevention studies reports STI prevalence among women in sub-Saharan Africa by age, region and population type. The abstract states that, in all three primary region/population groups, prevalence was higher among 15–24-year-old than 25–49-year-old women "for all STIs except HSV-2". The author summary repeats this, adding "regardless of region or population type". The paper's own syphilis estimates do not show this pattern. In South African clinic/community populations, overall syphilis prevalence was 4.3% (95% CI 2.5–7.2) at ages 25–49 and 1.5% (1.0–2.2) at 15–24. The intervals do not overlap, and the Results text itself says the older group's prevalence "was higher". In the other two groups, prevalence was higher or similar in older women. High-titer syphilis in South Africa (1.0% vs 0.4%) and trichomoniasis in South Africa (8.6% vs 7.9%) also have higher point estimates in older women. The age pattern does hold for chlamydia and gonorrhea. As written, though, the headline statement misdescribes syphilis, the STI most directly tied to antenatal screening and congenital-syphilis programs.
What the paper reports
Abstract, "Methods and findings". The sentence before it reads "Despite substantial study heterogeneity for some STIs/populations, several patterns emerged."
Across the three primary region/population groups (South Africa community-based, Southern/Eastern Africa community-based, and Eastern Africa higher-risk), prevalence was higher among 15–24-year-old than 25–49-year-old women for all STIs except HSV-2.
Author summary, "What did the researchers do and find?":
STI prevalence was highest among young women aged 15–24 years for all STIs except HSV-2, regardless of region or population type.
Discussion, opening paragraph:
We observed age-, region- and population-specific patterns in the prevalence of these infections, including higher prevalence of STIs among younger (15–24-year-old) than older (25–49-year-old) women, …
Discussion, the paragraph that links the findings to the WHO Global Strategy for STIs. Unlike the abstract, this sentence says "generally":
In terms of the “who,” across all populations and regions, STI prevalence was generally higher among younger than older women, except for the prevalence of antibodies to HSV-2, which increased with age.
Results, "Syphilis, overall (high, low, and unknown titer infection)", first paragraph:
Among 15–24-year-old women, the summary estimate of syphilis prevalence overall (i.e., proportion of participants with a positive RPR and positive treponemal test) was less than 2% in clinic/community populations in both South Africa (1.5% [95% CI: 1.0%, 2.2%]; I2 = 57.7%) and Southern/Eastern Africa (1.4% [95% CI: 1.0%, 1.9%]; I2 = 25.8%), and higher among higher-risk populations in Eastern Africa (8.4% [95% CI: 6.8%, 10.3%]; I2 = 46.3%) (Fig 5).
Results, same section, second paragraph:
Among 25–49-year-olds in clinic/community populations in South Africa, the summary estimate of syphilis prevalence overall among 25–49-year-old women (4.3% [95% CI: 2.5%, 7.2%]; I2 = 94.8%) was higher than that among younger women (1.5%) (Fig 6). In clinic/community populations in Southern/Eastern Africa, the summary estimate of syphilis prevalence overall (2.0% [95% CI: 1.4%, 2.6%]; I2 = 61.8%) was similar to the summary estimate among younger women (1.4%). In the higher-risk populations in Eastern Africa, the summary estimate among older women (7.5% [95% CI: 5.5%, 10.1%]; I2 = 85.8%) was similar to prevalence among younger women (8.4%).
Results, "Syphilis, high-titer infection":
Point estimates for women aged 25–49 years were similar to those in younger populations, but were more heterogeneous (Fig 8).
The "Overall prevalence" rows of Table 4 (15–24 years) and Table 5 (25–49 years), South African clinic/community populations, as archived in PMC:
Table 4: Syphilis, high-titer infection — Overall prevalence: 0.4% (0.3, 0.5); Trichomoniasis — Overall prevalence: 7.9% (5.9, 10.5)
Table 5: Syphilis, high-titer infection — Overall prevalence: 1.0% (0.5, 2.1); Trichomoniasis — Overall prevalence: 8.6% (6.5, 11.5)
Methods, "Statistical analysis". This describes how the strata were compared. No formal test between age groups is described.
We generated forest plots in R and inspected them visually to compare prevalence estimates across strata, and combined strata if estimates were similar.
What the paper's own numbers show
Method. I collected the paper's 15–24 and 25–49 summary prevalence estimates, with their 95% CIs, for each STI in each of the three primary groups. Overall syphilis comes from the Results text, which reports Figs 5 and 6 in numbers. Every other infection comes from the "Overall prevalence" row of Tables 4–9. Where the Results text also states a value, the table rows agree with it: chlamydia SA 15–24, trichomoniasis SA 25–49, trichomoniasis E Africa 15–24 and high-titer syphilis SA 15–24 match exactly, and HSV-2 SA 15–24 differs by 0.1 in one CI bound.
The paper pools study log odds with a random-effects model and back-transforms the pooled estimate and its CI. Its CIs are therefore symmetric on the logit scale, so the standard error of each pooled log odds can be recovered as (logit(upper) − logit(lower)) / 3.92. I then computed the older-versus-younger odds ratio, its 95% CI and an approximate z statistic, treating the two age groups' pooled estimates as independent, since they come from different women. This is a descriptive check of direction and size using only the published numbers. It is not a re-analysis of the participant data. Every number below is printed by recompute.py.txt.
| Quantity | Location | Reported | Recomputed from the paper's numbers |
|---|---|---|---|
| Direction of the age difference, all STIs except HSV-2, three primary groups | Abstract; Author summary | higher in 15–24 than 25–49 in every group | 9 of 12 infection × group cells (chlamydia, gonorrhea, overall syphilis, trichomoniasis) have the higher point estimate in 15–24, and 3 do not |
| Overall syphilis, SA clinic/community | Results text (Figs 5, 6) | 15–24: 1.5% (1.0, 2.2); 25–49: 4.3% (2.5, 7.2), "higher than that among younger women" | ratio 2.87; CIs do not overlap (2.5 > 2.2); OR 2.95 (1.49–5.84), z = +3.10, p ≈ 0.002, older higher |
| Overall syphilis, S/E Africa clinic/community | Results text | 15–24: 1.4% (1.0, 1.9); 25–49: 2.0% (1.4, 2.6), "similar" | OR 1.44 (0.91–2.26), z = +1.57, p ≈ 0.12; older point estimate higher, not significant |
| Overall syphilis, E Africa higher-risk | Results text | 15–24: 8.4% (6.8, 10.3); 25–49: 7.5% (5.5, 10.1), "similar" | OR 0.88 (0.59–1.32), z = −0.60, p ≈ 0.55; no clear difference |
| High-titer syphilis, SA clinic/community | Table 4 vs Table 5 | 15–24: 0.4% (0.3, 0.5); 25–49: 1.0% (0.5, 2.1); text: point estimates "similar" | ratio 2.50; CIs touch at 0.5; OR 2.52 (1.16–5.43), z = +2.35, p ≈ 0.02, older higher |
| High-titer syphilis, S/E Africa; E Africa higher-risk | Tables 6/7, 8/9 | 1.1% vs 0.9%; 4.5% vs 2.8% | OR 0.82 (0.20–3.39); OR 0.61 (0.38–0.97) |
| Trichomoniasis, SA clinic/community | Table 4 vs Table 5 | 15–24: 7.9% (5.9, 10.5); 25–49: 8.6% (6.5, 11.5) | OR 1.10 (0.70–1.71), z = +0.41, p ≈ 0.68; older point estimate slightly higher, no clear difference |
| Trichomoniasis, S/E Africa; E Africa higher-risk | Tables 6/7, 8/9 | 6.7% vs 5.8%; 12.7% vs 10.0% | OR 0.86 (0.47–1.57); OR 0.76 (0.33–1.78); younger point estimate higher, not significant |
| Chlamydia, three groups | Tables 4–9; Results | 15.1 vs 7.0; 2.7 vs 1.2; 10.3 vs 6.2 | younger higher in 3/3; OR 0.42, 0.44, 0.58, all with p < 0.05 |
| Gonorrhea, three groups | Tables 4–9; Results | 4.6 vs 2.5; 1.7 vs 0.9; 8.2 vs 5.2 | younger higher in 3/3; OR 0.53, 0.53, 0.61 (p ≈ 0.03, 0.07, 0.05) |
| HSV-2, three groups (excluded by the abstract) | Tables 4–9 | 39.3 vs 77.8; 46.8 vs 70.0; 56.3 vs 83.3 | older higher in 3/3, as the paper says |
Of the 12 non-HSV-2 cells, younger women's prevalence is higher with approximate p < 0.05 in 4 cells (all chlamydia, plus gonorrhea in South Africa). Older women's prevalence is higher with p < 0.05 in 1 cell, overall syphilis in South Africa. That cell has non-overlapping CIs, so the paper's own numbers support the reverse of the abstract statement there, as the paper's own Results text says. Across the three groups, syphilis does not show the pattern the abstract describes: the difference is reversed in South Africa, the point estimate is higher in older women in Southern/Eastern Africa, and the estimates are similar in Eastern Africa.
A separate, minor slip turned up in the Results trichomoniasis paragraph: "among 25–29-year-olds in the South African clinic/community-based populations … (summary estimate: 8.6% …)". The value matches the 25–49 row of Table 5, so "25–29" appears to be a typographical error for "25–49".
Figure
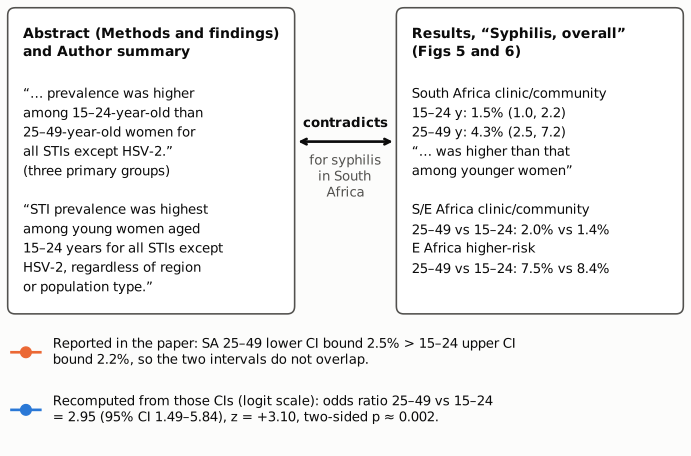
Figure 1. On the left, the abstract and author-summary statements, quoted verbatim. On the right, the paper's Results text on overall syphilis (Figs 5 and 6), with the 95% CIs as printed. The connector marks the conflict. In South African clinic/community women, the paper reports 4.3% (2.5–7.2) at 25–49 and 1.5% (1.0–2.2) at 15–24, and its Results text calls the older group's prevalence higher. The orange-marked line restates the reported interval bounds, which do not overlap. The blue-marked line is the odds ratio recomputed from those reported CIs on the logit scale: 2.95 (1.49–5.84), z = +3.10. The abstract statement implies an odds ratio below 1.
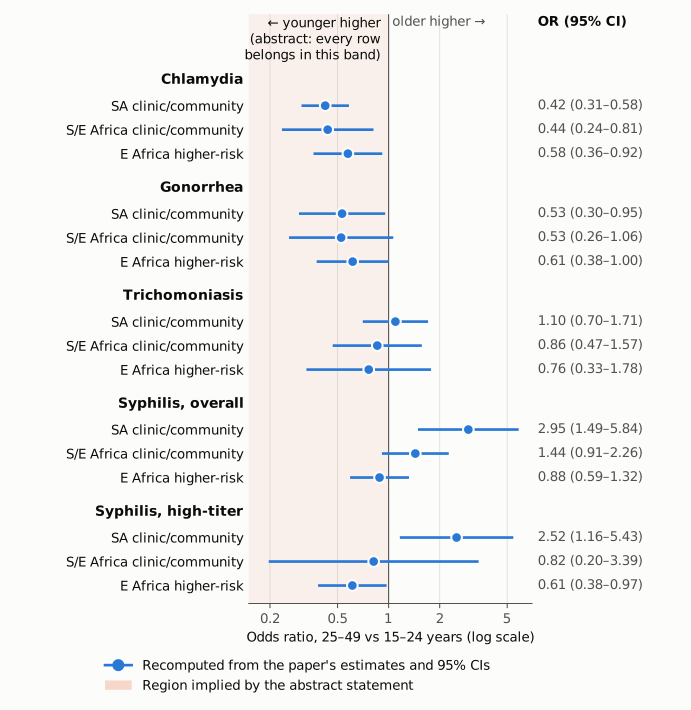
Figure 2. For each STI the abstract statement covers (all except HSV-2) and each of the three primary groups, the blue dot and line are the odds ratio, 25–49 versus 15–24 years, with its 95% CI. Each is recomputed from the paper's reported summary prevalence and 95% CI (overall syphilis from the Results text; other infections from the "Overall prevalence" rows of Tables 4–9). The axis is logarithmic, and the thin vertical line marks OR = 1 (no age difference). The shaded orange band is where the abstract statement says every point estimate should lie (younger higher). Chlamydia and gonorrhea lie inside it. Overall syphilis in South Africa lies entirely outside it, and so does high-titer syphilis in South Africa. Overall syphilis in Southern/Eastern Africa and trichomoniasis in South Africa have point estimates on the "older higher" side.
Why it matters
The age statement is one of the few cross-cutting patterns the abstract reports. It is the first finding listed after "several patterns emerged". The author summary repeats it in stronger form ("regardless of region or population type"), and the Discussion uses it to answer the "who" of the WHO Global Health Sector Strategy on STIs. Abstracts and author summaries are what most readers, guideline writers and secondary reviews take from a prevalence paper. A reader relying on them would conclude that syphilis, like chlamydia and gonorrhea, is concentrated in women under 25 in all three settings. The paper's own estimates show that it is not. In South African clinic/community populations, syphilis prevalence is roughly three times higher in women aged 25–49. Elsewhere it is higher or similar in older women.
For syphilis this difference has practical weight. Antenatal syphilis screening and congenital-syphilis elimination programs cover women of all reproductive ages, so where seroprevalence peaks matters for targeting. The underlying estimates, the Results text and the forest plots appear to be correct and internally consistent. The error is in how they are summarized. The paper's other conclusions, on chlamydia and gonorrhea age gradients, regional differences, higher-risk populations, and HSV-2 and BV burden, are not affected.
Explanations considered
- The abstract means "generally", not "in every case". This does not account for the numbers. The Discussion does say "generally", but the abstract and author summary do not hedge, and the author summary adds "regardless of region or population type". In any case the exception is not borderline. It is a full infection (syphilis) whose age difference is null or reversed in all three groups, and significantly reversed in one.
- "Higher" refers to statistically significant differences, and the syphilis differences are not significant. This does not account for the numbers. The paper did not test age differences; it compared forest plots visually (Methods). The one syphilis difference that the published CIs show clearly, in South Africa (non-overlapping CIs; recomputed p ≈ 0.002), runs in the opposite direction to the statement. Under this reading the trichomoniasis and gonorrhea cells would not support the statement either, since several are not significant.
- "Syphilis" in the abstract refers to high-titer (active) infection rather than overall seroprevalence. This does not account for the numbers. High-titer syphilis in South Africa is also higher in older women: 1.0% (0.5, 2.1) against 0.4% (0.3, 0.5), recomputed OR 2.52 (1.16–5.43). The Results describe the high-titer point estimates as "similar" across age groups, which is not "higher among 15–24-year-olds" either.
- The two age groups draw on different sets of studies, so the comparison is not like-for-like. This may be partly true for some strata (study inclusion was applied per infection, and some strata may lack a study). But the abstract statement compares exactly these published summary estimates, and the paper's own Results text makes the same comparison and finds the older group higher. It does not reconcile the abstract with the Results.
- High heterogeneity (I² = 94.8% for SA 25–49) makes the older-women estimate unreliable. This lowers the precision of that estimate, but the random-effects CI already reflects the heterogeneity, and it still excludes the younger estimate. The paper reports and interprets the estimate without reservation in its Results.
- The approximate test assumes independence of the two age-specific pooled estimates. The two estimates come from different women, so their sampling errors are independent. Many of the same studies contribute to both, and any positive correlation between a study's deviation at ages 15–24 and at 25–49 would make the difference more precise than assumed here, not less. For a few strata with zero-count studies, the paper used exact binomial limits rather than a logit standard error (Methods), so the back-calculated standard errors are approximate there (for example, high-titer syphilis in Southern/Eastern Africa). None of this affects the central fact: the reported SA overall-syphilis CIs do not overlap.
- Text conversion or archiving error. Ruled out. The abstract, author summary and Results sentences, including the 4.3% (2.5%, 7.2%) estimate, appear identically on the publisher's version of record. The table values were read from the publisher-deposited PMC XML.
Status
- Version of record. I checked the publisher's article page (journals.plos.org/plosmedicine/article?id=10.1371/journal.pmed.1002511). The abstract sentence, the author-summary sentence, the overall-syphilis Results paragraph, the high-titer sentence, the Discussion "who" sentence and the "25–29-year-olds" slip all appear there verbatim. Tables 4–9 are shown as images on that page, so their values were taken from the publisher-deposited PMC XML. Every quote in this write-up was checked verbatim against the PMC-archived text with
src/show.py. - Supplements. The supporting-information list includes S5 and S6 Figs (overall syphilis by initial region and population type, 15–24 and 25–49) and S9 and S10 Figs (overall syphilis restricted to the 17 studies with titer information). I did not open them. They are forest plots stratifying the same estimates and do not change what the main-text numbers show. S1–S4 Tables and S1–S3 Text (checklists and protocol) are not relevant to this point.
- Corrections. One correction exists, doi:10.1371/journal.pmed.1002608 (PMC6019393), dated 2018-06-26. It changes only the copyright license, from CC0 to CC BY 4.0, and does not address the age statement. Crossref, PMC and Europe PMC list no other notices, and none of them lists a retraction or expression of concern.
- Comments. The PubPeer API returned no feedback for the DOI. The PubPeer web search page blocked automated access. The publisher page shows "Reader Comments (0)". A web search for the title with "syphilis", "erratum" and "PubPeer" found only copies of the article and repository records, no comment or correction.
- As of 2026-10-23.
Suggested correction
- Abstract: replace "prevalence was higher among 15–24-year-old than 25–49-year-old women for all STIs except HSV-2" with a statement that matches the Results. For example: "chlamydia and gonorrhea prevalence was higher among 15–24-year-old than 25–49-year-old women in all three groups; syphilis prevalence was similar or higher among 25–49-year-olds (e.g., 4.3% vs 1.5% in South African clinic/community populations); HSV-2 prevalence increased with age."
- Author summary: revise "STI prevalence was highest among young women aged 15–24 years for all STIs except HSV-2, regardless of region or population type" in the same way, naming syphilis (and HSV-2) as exceptions.
- Discussion: qualify the opening summary and the "who" paragraph to state that syphilis did not follow the younger-higher pattern, notably in South African clinic/community populations.
- Results, "Syphilis, high-titer infection": consider stating the South African 25–49 estimate (1.0% [0.5, 2.1] vs 0.4% [0.3, 0.5]) rather than describing the point estimates as "similar".
- Minor: in the trichomoniasis paragraph, change "25–29-year-olds" to "25–49-year-olds".