← Back to the plain-language case
Scenario 5 diabetes total printed as 1528, while its own Table 6 cells sum to 12 108
Lancet Public Health (2016) · doi:10.1016/S2468-2667(16)30037-8 · PMC5543265
Summary
This modelling study estimates the health effects of six possible industry responses to the UK soft drinks industry levy. For scenario 5, the better case for a shift in market share towards low-sugar drinks, the Abstract and the Total row of Table 6 report 1528 fewer incident cases of type 2 diabetes per year, with a 95% uncertainty interval (UI) of 4414 to 21 785 and a rate of 19·7 per 100 000 person-years. The point estimate lies below the lower bound of its own interval. The eight age-sex cells of the same column sum to 12 108, and the printed rate of 19·7 implies about 12 100 cases on the population denominator that the other scenarios share. 1528 is also exactly the value in the Women aged ≥65 years cell of that column. The headline figure for this scenario is therefore about 8 times too small, and read literally it reverses the ranking of scenarios for diabetes that the Results text describes. The paper's main conclusions are unaffected.
What the paper reports
Abstract, Findings:
Changes to market share to increase the proportion of low-sugar drinks sold in the better-case scenario would result in 91 042 (4289–204 903; 0·6%) fewer adults and children with diabetes, 1528 (4414–21 785; 19·7) fewer incident cases of diabetes per year, and 172 718 (47 919–294 499; 2·8) fewer decayed, missing, or filled teeth annually.
The same paragraph, for the price scenario (scenario 3):
An increase in the price of SSBs in the better-case scenario would result in 81 594 (3588–182 669; 0·5%) fewer adults and children with obesity, 10 861 (3899–18 964; 17·7) fewer incident cases of diabetes per year, and 149 378 (45 231–262 013; 2·4) fewer decayed, missing, or filled teeth annually.
Table 6 ("Reduction in the number of cases of diabetes per year with each scenario"), scenario 5 column, row "Women aged ≥65 years", and the Total row (all six scenarios):
Women aged ≥65 years | 2429 (38·8) | 448 (7·2) | 1369 (21·8) | 495 (7·9) | 1528 (24·4) | -1549 (-2·5)
Total; 95% UI | 19 094 (31·1); 6920 to 32 678 | 3584 (5·8); 1289 to 6466 | 10 861 (17·7); 3899 to 18 964 | 3955 (6·4); 1420 to 7085 | 1528 (19·7); 4414 to 21 785 | -1238 (-2·0); -2359 to -455
Table 6 footer:
Data in parentheses are reductions in incidence per 100 000 person-years. UI=uncertainty interval.
Results, diabetes paragraph:
Across the scenarios modelled, the pattern of results seen with obesity is repeated for type 2 diabetes.
Results, dental caries paragraph:
As with results for obesity and diabetes, the better case for change in market share (scenario 5) and price change (scenario 3) scenarios had the next largest effects respectively.
Methods, "Health impact modelling":
We applied all results to the 2014 UK population29 and made separate estimates for each outcome by sex and age group using age-specific and sex-specific estimates of baseline SSB consumption and disease burden.
What the paper's own numbers show
Method. Table 6 gives, for each scenario, eight age-sex cells and a Total row, each as a count with a rate per 100 000 person-years in parentheses. Because the model is applied to the whole UK population split by sex and age group, the Total should equal the sum of the eight cells (up to rounding), and the Total count divided by the Total rate should give the same population denominator in every scenario. I checked both identities for all six scenarios, using scenarios 1 to 4 as controls for the method, and compared scenario 5 with scenario 3 cell by cell. Every number below is printed by recompute.py.txt.
| Quantity | Location | Reported | Recomputed from the paper's numbers |
|---|---|---|---|
| Scenario 5 total, fewer diabetes cases per year | Abstract Findings; Table 6 Total row | 1528 (19·7); 95% UI 4414 to 21 785 | 12 108 = 45 + 145 + 5327 + 1598 + 33 + 143 + 3289 + 1528 (sum of the 8 cells) |
| Scenario 5 total, from the printed rate | Table 6 Total row | 19·7 per 100 000 | 19·7 × 61.40 M person-years = 12 095 (rounding range 12 045 to 12 145) |
| Scenario 5 rate implied by each count | derived | 19·7 | 12 108 gives 19·72; 1528 gives 2·49 |
| Denominator needed for 1528 and 19·7 to agree | derived | — | 7.76 M person-years, against 61.4 M in scenarios 1 and 3 |
| Point estimate inside its own UI? | Table 6 Total row | 1528 vs 4414 to 21 785 | No (1528 < 4414); 12 108 is inside |
| Identity with another cell | Table 6, scenario 5 | Total 1528; Women ≥65 cell 1528 (24·4) | Identical values; the cell's own rate is consistent (24·4 × 6.26 M = 1528) |
| Size of the discrepancy | derived | 1528 | 12 108 / 1528 = 7.92 |
| Scenario 1 total (control) | Table 6 | 19 094 (31·1) | cell sum 19 094; denominator 61.40 M |
| Scenario 2 total (control) | Table 6 | 3584 (5·8) | cell sum 3584 |
| Scenario 3 total (control) | Table 6 | 10 861 (17·7) | cell sum 10 861; denominator 61.36 M |
| Scenario 4 total (control) | Table 6 | 3955 (6·4) | cell sum 3956 (rounding) |
| Scenario 5 ÷ scenario 3, per cell | Table 6 | — | 1.107 to 1.138 in all eight cells |
| Scenario 5 ÷ scenario 3, totals | Table 6 | 1528 / 10 861 = 0.141 | 12 108 / 10 861 = 1.115; rates 19·7 / 17·7 = 1.113; UI bounds 1.132 and 1.149 |
| Diabetes ranking of scenarios | Table 6 vs Table 5 (obesity) | printed totals: S1 > S3 > S4 > S2 > S5 > S6 | with 12 108: S1 > S5 > S3 > S4 > S2 > S6, identical to the obesity ranking |
| Secondary: Women ≥65, scenario 6 | Table 6 row "Women aged ≥65 years" | −1549 (−2·5) | −2·5 × 6.26 M = −157 (range −153 to −160); total −1238 minus the other seven cells (−1083) = −155 |
| Secondary: scenario 6 column sum | Table 6 | Total −1238 (−2·0) | cells sum to −2632, outside the UI −2359 to −455; the printed total and rate agree with each other (−1238 ÷ 61.40 M = −2·02) |
Three independent routes (the cell sum, the printed rate times the shared denominator, and the near-constant scenario 5 to scenario 3 ratio) all place the scenario 5 total at about 12 100. Only the printed count disagrees, and it is the one value that duplicates another cell. The same two identities reproduce the Total row of scenarios 1 to 4 exactly or within rounding, so the method does not explain the discrepancy.
Figure
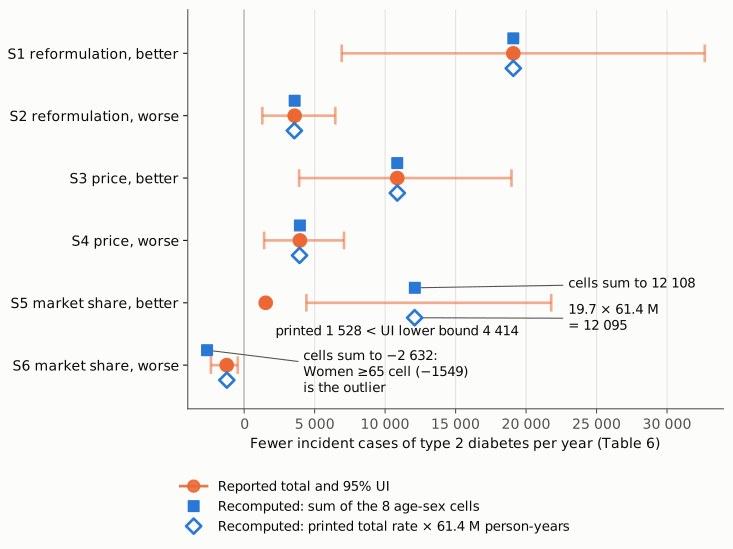
Figure 1. For each of the six scenarios, the orange dot and bar are the total reduction in incident diabetes cases per year and its 95% UI, as printed in the Total row of Table 6. The blue squares are the sum of the eight age-sex cells in the same column. The open blue diamonds are the printed total rate multiplied by the 61.4 million person-years implied by scenario 1. In scenarios 1 to 4 all three values coincide. In scenario 5 both recomputations give about 12 100, inside the UI, while the printed total of 1528 lies below the lower bound of 4414. In scenario 6 the printed total and its rate agree, but the cells sum to −2632, because the Women ≥65 cell (−1549) is about ten times what its own rate implies; this is a separate, smaller inconsistency.
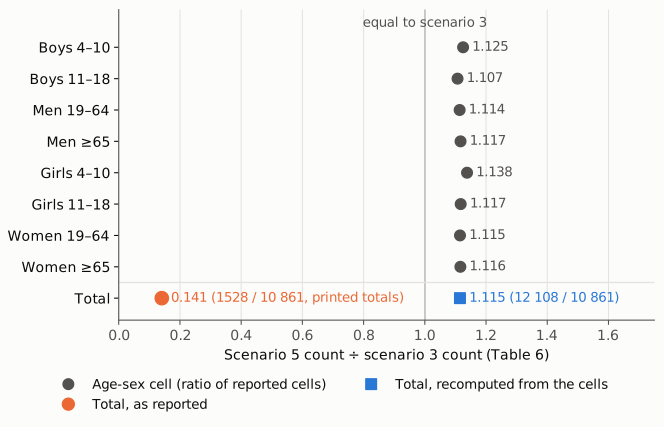
Figure 2. In every age-sex cell of Table 6, scenario 5 averts between 1.107 and 1.138 times as many diabetes cases as scenario 3 (gray dots). The recomputed totals keep that ratio (12 108 / 10 861 = 1.115, blue). The printed totals give 0.141 (1528 / 10 861, orange), a ratio that no cell comes close to. The vertical line marks a ratio of 1, where scenario 5 would equal scenario 3.
Why it matters
The scenario 5 diabetes figure is one of nine headline estimates in the Abstract's Findings (three outcomes for each of three better-case scenarios), and outside Table 6 it is the only place in the paper where the diabetes benefit of a market-share response is stated. As printed it is about 8 times too small. A reader comparing the Abstract's three better-case scenarios would conclude that a shift in market share prevents far fewer diabetes cases than a price rise (1528 vs 10 861), and in Table 6 it would rank fifth of six, below both worse-case reformulation and worse-case price scenarios. The paper's own cells give the opposite order: with about 12 100, scenario 5 is second only to reformulation for diabetes, exactly as for obesity in Table 5. This is what the Results state ("the pattern of results seen with obesity is repeated for type 2 diabetes"; "As with results for obesity and diabetes, the better case for change in market share (scenario 5) and price change (scenario 3) scenarios had the next largest effects respectively"). The printed 1528 contradicts both sentences.
Anyone citing or re-using the Abstract figure in a policy comparison of industry responses, or in a later model that takes this study's scenario results as inputs, would understate the diabetes benefit of increasing the market share of low-sugar drinks by about 10 500 cases per year.
The paper's main conclusions do not depend on this number. Reformulation remains the scenario with the largest benefit, the health impact still depends on how industry responds, and the Interpretation's statement that raising the market share of low-sugar products brings additional benefits is strengthened, not weakened, by the corrected value. The uncertainty interval as printed (4414 to 21 785) appears to belong to the corrected total, so no re-estimation is needed; only the point estimate needs replacing.
Two smaller inconsistencies sit next to this one. In the same Abstract sentence, 91 042 is described as "fewer adults and children with diabetes"; Table 5 and the Results give 91 042 as the reduction in the number of people with obesity. In Table 6, the Women ≥65 cell for scenario 6 reads −1549 (−2·5), but −2·5 per 100 000 on that group's 6.26 million person-years is about −157, and the printed scenario 6 total (−1238) leaves −155 for this cell. Neither changes any conclusion.
Explanations considered
- A different unit or definition for the Total. This does not account for the numbers. The Table 6 footer defines one unit for the whole table (cases per year, with reductions per 100 000 person-years in parentheses), and the totals of scenarios 1 to 4 are plain sums of their cells.
- The Total is for a subpopulation rather than the whole population. This does not account for the numbers. A total of 1528 with a rate of 19·7 would need a denominator of 7.76 million person-years, while scenarios 1 and 3 imply 61.4 million and the Methods say all results were applied to the 2014 UK population. The UI (4414 to 21 785) is also on the whole-population scale.
- A skewed Monte Carlo distribution, so the point estimate can sit outside the interval. This does not account for the numbers. A point estimate can sit off-centre in a simulation interval, but it cannot be below the 2.5th percentile by a factor of almost 3 while also disagreeing with its own cells and its own rate. In every other scenario the printed total is inside its UI, and the scenario 5 UI bounds are 1.13 and 1.15 times those of scenario 3, close to the 1.11 to 1.14 of the cells.
- Rounding. This does not account for the numbers. Rounding of the cells moves the sum by a few cases at most (scenario 4 differs by 1); rounding of the rate gives a range of 12 045 to 12 145.
- A conversion or typesetting error in the PMC copy. This is excluded. The publisher's typeset PDF (deposited as the Published Version in the University of Reading repository) and the Europe PMC full-text XML carry the same values in the Abstract and in Table 6.
- The supplement gives a different total. This does not apply. The appendix has no diabetes results by scenario (see Status), so it neither confirms nor contradicts the printed value.
- 1528 is correct and the cells are wrong. This does not account for the numbers. Seven of the eight cells, the total rate, and the UI would all have to be wrong together, and the cells keep the same ratio to scenario 3 in every age-sex group. The one value that differs is the total, and it equals another cell in the same column.
Status
- Version of record. The PMC-archived text was compared with two other copies: the publisher's typeset PDF (10 pages, CC-BY, deposited as the "Published Version" at centaur.reading.ac.uk/68564) and the Europe PMC full-text XML for PMC5543265. All three carry 1528 (4414–21 785; 19·7) in the Abstract and 1528 (19·7); 4414 to 21 785 in the Table 6 Total row, and the same cell values. The doi.org link, thelancet.com and ScienceDirect refused automated access (redirect stub or HTTP 403). Every quotation above was confirmed verbatim against the PMC-archived text with
src/show.py. Crossref dates the article to the January 2017 issue (volume 2, issue 1, e15–e22). - Supplements. The appendix (mmc1.pdf, 8 pages) describes the modelling and gives supplementary tables 1–3 (price elasticity matrix, baseline SSB consumption, an energy-balance sensitivity analysis for obesity). It has no diabetes results by scenario, so it does not resolve the intended scenario 5 total. Table 6 itself pins it at about 12 100.
- Corrections and comments. As of 2026-10-24 I found no correction, erratum, expression of concern or retraction. Crossref lists no update-to or updated-by relation for the DOI, and a Crossref search for updates to the DOI returned none. PMC and Europe PMC list no correction notices. Crossref links one associated item in the same issue ("The impact of sugared drink taxation and industry response", doi:10.1016/S2468-2667(16)30039-1), an accompanying article, not a correction. A web search for corrections or comments found none. PubPeer refused automated access (HTTP 403 on search, 404 on the API), so it could not be checked directly.
- Sources. PMC article PMC5543265; Europe PMC full-text XML and supplementary files for PMC5543265; publisher PDF at centaur.reading.ac.uk/68564; Crossref records for 10.1016/S2468-2667(16)30037-8 and 10.1016/S2468-2667(16)30039-1.
Suggested correction
- Replace the scenario 5 total in the Table 6 Total row with the model's total for that scenario (the cells give 12 108; the printed rate 19·7 implies 12 045 to 12 145), keeping the rate 19·7 and the UI 4414 to 21 785 if these were produced for that total.
- Make the same change in the Abstract Findings: "about 12 100 (4414–21 785; 19·7) fewer incident cases of diabetes per year" in place of "1528 (4414–21 785; 19·7)".
- In the same Abstract sentence, change "91 042 (4289–204 903; 0·6%) fewer adults and children with diabetes" to "with obesity", to match Table 5 and the Results.
- In Table 6, check the scenario 6 cell for women aged ≥65 years: −1549 (−2·5) is inconsistent with its own rate and with the scenario 6 total; the table's other values imply about −155.