← Back to the plain-language case
Table 1 P values do not follow from its own mouse counts under the stated tests
Nat Commun (2017) · doi:10.1038/ncomms14382 · PMC5309857
Summary
Table 1 reports how many recipient mice were engrafted ("positive") after p190-B−/− LSK-SLAM cells were treated ex vivo: 9 of 16 untreated, 4 of 13 with rTGF-β1, and 13 of 20 with rTGF-β1 plus the p38MAPK inhibitor SB203580. It gives Fisher exact P values of 0.0006 and <0.0001 for the two pairwise comparisons, and a three-group χ² P<0.0001. With these counts, the stated tests give P = 0.264, P = 0.080 and χ² = 3.80 on 2 df (P = 0.149), so none of the three comparisons is significant at 0.05. All three reported values come out exactly if the rounded percentages (56%, 31%, 65%) are entered as counts out of 100 mice, as the footer's phrase "comparing per cent of negative and positive mice" suggests. Supplementary Table 3 shows the same pattern. Table 1 is the main-text in vivo test cited for the claim that rTGF-β1 "significantly reduced" long-term HSC activity through p38MAPK, so as printed that claim has no statistical support from these data.
What the paper reports
Table 1 ("Effect of TGFβ on p190-B−/− HSPC engraftment"). The columns are Chimera>1%, Chimera<1%, Total mice transplanted and P value:
p190-B-/- | 9 | 7 | 16 |
p190-B-/-+rTGFβ1 | 4 | 9 | 13 | 0.0006*
p190-B-/-+rTGFβ1+p38 inhi | 13 | 7 | 20 | < 0.0001†
Table 1
Table shows numbers of mice exhibiting more than 1% contribution to both myeloid and lymphoid lineages in PB (positive mice) and numbers of mice with less than 1% contribution in at least one lineage (negative mice) (2–3 independent experiments). P values were calculated by Fisher exact 2 × 2 contingency table by comparing per cent of negative and positive mice of the following groups: *p190-B-/- vs p190-B-/-+rTGF-β1, and †p190-B-/-+rTGF-β1 vs p190-B-/-+rTGF-β1+ SB203580. Difference between the three groups was analysed by χ2 test, P<0.0001.
Table 1, footer
How the Results use the table:
But, LT-HSC activity of pooled p190-B-/- LSK-SLAM cells cultured with rTGF-β1 was significantly reduced (30% of transplanted mice showing greater than 1% contribution to both myeloid and lymphoid lineages in PB versus 56% from non-treated cultures). This effect was prevented by addition of SB203580 (65% mice were engrafted (Table 1 and Supplementary Table 3).
Hence, rTGF-β1 can alter HSC activity via p38MAPK signalling pathway in vitro.
Results, section "p38MAPK pathway mediates TGF-β effect on HSPC activity"
Here, the authors show using both in vitro assays and in vivo transplantation that loss of the RhoGAP p190-B enhances self-renewal by inhibiting TGFβ/p38 signalling.
Abstract (editor's summary)
The statistics section names only the paired-daughter-cell and single-cell analyses ("In vitro paired daughter cell assay data were analysed by 2 × 2 Fisher exact test contingency table", Methods, Statistical analyses). It does not describe any other analysis of the transplantation counts.
Supplementary Table 3 (fetal-liver LSK-SLAM cells, from the Supplementary Information PDF) reports 8/4 (n = 12) untreated, 2/10 (n = 12) with rTGF-β1, P "<0.0001", and 4/6 (n = 10) with rTGF-β1 plus the p38 inhibitor, P "0.0005". Its footer reads: "P value was calculated by Fisher exact test ... P value by chi square test was < 0.0001 in both sets of transplant."
What the paper's own numbers show
Method. Each comparison named in the footer was set up as a 2 × 2 table of positive and negative mice and analysed with the two-sided Fisher exact test (scipy). As sensitivity checks I also ran the one-sided Fisher test, the χ² test with and without Yates correction, and Barnard's and Boschloo's unconditional exact tests. The three-group comparison is the Pearson χ² test on the 3 × 2 table. For each pairwise comparison I computed the difference in per cent positive with a Newcombe (hybrid Wilson score) 95% CI. To test the footer's wording, I then ran the same tests on the rounded percentages entered as if they were counts out of 100. Supplementary Table 3 was treated the same way. All numbers come from recompute.py.txt.
| Quantity | Location | Reported | Recomputed from the paper's own numbers |
|---|---|---|---|
| Per cent positive, p190-B−/− (9/16) | Table 1; Results | 56% | 56.2% |
| Per cent positive, +rTGF-β1 (4/13) | Table 1; Results | 30% | 30.8% |
| Per cent positive, +rTGF-β1+SB203580 (13/20) | Table 1; Results | 65% | 65.0% |
| Fisher, p190-B−/− vs +rTGF-β1 (9/7 vs 4/9) | Table 1, * | P = 0.0006 | P = 0.264 two-sided (one-sided 0.160; χ² 0.170, Yates 0.319; Barnard 0.184; Boschloo 0.192) |
| Difference in per cent positive, same comparison | derived | — | +25.5 points, 95% CI −9.9 to +52.9 |
| Fisher, +rTGF-β1 vs +rTGF-β1+SB203580 (4/9 vs 13/7) | Table 1, † | P < 0.0001 | P = 0.080 two-sided (one-sided 0.058; χ² 0.055, Yates 0.117; Barnard 0.063; Boschloo 0.069) |
| Difference in per cent positive, same comparison | derived | — | −34.2 points, 95% CI −59.0 to +0.3 |
| Three-group χ², 3 × 2 | Table 1 footer | P < 0.0001 | χ² = 3.80, df 2, P = 0.149 |
| Multiplier of the real counts needed to reach the reported P | derived | — | ×7 (first comparison), ×5 (second) |
| Fisher on % as counts, 56/44 vs 31/69 | diagnostic | 0.0006 | P = 5.8 × 10⁻⁴ (prints as 0.0006) |
| Fisher on % as counts, 31/69 vs 65/35 | diagnostic | < 0.0001 | P = 2.4 × 10⁻⁶ |
| 3 × 2 χ² on % as counts | diagnostic | < 0.0001 | χ² = 24.8, P = 4.1 × 10⁻⁶ |
| Fisher, Supp. Table 3: 8/4 vs 2/10 | Supp. Table 3 | P < 0.0001 | P = 0.036 (on % as counts, 67/33 vs 17/83: 6.2 × 10⁻¹³) |
| Fisher, Supp. Table 3: 2/10 vs 4/6 | Supp. Table 3 | P = 0.0005 | P = 0.348 (on % as counts, 17/83 vs 40/60: 5.06 × 10⁻⁴, prints as 0.0005) |
| 3 × 2 χ², Supp. Table 3 | Supp. Table 3 footer | P < 0.0001 | χ² = 6.20, df 2, P = 0.045 (on % as counts: 6.1 × 10⁻¹²) |
The cells, row totals (9 + 7 = 16, 4 + 9 = 13, 13 + 7 = 20), the percentages in the Results text and the footer all agree with each other. The discrepancy lies only in the P values. Each reported value sits exactly where the stated test lands when the per cent figures are treated as counts out of 100, which treats each group as about 5 to 8 times larger than it was (100 versus 13 to 20 mice). The match is specific. For the first comparison, 4/13 rounds to 31%, and 56/44 vs 31/69 gives 0.00058, which prints as the reported 0.0006. Using the 30% from the Results text instead gives 0.00033.
Figure
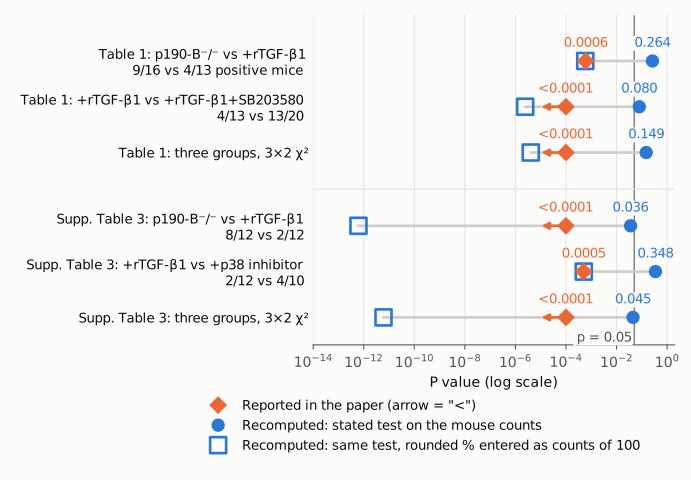
Figure 1. P values on a log scale for the three tests in Table 1 (top) and the three in Supplementary Table 3 (bottom). The thin vertical line marks p = 0.05. Orange diamonds are the values the paper prints; an arrow means the paper gives only an upper bound ("<0.0001"). Filled blue circles are the stated test (two-sided Fisher exact for pairs, Pearson χ² for three groups) applied to the mouse counts printed in the same table. Open blue squares are the same test applied to the rounded per cent positive and negative entered as if each group had 100 mice. In every row the reported value coincides with, or is a correct bound for, the open square, not the filled circle. On the actual counts, all three Table 1 tests are above 0.05.
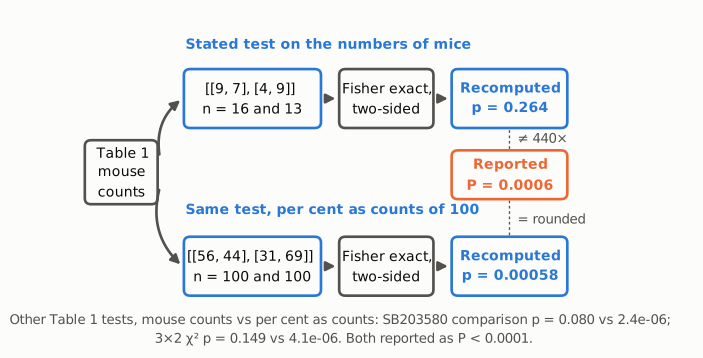
Figure 2. Calculation flow for the first Table 1 comparison (p190-B−/− vs +rTGF-β1). Upper path: the two-sided Fisher exact test on the printed numbers of mice (9 positive / 7 negative vs 4 / 9) gives p = 0.264, which is 440 times the reported P = 0.0006 (orange box). Lower path: the same test on the rounded per cent positive and negative (56 / 44 vs 31 / 69), entered as if each group had 100 mice, gives p = 0.00058, which prints as the reported 0.0006. The line at the bottom gives the same pair of values for the other two Table 1 tests, both printed in the paper as P < 0.0001. Blue marks values recomputed from the paper's own numbers; orange marks the paper's reported value.
Why it matters
Table 1 is the paper's main-text in vivo functional test of the step from TGF-β through p38MAPK to long-term HSC activity. The Results cite it, together with Supplementary Table 3, for the statements that rTGF-β1 "significantly reduced" LT-HSC activity, that the effect "was prevented by addition of SB203580", and hence that "rTGF-β1 can alter HSC activity via p38MAPK signalling pathway". The editor's summary relies on "in vivo transplantation" for the TGFβ/p38 conclusion.
On the printed counts, neither pairwise comparison in Table 1 is significant, and the three-group test gives P = 0.149. The intervals show how little the data pin down. The rTGF-β1 reduction (+25.5 percentage points) is compatible with anything from a 10-point increase to a 53-point decrease, and the SB203580 rescue (−34.2 points) has an upper CI limit just above zero. The direction of the effects (56% → 31% → 65%) is as described. What the table does not support is the statement that the differences are significant, let alone at P ≤ 0.0006.
Supplementary Table 3 does not supply the missing support at the stated level. Its rTGF-β1 effect is nominally significant on the counts (Fisher P = 0.036, against the printed <0.0001), its p38-inhibitor rescue is not (P = 0.348, against the printed 0.0005), and its three-group χ² gives P = 0.045 (printed <0.0001). Pooling the two tables, which the paper does not describe, gives P = 0.012, 0.027 and a three-group P = 0.014. These values are shown for scale only and are not a reanalysis the paper reports.
The abstract itself does not quote these P values, and the paper's p190-B/TGF-β/p38 conclusions also rest on other experiments (paired-daughter-cell assays, p-p38MAPK and bioactive TGF-β measurements, and TGFBRI-inhibitor experiments). The same wording, "comparing per cent", appears in the Fisher-test legends of Figures 3, 7 and 9. I have not checked whether those tests have the same problem.
Explanations considered
- One-sided test. The footer does not say whether the tests were one- or two-sided. One-sided Fisher P values are 0.160 and 0.058, still far from 0.0006 and <0.0001. This does not account for the numbers.
- A different 2 × 2 test. Uncorrected χ², Yates-corrected χ², Barnard's and Boschloo's tests give P between 0.055 and 0.32 for the two Table 1 comparisons. This does not account for the numbers.
- Different or pooled data. The footer ties the P values to the Table 1 groups, and the Results percentages (56%, 30%, 65%) match the Table 1 counts. Supplementary Table 3 is a separate fetal-liver experiment with its own P values. Pooling it with Table 1 gives P = 0.012 and 0.027, nowhere near the reported values. Reaching the reported P values from these proportions would need each count multiplied by about 5 to 7. This does not account for the numbers.
- Misaligned cells, lost symbols or conversion errors. The PMC archive, the Europe PMC full text and the publisher's Table 1 page carry the same cells, totals, P values and footer. The row totals add up. The P values are plain decimals with no lost minus signs, superscripts or exponents. This does not account for the numbers.
- Correction already published. None was found (see Status).
- Test run on percentages rather than counts. The footer says the test compared "per cent of negative and positive mice". Entering the rounded percentages as counts out of 100 reproduces all three Table 1 values (5.8 × 10⁻⁴, 2.4 × 10⁻⁶, 4.1 × 10⁻⁶) and both numeric Supplementary Table 3 values (0.0005, and 6.2 × 10⁻¹³ under "<0.0001"). This very likely explains how the printed numbers arose. It does not make them valid: a Fisher or χ² test on percentages treats each group as 100 independent mice instead of the 10 to 20 actually transplanted, so it overstates the evidence. It explains the reported values but does not support them.
Status
As of 2026-10-23:
- Version of record. The publisher's Table 1 page (nature.com/articles/ncomms14382/tables/1, fetched 2026-10-23) shows the same counts, P values (0.0006*, < 0.0001†) and footer text as the PMC archive. The main article page carries the same Results sentence. The discrepancy is in the published text.
- Supplements. The Supplementary Information PDF (11 pages, from static-content.springer.com) was read. Supplementary Table 3 is a separate fetal-liver experiment, and it shows the same pattern as Table 1 (see above). Supplementary Data 1 and 2 are gene-expression lists and not relevant.
- Corrections and notices. Crossref has no
update-to,updated-byorrelationentries for the DOI. Neither PMC nor Europe PMC (PMID 28176763) lists a correction, retraction or expression of concern. The publisher's article page links to no correction. - PubPeer. A web search for the title and DOI found no PubPeer thread. The PubPeer API returned HTTP 403, so no direct query of its database was possible.
- Sources: PMC5309857 (Table 1, Results, Methods, editor's summary); https://www.nature.com/articles/ncomms14382 and its Table 1 page; Supplementary Information PDF (41467_2017_BFncomms14382_MOESM1632_ESM.pdf); api.crossref.org/works/10.1038/ncomms14382; Europe PMC REST search for DOI:10.1038/ncomms14382.
Suggested correction
Recompute the Table 1 P values on the numbers of mice (9/7, 4/9 and 13/7) rather than on percentages. With two-sided Fisher exact tests this gives P = 0.26 for p190-B−/− vs +rTGF-β1 and P = 0.080 for +rTGF-β1 vs +rTGF-β1+SB203580, and the three-group χ² gives χ² = 3.80, df 2, P = 0.15. Replace the footer's "comparing per cent of negative and positive mice" with "comparing numbers of negative and positive mice". Recompute Supplementary Table 3 the same way (P = 0.036, 0.35 and χ² P = 0.045). Revise the Results sentence "was significantly reduced" and the inference that the effect was "prevented" by SB203580 to match the recomputed values, for example by reporting the observed proportions with confidence intervals. The other Fisher tests whose legends use "per cent" (Figures 3, 7 and 9) should be checked to confirm they were run on counts.