← Back to the plain-language case
Abstract labels the age-and-sex adjusted all-cancer hazard ratio as the multivariable adjusted estimate
BMJ (2017) · doi:10.1136/bmj.j108 · PMC5266623
Summary
The abstract and the Discussion give the hazard ratio for death from all cancers combined, for the most distressed group (GHQ-12 score 7-12) against the least distressed (0-6), as "multivariable adjusted hazard ratio 1.32, 95% confidence interval 1.18 to 1.48". In the paper's own Table 5, 1.32 (1.18 to 1.48) is the age and sex adjusted estimate (4353 deaths, n=163 363), and the Results text and Figures 2 and 3 describe it the same way. The multivariable estimate in Table 5 is 1.26 (1.11 to 1.42) (3800 deaths, n=146 008). The other six hazard ratios in the same abstract sentence all equal Table 5 multivariable rows exactly, so only the all-cancer figure comes from the other row. The association stays positive and statistically significant, but the fully adjusted excess risk is 26% rather than 32%. The abstract does not show that adjustment lowered the all-cancer estimate, and the Discussion uses the mislabelled figure to call an earlier meta-analysis estimate "of markedly lower magnitude".
What the paper reports
Abstract, Results. The all-cancer estimate is the first of seven, all under one "After adjustment for ..." clause:
After adjustment for age, sex, education, socioeconomic status, body mass index (BMI), and smoking and alcohol intake, and with reverse causality (by left censoring) and missing data (by imputation) taken into account, relative to people in the least distressed group (GHQ-12 score 0-6), death rates in the most distressed group (score 7-12) were consistently raised for cancer of all sites combined (multivariable adjusted hazard ratio 1.32, 95% confidence interval 1.18 to 1.48) and cancers not related to smoking (1.45, 1.23 to 1.71), as well as carcinoma of the colorectum (1.84, 1.21 to 2.78), prostate (2.42, 1.29 to 4.54), pancreas (2.76, 1.47 to 5.19), oesophagus (2.59, 1.34 to 5.00), and for leukaemia (3.86, 1.42 to 10.5).
Discussion, "Comparison with other studies":
the aggregated result for depression and cancer for all malignancies across the 13 studies included unity (relative risk 1.12, 95% confidence interval 0.99 to 1.26). This was of markedly lower magnitude than our estimate between psychological distress and overall cancer (multivariable adjusted hazard ratio 1.32, 95% confidence interval 1.18 to 1.48).
Results, paragraph beginning "During a mean (SD) follow-up":
In the 16 studies in aggregate, after adjustment for age and sex, higher levels of distress were associated with a 32% greater risk of total cancer mortality (hazard ratio 1.32, 95% confidence interval 1.18 to 1.48).
Table 5, "All cancers". The columns are deaths, number of people, distress score 0, 1-3, 4-6 and 7-12, P value for trend, and distress score 7-12 v 0-6:
Age and sex | 4353 | 163 363 | 1 (ref) | 0.99 (0.92 to 1.08) | 1.05 (0.91 to 1.20) | 1.31 (1.16 to 1.49) | <0.001 | 1.32 (1.18 to 1.48)
Multivariable† | 3800 | 146 008 | 1 | 0.95 (0.88 to 1.03) | 0.93 (0.78 to 1.10) | 1.22 (1.07 to 1.38) | 0.04 | 1.26 (1.11 to 1.42)
Table 5 footnote:
†Hazard ratio adjusted for age, sex (except in single sex analyses), BMI, educational attainment, smoking status, and frequency of alcohol consumption.
Methods, "Statistical analyses", which defines the two models:
Hazard ratios were minimally adjusted (age and sex only) and maximally adjusted (age, sex, BMI, educational attainment, smoking status, and frequency of alcohol consumption).
Figure 3 legend. In the typeset figure, the "All cancers combined" row reads 1.32 (1.18 to 1.48) under "adjusted for age and sex" and 1.26 (1.11 to 1.42) under "multivariable adjusted":
Hazard ratios are for psychological distress score of 7-12 (most distressed) relative to 0-6, and are age and—except in single sex analyses—sex adjusted (I2=15%), or multivariable adjusted (age, sex, BMI, educational attainment, smoking status, and alcohol consumption; I2=37%)
Figure 2 legend. The pooled "Overall" row of this forest plot is 4353 deaths, 1.32 (1.18 to 1.48):
Hazard ratios (adjusted for age and sex) are for psychological distress score of 7-12 (most distressed) relative to 0-6.
What the paper's own numbers show
Method. I copied the seven hazard ratios and 95% CIs from the abstract's Results sentence. For the same seven outcomes I copied both Table 5 rows, age (and sex) and multivariable, from the column "Distress score (7-12 v 0-6)". I then checked which row each abstract value equals, digit for digit. To show that the two all-cancer rows are separate estimates and not rounding variants of one number, I computed the geometric (log-scale) midpoint of each CI and the standard error of the log hazard ratio, (ln upper − ln lower)/(2 × 1.96). Finally, I repeated the Discussion's comparison with the earlier meta-analysis for each all-cancer estimate. That comparison is a z test on the difference of log ratios, treating the two estimates as independent. It is illustrative only: one estimate is a hazard ratio for distress and death, the other a relative risk for major depression and cancer occurrence. Every number below is printed by recompute.py.txt.
| Quantity | Location | Reported | Recomputed from the paper's numbers |
|---|---|---|---|
| All cancers, labelled "multivariable adjusted" | Abstract, Results | 1.32 (1.18 to 1.48) | Equals the Table 5 age and sex row in all three numbers. The Table 5 multivariable row is 1.26 (1.11 to 1.42) |
| All cancers, labelled "multivariable adjusted" | Discussion, "Comparison with other studies" | 1.32 (1.18 to 1.48) | Same as above |
| All cancers, labelled "after adjustment for age and sex" | Results text | 1.32 (1.18 to 1.48) | Equals the Table 5 age and sex row |
| All cancers, age and sex | Table 5 | 1.32 (1.18 to 1.48); 4353 deaths; n=163 363; P for trend <0.001 | CI log-midpoint 1.322; SE(log HR) 0.0578; z = 4.80 |
| All cancers, multivariable | Table 5 | 1.26 (1.11 to 1.42); 3800 deaths; n=146 008; P for trend 0.04 | CI log-midpoint 1.255; SE(log HR) 0.0628; z = 3.68 |
| Other six abstract hazard ratios (not related to smoking, colorectum, prostate, pancreas, oesophagus, leukaemia) | Abstract vs Table 5 | 1.45, 1.84, 2.42, 2.76, 2.59, 3.86, each with its CI | 6 of 6 equal the Table 5 multivariable rows exactly. None equals the age and sex rows (1.38, 1.75, 2.29, 2.52, 2.42, 2.89) |
| Effect of adjustment | Table 5 | — | All cancers: 1.32 → 1.26 (down). The other six outcomes: all go up (for example leukaemia 2.89 → 3.86) |
| Excess all-cancer mortality, most v least distressed | Abstract (implied) vs Table 5 multivariable | 32% | 26%. The reported excess is 1.23 times the multivariable excess, and the multivariable excess is 19% smaller |
| Comparison with the earlier meta-analysis, RR 1.12 (0.99 to 1.26) | Discussion | 1.32 / 1.12 = 1.18; excess 32% v 12% | With 1.32: z = 1.95, P = 0.052. With 1.26: ratio 1.13, excess 26% v 12%, z = 1.34, P = 0.18 |
The two all-cancer estimates are each internally consistent: each printed hazard ratio sits at the log-midpoint of its own CI. They also come from different samples, with 553 deaths and 17 355 people fewer in the multivariable model. The paper states the reason. Results, paragraph beginning "Table 5 shows the four categories":
With different models being based on different analytical samples because of missing covariates, we recomputed these effects estimates in a non-missing dataset—that is, the same sample size in both models—and our results were unchanged.
So the paper attributes the different sample sizes to missing covariates, and it reports that re-estimating both models in the same (non-missing) sample left the results "unchanged". It gives no figures for that analysis, so the share of the 1.32 v 1.26 gap due to the extra covariates rather than the change of sample cannot be read from the paper.
Figure
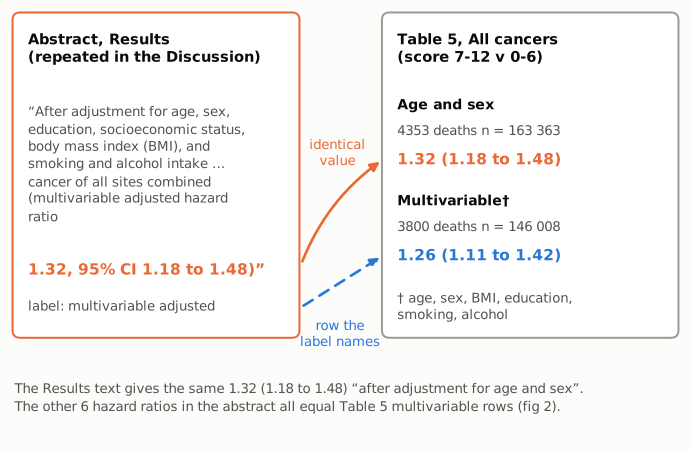
Figure 1. Where the all-cancer estimate appears in the paper. Left: the abstract's wording, shortened at the ellipsis; the Discussion uses the same label and numbers. The estimate is in orange. Right: the two Table 5 rows for all cancers with their deaths and sample sizes. The solid orange arrow joins the abstract value to the Table 5 row that prints the identical numbers, which is the age and sex row. The dashed blue arrow joins the abstract's label, "multivariable adjusted", to the row that label names, which prints a different estimate, 1.26 (1.11 to 1.42). The quoted text and numbers are from the paper; the arrows and annotations are mine.
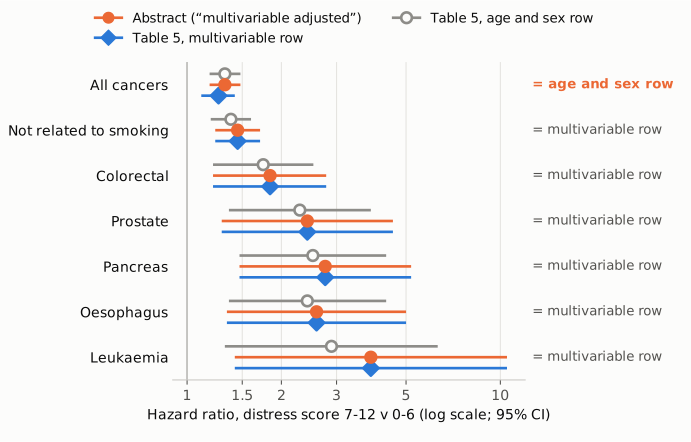
Figure 2. The seven hazard ratios (95% CI, log scale) in the abstract's Results sentence (orange filled circles), shown with the Table 5 multivariable estimate (blue diamonds) and the Table 5 age and sex estimate (open gray circles) for the same outcome. The thin vertical line marks a hazard ratio of 1. The label on the right of each row says which Table 5 row the abstract value equals. For the six site-specific or subgroup outcomes it is the multivariable row. For all cancers combined it is the age and sex row. All plotted values are from the paper's abstract and Table 5 as printed.
Why it matters
- The abstract gives the wrong model for its first and broadest estimate. The sentence says the all-cancer hazard ratio is adjusted for education, socioeconomic status, BMI, smoking and alcohol. Table 5 shows it is adjusted for age and sex only. A reader of the abstract alone gets a fully adjusted excess risk of 32% where the paper's multivariable model gives 26%, and a CI of 1.18 to 1.48 in place of 1.11 to 1.42. The abstract is also the text reproduced in PubMed and in secondary coverage.
- It hides the direction in which adjustment moved this estimate. Because every abstract value is presented as multivariable, a reader cannot tell that, for all cancers combined, adding covariates lowered the estimate from 1.32 to 1.26 and the P for trend from <0.001 to 0.04. For the other six outcomes in the sentence, the multivariable estimates are higher than the age and sex ones. So all cancers is the one outcome in the sentence where adjustment lowered the estimate, and it is the one where the age and sex value is shown. This matters for a reader weighing confounding by health behaviours, which the paper discusses.
- The Discussion uses the figure in an argument. The Discussion calls the earlier meta-analysis estimate, RR 1.12 (0.99 to 1.26), "of markedly lower magnitude" than "our estimate ... (multivariable adjusted hazard ratio 1.32 ...)". Against 1.32 the ratio is 1.18 and a simple test of the difference gives z = 1.95 (P = 0.052). Against the multivariable 1.26 the ratio is 1.13, with z = 1.34 (P = 0.18), and the two CIs overlap from 1.11 to 1.26. The contrast the Discussion draws is weaker than stated.
- Scope. The all-cancer association keeps its direction and its statistical significance: 1.26 (1.11 to 1.42) still excludes 1. The title, the abstract's Conclusion and the Discussion's "Principal findings" concern site-specific cancers, and the abstract reports those correctly. The error is a mislabelled headline estimate. It does not reach the paper's central site-specific findings.
Explanations considered
- The 1.32 comes from another multivariable analysis, such as the imputed-data or left-censored sensitivity analyses the abstract mentions. This does not account for the numbers. Those analyses are in the web appendices (appendix 1 table C; appendix 2 fig A), which are not deposited in PMC or Europe PMC and which I could not inspect. Four things in the paper argue against it. (a) The other six estimates in the same sentence, under the same "left censoring ... imputation" wording, equal the non-imputed Table 5 multivariable rows exactly. (b) The Results say the imputed meta-analysis "gave similar results to those seen with the non-missing dataset as reported in the present paper", which identifies the reported estimates as the non-imputed ones. (c) The Results say that in the left-censored analysis "most of the associations between distress and cancer were largely unaffected (fig A in appendix 2)", which presents it as a check rather than the source of the headline figure. (d) 1.32 (1.18 to 1.48) matches the Table 5 age and sex row in all three numbers, and the Results text and Figures 2 and 3 label it age and sex adjusted. Another model reproducing all three numbers to two decimals would be a coincidence. A related point: the abstract says all seven estimates take left censoring and imputation into account, but the Table 5 footnote, which defines the rows six of them come from, lists covariates only.
- A model with additional covariates (appendix 1 table B). I could not inspect that table. The Results say only that, in this analysis, "The strength of the relation between distress and total cancer was little changed", and give no figure for it. The abstract's covariate list is close to the main model (Table 5 footnote, Methods, Figure 3 legend) but not identical: the abstract names "socioeconomic status" as well as education, while those three places list educational attainment only. The Results describe the main model's covariates as including "socioeconomic position (education)", so the abstract's "socioeconomic status" corresponds to education in the main model. Table B's extra covariates do include one socioeconomic measure, area based deprivation, but the abstract does not mention the other three (physical activity, C reactive protein, quantity of alcohol consumed), and the six other estimates in the same sentence equal the main-model rows of Table 5.
- The same-sample re-analysis reported in the Results. The paper says it "recomputed these effects estimates in a non-missing dataset—that is, the same sample size in both models—and our results were unchanged". This does not account for 1.32 being labelled multivariable. In that analysis the multivariable model is fitted to the complete-case sample, and the multivariable estimate in the complete-case sample is the 1.26 (1.11 to 1.42) already shown in Table 5 (3800 deaths, n=146 008). Refitting in the complete-case sample changes the age and sex estimate, not the multivariable one, so the re-analysis gives no route by which the multivariable estimate becomes 1.32 (1.18 to 1.48), the numbers of the full-sample age and sex row.
- Rounding, or two presentations of one estimate. Ruled out. The two CIs have log-scale midpoints of 1.322 and 1.255, each matching its own printed hazard ratio, and they come from different samples (4353 deaths in 163 363 people v 3800 deaths in 146 008).
- The error is in Table 5, not in the abstract. Not supported. The Table 5 all-cancer rows agree with the Results text, with Figure 2 (pooled age and sex estimate 1.32 (1.18 to 1.48), 4353 deaths) and with Figure 3 (1.32 under age and sex, 1.26 under multivariable).
- An artefact of the PMC text conversion. Ruled out. The same abstract and Discussion wording and the same Table 5 cells appear in the publisher's typeset PDF (see Status). No minus signs, superscripts or special decimal marks are involved.
Status
- Version of record. I checked the PMC archived text (PMC5266623, via
src/show.py) and the publisher's typeset PDF ("the bmj | BMJ 2017;356:j108", 11 pages, created 19 January 2017), held in the UCL Discovery repository (eprint 1537638). Their abstract and Discussion wording and their Table 5 cells are identical. Text extracted from the PDF's Figure 2 and Figure 3 gives the values described above. Every quotation in this write-up was confirmed verbatim against the PMC text. The live bmj.com page returned HTTP 403 to automated access in an earlier check in this pipeline, which also found the same abstract sentence in Europe PMC full text and in PubMed (PMID 28122812). - Supplements. The web appendices (appendix 1 tables A-D; appendix 2 fig A) are not deposited in PMC or Europe PMC, and bmj.com was not reachable, so they were not inspected. The Europe PMC supplementary bundle holds only the four main figures.
- Corrections. As of 2026-10-23, I found no correction, erratum, retraction or expression of concern. Crossref shows no
update-to/updated-byrelation for 10.1136/bmj.j108, and a Crossref query for works updating this DOI returns 0 results.src/known.pylists no Crossref, PMC or Europe PMC notices. Europe PMC's comment/correction list for PMID 28122812 has two "Comment in" entries (Cancer 2017;123(13):2389 and MMW Fortschr Med 2017;159(15):38) and no correction. An earlier web search in this pipeline found no erratum. I could not repeat the web search in this session because the search budget was used up. - PubPeer. The PubPeer publications API, queried for this DOI on 2026-10-23, returned no feedback (
"feedbacks":[]). - Separate minor observation (not part of this finding). For liver cancer, the multivariable estimate is printed as 4.24 (0.66 to 27.0) in Table 5 but as 4.24 (0.66 to 8.52) in the Figure 3 text of the typeset PDF. The log-midpoint of 0.66 to 27.0 is 4.22, consistent with 4.24. The log-midpoint of 0.66 to 8.52 is 2.37, which is not. 8.52 is the upper limit of the liver age and sex CI.
Suggested correction
- In the abstract's Results, replace "cancer of all sites combined (multivariable adjusted hazard ratio 1.32, 95% confidence interval 1.18 to 1.48)" with "cancer of all sites combined (multivariable adjusted hazard ratio 1.26, 95% confidence interval 1.11 to 1.42)". Alternatively, keep 1.32 (1.18 to 1.48) and label it "age and sex adjusted", which would also need the sentence's opening clause to be reworded.
- Make the same change in the Discussion, "Comparison with other studies", and reconsider describing the earlier meta-analysis estimate, 1.12 (0.99 to 1.26), as "of markedly lower magnitude".
- Clarify in the abstract whether the reported estimates are from the main (complete-case, not left-censored) analysis, as Table 5 and the Results indicate, rather than "with reverse causality (by left censoring) and missing data (by imputation) taken into account".
- Separately, reconcile the liver multivariable upper confidence limit in Figure 3 (8.52) with Table 5 (27.0).