← Back to the plain-language case
Right anterior insula odds ratio of 0.96 lies outside its own reported 95% CI (0.01–0.75)
JAMA Psychiatry (2015) · doi:10.1001/jamapsychiatry.2014.1604 · PMC5103694
Summary
The paper's main predictive result, given in the abstract and in the Results, is that right anterior insula (AI) volume predicted a diagnosis of major depressive disorder (MDD) after imaging, with "odds ratio, 0.96; 95% CI, 0.01–0.75; P = .03". The point estimate 0.96 lies above the upper bound of its own 95% CI, which is impossible for any standard interval. The CI and the P value agree with each other: on the log-odds scale the CI is centred on an OR of about 0.087 (0.061–0.106 when the printed bounds are allowed to vary within their rounding), and that implies a Wald P of 0.026, which matches the reported .03. An OR of 0.96 with the same standard error would give P ≈ 0.97. The direction and statistical significance of the finding therefore stand, but the printed effect size understates the association the paper's own CI and P value imply, roughly a 91% rather than a 4% lower odds of later MDD per unit of whole-brain-adjusted volume.
What the paper reports
The abstract:
"When covarying for children’s lifetime history of MDD episodes, their experience of pathological guilt during preschool, as well as their sex and age at the time of imaging, schoolchildren’s right-side AI volume was a significant predictor of being diagnosed as having an MDD episode after imaging (odds ratio, 0.96; 95% CI, 0.01–0.75; P = .03)." (Abstract, Results)
The same model in the Results, together with the other estimates printed in the same paragraph:
"Children with an MDD diagnosis up to the time of imaging were approximately 11 times as likely as same-age peers without a prior diagnosis of MDD to have an MDD diagnosis after their imaging (odds ratio [OR], 11.38; 95% CI, 2.88–44.94; P < .01). However, even when including the robust effect of MDD up to the time of imaging, as well as children’s age, sex, and PO guilt symptoms (OR, 0.86; 95% CI, 0.28–2.65; P = .79), children with larger right-side AI volumes were significantly less likely to be diagnosed as having full MDD after their imaging (diagnosed on average 14 months after the imaging date [OR, 0.96; 95% CI, 0.01–0.75; P = .03]) (Figure 3). Left-side AI volume was not significantly associated with children’s MDD diagnosis after the time of imaging (OR, 2.70; 95% CI, 0.24–29.88; P = .42)." (Results, "Do AI Volumes Predict a Subsequent Depression Diagnosis?", para 1)
"Results indicated that smaller right AI volume remained a significant predictor (OR, 0.12; 95% CI, 0.01–0.99; P = .04) of DSM-5 MDD diagnosis after imaging when covarying for MDD from baseline up until the time of imaging, age, sex, PO guilt, and children’s stressful or traumatic life events." (Results, same paragraph, follow-up model with life-event covariates)
The model and the predictor scale:
"Binary logistic regression analysis was used to test whether schoolchildren’s right or left AI volume predicted the likelihood of being diagnosed as having MDD any time after their imaging." (Methods, Statistical Analysis, "AI Volume as a Predictor of Full MDD After Imaging")
"AI volumes were adjusted by the total segmented whole-brain volume (structure divided by whole-brain volume, times 1000) before all analyses." (Methods, "Magnetic Resonance Imaging Acquisition and AI Volume Analysis", para 2)
"Fourth was MDD diagnosed after the time of imaging (yes or no) (MDD after imaging variable [n = 24]). This variable is used as the dependent variable in the final analysis." (Methods, Measures, "DSM Psychiatric Diagnoses")
What the paper's own numbers show
Method. A logistic-regression Wald interval is symmetric on the log-odds scale. From a printed OR, lower bound L and upper bound U, the estimate implied by the interval is the geometric midpoint exp((ln L + ln U)/2), the standard error is SE = (ln U − ln L)/(2 × 1.96), and the two-sided P value is 2Φ(−|ln OR|/SE). This was applied to all five estimates in the Results paragraph. For the right AI estimate the printed bounds were also varied over every value that rounds to them (0.005–0.015 and 0.745–0.755). Every number below is printed by recompute.py.txt.
| Quantity | Location | Reported | Recomputed |
|---|---|---|---|
| Right AI OR, main model: is the OR inside its CI? | Abstract; Results para 1 | OR 0.96; 95% CI 0.01–0.75 | No: 0.96 > 0.75 |
| Right AI, OR implied by the printed CI | derived from Abstract / Results | 0.96 | 0.087 (0.061–0.106 allowing for rounding of the bounds) |
| Right AI, SE(log OR) implied by the CI | derived | — | 1.10 (1.00–1.28 allowing for rounding) |
| Right AI, P implied by the CI | Abstract; Results para 1 | P = .03 | 0.026 (z = −2.22; 0.024–0.029 allowing for rounding) |
| Right AI, P that OR 0.96 would have at that SE | derived | P = .03 | 0.97 (0.967–0.975) |
| Right AI, 95% CI that OR 0.96 would need for P = .03 | derived | 0.01–0.75 | 0.925–0.996 (SE 0.019) |
| Prior MDD | Results para 1 | OR 11.38; 2.88–44.94; P < .01 | midpoint 11.377; P = 0.001 (consistent) |
| PO guilt | Results para 1 | OR 0.86; 0.28–2.65; P = .79 | midpoint 0.861; P = 0.795 (consistent) |
| Left AI volume | Results para 1 | OR 2.70; 0.24–29.88; P = .42 | midpoint 2.678; P = 0.423 (consistent) |
| Right AI, + life-event covariates | Results para 1 | OR 0.12; 0.01–0.99; P = .04 | midpoint 0.099 (0.070–0.122 allowing for rounding); P = 0.048–0.050 (OR inside its CI; P close) |
In the four other estimates the printed OR sits at the log-midpoint of its CI to within rounding: for prior MDD, for example, ln(OR) − ln(L) = 1.374 and ln(U) − ln(OR) = 1.373. Only the right AI main-model estimate departs from this pattern: ln(0.96) − ln(0.01) = 4.564, while ln(0.75) − ln(0.96) = −0.247. The CI implies an SE of 1.10, close to the left AI estimate's 1.23 and the follow-up model's 1.17, so the interval's width is in line with the other volume estimates from the same 24 events. It looks asymmetric only because the printed OR lies outside it.
Figure
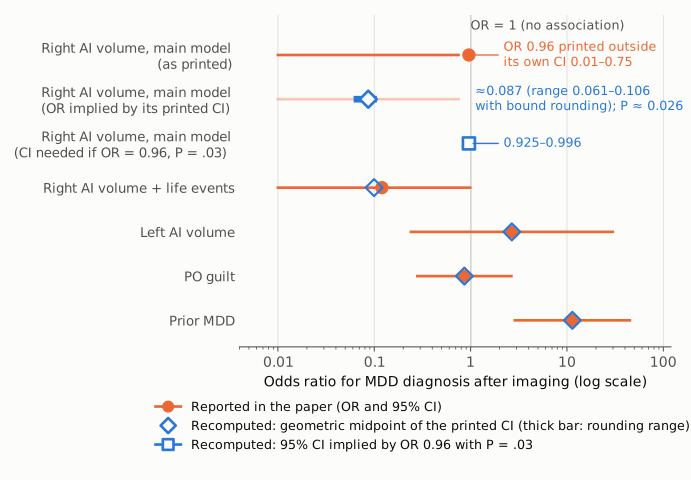
Figure 1. Each row is one estimate from the Results paragraph on MDD after imaging, on a single log-scale odds-ratio axis, with the thin vertical line at OR = 1. Orange circles and lines are the ORs and 95% CIs as printed in the paper. Open blue diamonds mark the geometric midpoint of each printed CI; for the bottom four estimates they coincide with, or sit close to, the printed OR. The top row is the right AI main-model estimate as printed: the OR (0.96) is to the right of its own interval (0.01–0.75). The second row shows the estimate implied by that interval, 0.087 (blue diamond; the printed CI is shown faded); the short thick blue bar spans 0.061–0.106, the values obtained when the printed bounds vary within their rounding. The third row shows the 95% CI (0.925–0.996, an open blue square with a short line hidden mostly behind it) that an OR of 0.96 would need in order to have P = .03. All recomputed values come from recompute.py.txt.
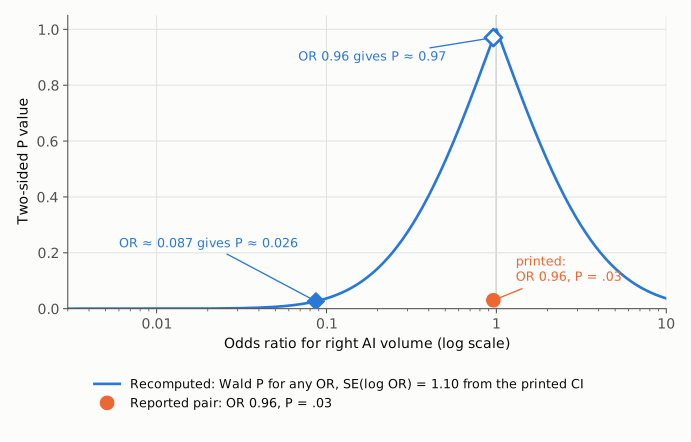
Figure 2. The blue curve gives the two-sided Wald P value for any right AI odds ratio, at the standard error (SE of log OR = 1.10) implied by the printed CI of 0.01–0.75. The reported P = .03 falls on the curve at OR ≈ 0.087 (filled blue diamond, P ≈ 0.026). At the printed OR of 0.96 the curve gives P ≈ 0.97 (open blue diamond). The orange circle marks the reported pair (OR 0.96, P = .03), which lies far off the curve: the printed CI and P are consistent with each other, and the printed OR is not consistent with either.
Why it matters
The right AI result is the third aim of the study (the Objectives ask "whether AI volumes predict subsequent likelihood of having an episode of MDD") and the only predictive result reported in the abstract. The Discussion builds on it: it says that "right-side AI volume was a significant and robust predictor of DSM-5 MDD diagnosis after imaging", that "these study findings provide evidence for the first structural brain biomarker to date of risk for recurrent depression in childhood", and that reduced AI volume "served as a statistically significant biomarker of later depression recurrence".
The direction and significance of the association are not affected. The printed CI excludes 1, the printed P is .03, the two agree, and the follow-up model with life-event covariates (OR 0.12; 0.01–0.99; P = .04) points the same way. What is wrong is the effect size, and the difference is large. Read at face value, 0.96 describes a 4% reduction in the odds of later MDD per unit of whole-brain-adjusted AI volume (structure ÷ whole-brain volume × 1000), and an estimate that close to 1 could not reach P = .03 with an interval this wide. The interval and P value instead imply an OR near 0.09, a 91% reduction per unit, though one that is very imprecisely estimated: the printed CI spans a 75-fold range and the outcome has 24 events. A reader who uses the printed OR would conclude that the predictive effect is negligible, or would find the result self-contradictory. The correct point estimate cannot be read from the paper; only the authors' regression output can supply it. Studies that pool or cite this estimate would carry the error forward.
Explanations considered
Typesetting or archiving artifact. Ruled out. The same "0.96; 95% CI, 0.01–0.75; P = .03" appears in the abstract and in the Results of the PMC author manuscript and of the version of record on jamanetwork.com. The number sits in running prose, so a lost minus sign, a misread mid-dot or a shifted table cell cannot explain it.
Different scale or units for the predictor. Ruled out. Rescaling AI volume (per unit vs per SD, or a different multiplier on the whole-brain adjustment) changes the OR and both CI bounds together. It cannot place the estimate outside its own interval.
A different model behind the OR than behind the CI. Not supported. The Methods describe a single binary logistic regression with age, sex, prior MDD, PO symptoms and AI volume, and the abstract and the Results attach the same OR, CI and P to the same covariate set.
Rounding. Ruled out. Allowing each printed bound to take any value that rounds to it moves the implied OR only between 0.061 and 0.106.
Profile-likelihood or other asymmetric interval. Ruled out as an explanation for an estimate outside the interval. Such intervals can sit off-centre around the estimate, but they always contain it. The other four estimates in the paragraph are also almost exactly log-symmetric around their printed ORs, which indicates Wald-type intervals.
One-sided test. Not relevant. A one-sided P value would change the P value but not whether the estimate lies inside its own CI.
A dropped digit (e.g. 0.096 printed as 0.96). Possible but unverified. 0.096 lies within the rounding range of the CI's midpoint (0.061–0.106) and gives P = 0.033 at the implied SE. The paper offers no way to confirm the exact value.
The claim that the CI is "implausibly wide". Not an independent error. The implied SE of 1.10 on the log scale is similar to the left AI estimate's (1.23) and the follow-up model's (1.17). This width is plausible for a continuous predictor with 24 events.
Side observations, not part of this finding. In the follow-up model the printed OR (0.12) lies inside its CI and close to the midpoint (0.099); the CI implies P ≈ 0.049 against a printed .04, a small difference that could reflect a different test statistic. Separately, the Table's group-comparison column prints several "OR" values with negative CI bounds (for example "OR, -0.71; 95% CI, -1.10 to 0.37" for female sex), which looks like a labelling or scale issue in that column. Neither affects the result above.
Status
As of 2026-10-23:
- Version of record. The jamanetwork.com full text (https://jamanetwork.com/journals/jamapsychiatry/fullarticle/1935483, reached through the DOI) was fetched on 2026-10-23. It prints "(odds ratio, 0.96; 95% CI, 0.01-0.75; P = .03)" in the abstract and "[OR, 0.96; 95% CI, 0.01-0.75; P = .03]" in the Results. An earlier audit stage found the neighbouring estimates (11.38, 0.86, 2.70 and 0.12, with their CIs and P values) identical to the PMC copy. The PMC copy (PMC5103694) is the NIH author manuscript and carries the same numbers.
- Supplements. The article has one supplement (eFigures 1–2 and eTables 1–2). According to the publisher's listing, it covers the imaging schedule, subgroup AI volume comparisons, subgroup characteristics and covariate effects on AI volume. None of these is described as holding the logistic regression of MDD after imaging, and direct downloads of the PDF from the publisher and from PMC did not return the file. No source data or analysis code is available.
- Corrections.
src/known.py(Crossref updates, PMC notices, Europe PMC notices) returned none. A Crossreffilter=updates:query for the DOI returned 0 results on 2026-10-23, and the Europe PMC record has no comment/correction links. No correction notice appears on the publisher page. - PubPeer. The PubPeer API returned HTTP 403 on 2026-10-23, so PubPeer could not be checked directly. A web search for the title with "pubpeer", "erratum" and "correction" found no thread or notice.
Sources: PMC5103694 (PubMed Central archive, read with src/show.py); https://jamanetwork.com/journals/jamapsychiatry/fullarticle/1935483; https://api.crossref.org/works?filter=updates:10.1001/jamapsychiatry.2014.1604; Europe PMC REST search for DOI:10.1001/jamapsychiatry.2014.1604.
Suggested correction
Replace the right-side AI volume odds ratio in the abstract and in the Results paragraph "Do AI Volumes Predict a Subsequent Depression Diagnosis?" with the value from the fitted logistic regression, checking that it lies within the reported 95% CI (0.01–0.75) and fits P = .03. The paper's own numbers place it near 0.09 (0.061–0.106). If the CI or P value was the term misreported instead, correct that term and state the corrected triplet in both places. The authors could also state the unit of AI volume for which the OR is expressed (per unit of structure ÷ whole-brain volume × 1000) so readers can interpret the magnitude. In the same correction they might review the "OR" entries with negative confidence bounds in the Table.