← Back to the plain-language case
Abstract reverses the direction of the cerebellar IDH3A protein difference reported in Table 3B
Mol Psychiatry (2016) · doi:10.1038/mp.2015.217 · PMC5078854
Summary
The abstract states that protein expression of IDH3A in the cerebellum of patients with bipolar disorder (BD) "was higher than that of controls". The paper's own Table 3B gives the opposite: 0.804 ± 0.390 in BD against 1.227 ± 0.543 in controls (n = 15 per group). That is 0.423 units, or 34.5%, lower in BD, and the Results and Discussion both describe it as lower. Recomputing from the table's summary statistics reproduces its reported tests to rounding (ANOVA F(3, 56) = 5.73 against the printed 5.74, P = 0.0017; Dunnett P = 0.0172 for BD vs controls, printed 0.017), so the table and Results are internally consistent and only the abstract's direction word is wrong. The abstract is the most widely read and indexed part of the paper, and as printed it makes the protein result appear to contradict the lower IDH3A and IDH3B mRNA reported in the preceding sentence of the same abstract.
What the paper reports
Abstract:
Moreover, protein expression of IDH3A in the cerebellum from BD patients was higher than that of controls.
Abstract, preceding sentence (the mRNA result the protein finding is presented alongside):
Furthermore, gene expression of two subtypes (IDH3A and IDH3B) of isocitrate dehydrogenase (IDH) in the dorsolateral prefrontal cortex from BD patients was significantly lower than that of controls
Results, "Protein expression of IDH3A and IDH3B in the cerebellum and parietal cortex":
Results showed that protein levels of IDH3A in the cerebellum from BD (P=0.017), major depressive disorder (P=0.006) and schizophrenia (P=0.001) were significantly lower than in controls (Table 3B).
Table 3B, cerebellum row (columns: Controls n=15 | BD n=15 | MDD n=15 | Schizophrenia n=15 | One-way ANOVA):
IDH3A | 1.227±0.543 | 0.804±0.390* | 0.746±0.356** | 0.660±0.303** | F(3, 56)=5.74, P=0.002
Table 3B footer:
The data are the mean±s.d.*P<0.05, **P<0.01 (vs control, Dunnett's test).
Discussion, first paragraph:
Furthermore, protein levels of IDH3A in the cerebellar tissue from BD patients were lower than those in controls.
Discussion, second paragraph:
We did find reduced expression of IDH3A protein in the cerebellum in BD and other psychiatric disorders such as major depressive disorder and schizophrenia.
Taken all together, it is likely that decreased activity of IDH3A in the brain may play a crucial role in the pathogenesis of BD
The conclusions that draw on the finding. Abstract:
These findings suggest that abnormality in the metabolism of isocitrate by IDH3A in the mitochondria plays a key role in the pathogenesis of BD, supporting the mitochondrial dysfunction hypothesis of BD. Therefore, IDH3 in the citric acid cycle could potentially be a novel therapeutic target for BD.
Conclusions:
Our study provides evidence for abnormality in the metabolism of isocitrate by IDH3A in the pathogenesis of BD.
What the paper's own numbers show
Method. I took the group means and standard deviations printed in Table 3B (n = 15 per group, four groups) and Table 3A (dorsolateral prefrontal cortex, DLPFC, mRNA; controls n = 34, BD n = 35). For each Table 3B row I rebuilt the one-way ANOVA from the summary statistics (between-group and pooled within-group sums of squares, df 3 and 56). For the cerebellar IDH3A row I computed each patient group's difference from controls, the pooled-variance t statistic on 56 df, and the exact two-sided Dunnett P for three comparisons against a common control with equal n (correlation 0.5), by numerical integration rather than simulation. For all seven rows of Table 3A I ran Student and Welch two-sample t tests from the summary statistics, and found the range of P values each test can give when every printed mean and SD is allowed to be off by up to 0.0005 (their 3-decimal rounding). I also applied the Benjamini–Hochberg adjustment over the seven genes to the printed P values, to check the table's false discovery rate (FDR) column. Every number below is printed by recompute.py.txt.
| Quantity | Location | Reported | Recomputed from the paper's numbers |
|---|---|---|---|
| Direction of cerebellar IDH3A protein, BD vs controls | Abstract | "higher than that of controls" | lower: BD − controls = 0.804 − 1.227 = −0.423 (−34.5%; ratio 0.655) |
| Direction of cerebellar IDH3A protein, BD vs controls | Results; Discussion ¶1 and ¶2 | "significantly lower"; "lower"; "reduced" | lower (agrees with Table 3B) |
| Cerebellar IDH3A protein, controls vs BD | Table 3B | 1.227 ± 0.543 vs 0.804 ± 0.390* | as printed; pooled t(56) = −2.84 |
| One-way ANOVA, cerebellar IDH3A | Table 3B | F(3, 56) = 5.74, P = 0.002 | F(3, 56) = 5.73, P = 0.0017 (rounding of the printed means and SDs allows F = 5.70 to 5.77) |
| Dunnett, BD vs controls, cerebellar IDH3A | Results; Table 3B (*) | P = 0.017 | t = −2.840, P = 0.0172 |
| Dunnett, MDD vs controls, cerebellar IDH3A | Results; Table 3B (**) | P = 0.006 | t = −3.229, P = 0.0058 |
| Dunnett, schizophrenia vs controls, cerebellar IDH3A | Results; Table 3B (**) | P = 0.001 | t = −3.807, P = 0.0010 |
| One-way ANOVA, cerebellar IDH3B | Table 3B | F(3, 56) = 2.30, P = 0.087 | F = 2.30, P = 0.0869; BD − controls = −0.181 |
| One-way ANOVA, parietal IDH3A | Table 3B | F(3, 56) = 2.58, P = 0.063 | F = 2.58, P = 0.0628; BD − controls = −0.279 |
| One-way ANOVA, parietal IDH3B | Table 3B | F(3, 56) = 0.63, P = 0.597 | F = 0.63, P = 0.5959; BD − controls = −0.117 |
| DLPFC IDH3A mRNA, controls vs BD | Table 3A; Abstract ("lower") | 1.466 ± 0.832 vs 1.017 ± 0.416, P = 0.007 | BD − controls = −0.449 (−30.6%); Student P = 0.0058, Welch P = 0.0069 |
| DLPFC IDH3B mRNA, controls vs BD | Table 3A; Abstract ("lower") | 1.198 ± 0.420 vs 0.957 ± 0.287, P = 0.007 | BD − controls = −0.241 (−20.1%); Student P = 0.0069, Welch P = 0.0074 |
| DLPFC mRNA, other Table 3A genes (unpaired t-test) | Table 3A | ACO1 0.178; ACO2 0.487; IDH1 0.755; IDH2 0.279; IDH3G 0.422 | Student P: ACO1 0.175; ACO2 0.478; IDH1 0.758; IDH2 0.277; IDH3G 0.419. Each printed P lies inside the range that 3-decimal rounding of the means and SDs allows (for example ACO2 0.459 to 0.497) |
| FDR column, Table 3A | Table 3A | 0.414; 0.568; 0.755; 0.488; 0.026; 0.026; 0.568 (ACO1 … IDH3G) | Benjamini–Hochberg of the printed P values: 0.415; 0.568; 0.755; 0.488; 0.025; 0.025; 0.568 (printed P ± 0.0005 gives 0.023 to 0.026 for IDH3A and IDH3B) |
| Cerebellar IDH3A protein, BD vs the other patient groups | Table 3B | — | BD − MDD = +0.058; BD − schizophrenia = +0.144 (BD is higher only relative to these groups, not to controls) |
All four one-way ANOVAs and the three Dunnett P values in Table 3B are reproduced to rounding from the printed summary statistics. In Table 3A, the printed t-test P values for IDH3A and IDH3B match the Welch test (0.0069 and 0.0074); the Student test gives 0.0058 for IDH3A, which does not round to the printed 0.007 even allowing for rounding of the inputs. For the other five genes the recomputed P values differ from the printed ones by up to 0.009 (ACO2: 0.478 against 0.487), but each printed value lies within the range that the 3-decimal rounding of the printed means and SDs allows, so these differences say nothing either way. The FDR column matches a Benjamini–Hochberg adjustment of the printed P values to rounding. None of this bears on the error: the only statement that disagrees with the numbers is the direction word in the abstract.
Figure
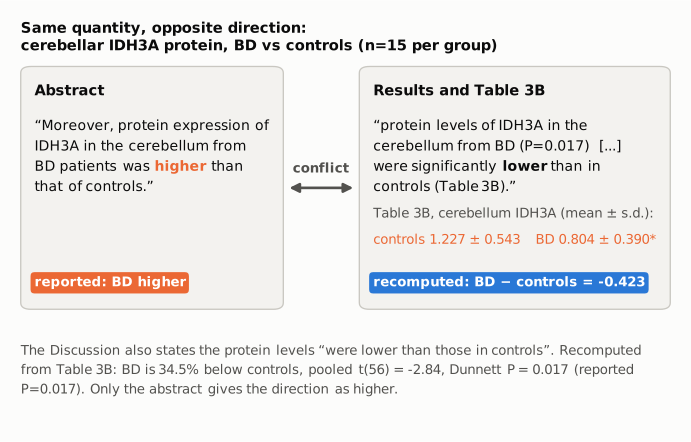
Figure 1. The two places in the paper that describe the same quantity: cerebellar IDH3A protein, BD vs controls, Stanley post-mortem samples, n = 15 per group. Left: the abstract sentence, with its direction word in orange (reported). Right: the Results sentence (black) and the Table 3B means (orange, reported), with the difference recomputed from those means in blue (BD − controls = −0.423, 34.5% lower). The connector marks the conflict. The Discussion, not shown in a panel, agrees with the Results. All text is quoted verbatim; all numbers come from Table 3B or recompute.py.txt.
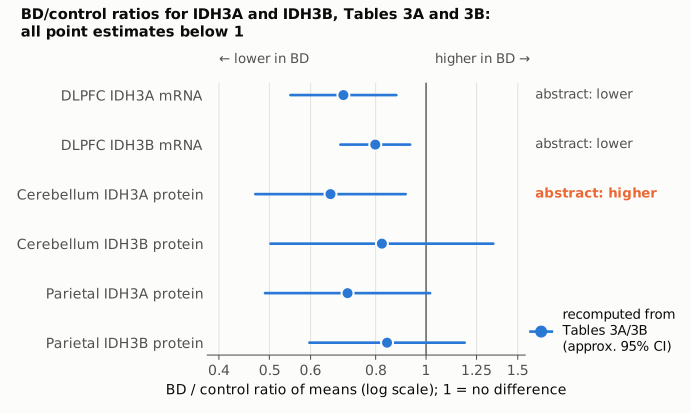
Figure 2. BD/control ratio of means for every IDH3A and IDH3B measurement in Tables 3A and 3B, on a log scale with 1 (no difference) as the reference line. Points and intervals (blue) are recomputed from the printed means and standard deviations; intervals are approximate 95% confidence intervals for the ratio by the delta method on the log scale and are shown only to convey precision, not as the paper's own analysis. The right-hand labels give the direction the abstract states for the three measurements it mentions; only the cerebellar IDH3A protein label (orange) conflicts with its point, which lies at 0.655 (95% CI 0.470 to 0.914). The figure shows that, read correctly, the protein result points the same way as the two mRNA results the abstract cites beside it.
Why it matters
- The error sits in the abstract. Abstracts are what indexing services, citation screens and most readers see. A reader of the abstract alone is told that IDH3A protein goes up in BD while IDH3A and IDH3B mRNA go down, which reads as mixed or contradictory evidence. The body of the paper reports a consistent deficit.
- It reverses the direction of a supporting result, not its size or significance. The size (−34.5%) and the significance (Dunnett P = 0.017) are correct in the body. The paper's headline findings (higher CSF isocitrate in BD; lower IDH3A/IDH3B mRNA in DLPFC) do not depend on this sentence, and the corrected direction fits the paper's argument better than the printed one.
- Direction matters for the paper's stated implications. The Discussion's inference that "decreased activity of IDH3A in the brain may play a crucial role", and the suggestion that IDH3 is "a novel therapeutic target", both rest on a deficit. An abstract that reports an excess points any reader who uses it, for example in a review or meta-analysis of post-mortem mitochondrial markers, the wrong way.
- Scope. The finding is not specific to BD: the same comparison shows lower cerebellar IDH3A in major depressive disorder and schizophrenia too (−39.2% and −46.2%), as the Results and Discussion say. That is a matter of interpretation and is not affected by the error.
Explanations considered
- A different tissue, measure or comparison. The abstract sentence names the same quantity as Table 3B and the Results: IDH3A protein, cerebellum, BD vs controls. No other cerebellar IDH3A measurement appears in the paper. Does not account for it.
- A comparison with the other patient groups rather than with controls. BD is higher than MDD (+0.058) and schizophrenia (+0.144) in Table 3B, but the abstract explicitly says "than that of controls", and these differences were not tested or reported. Does not account for it.
- An inverted ratio or normalization convention (for example, values expressed as control/BD). The table, the Results and the Discussion all read the same values as lower in BD, so the paper itself uses the convention under which BD is lower. Does not account for it.
- A text-conversion artifact in the archived copy. The publisher's version of record, the PMC page and the Europe PMC XML all carry the word "higher" in the abstract and the same Table 3B values. Does not account for it.
- A supplement that changes the result. The Supplementary Information describes the western blot and qPCR methods and gives no direction of effect; Supplementary Table S4 holds sample demographics only. Nothing in the supplements could make "higher" correct, since the main text and Table 3B give the direction plainly. Does not account for it.
- An error in the table rather than the abstract. The Results, both Discussion paragraphs and the significance markers all agree with the table, and the table's ANOVA and Dunnett P values are reproduced to rounding from its own means and SDs. The table is internally consistent; the abstract is the outlier.
- A published correction. None was found (see Status).
Status
As of 2026-10-23:
- Version of record checked. The publisher's article page (reached from doi.org) carries the same abstract sentence ("was higher than that of controls"), the same Results and Discussion wording ("significantly lower", "lower"), and the same Table 3B cerebellum IDH3A row and Dunnett footnote. The PMC and Europe PMC full texts match. The discrepancy is in the published article, not introduced by conversion.
- Supplements checked. Supplementary Information (DOC) and Supplementary Table S4 were examined; they report methods and demographics and do not resolve the conflict.
- Corrections. No correction, erratum or retraction was found: Crossref has no update relations (its relation field lists only an F1000 recommendation), and PMC and Europe PMC list no correction notices. Europe PMC links one "Comment in" item (PMID 29155801, Mol Psychiatry 2018;23:792–793, doi:10.1038/mp.2017.149), a letter rather than a correction; according to the version-of-record check it describes the paper as reporting reduced cerebellar IDH3A protein, which matches the body of the paper.
- PubPeer. The PubPeer API could not be queried (it required human verification), so PubPeer was not checked directly. Web searches found no PubPeer thread and no Retraction Watch coverage.
- Sources.
src/show.py PMC5078854(PMC archived text, tables and abstract);src/known.py 10.1038/mp.2015.217(Crossref, PMC and Europe PMC notices: none); https://doi.org/10.1038/mp.2015.217 and the publisher's Table 3B page; Europe PMC full-text XML; the Supplementary Information file.
Suggested correction
In the abstract, replace
Moreover, protein expression of IDH3A in the cerebellum from BD patients was higher than that of controls.
with
Moreover, protein expression of IDH3A in the cerebellum from BD patients was lower than that of controls.
No change is needed to Table 3B, the Results, the Discussion or the Conclusions, which already report the direction correctly. Optionally, the corrected sentence could add the effect and test (0.804 ± 0.390 vs 1.227 ± 0.543; Dunnett P = 0.017) and note that the reduction was also seen in major depressive disorder and schizophrenia, as the Results state.