← Back to the plain-language case
The 2013 estimate of MSM living with HIV lies above its own 90% upper limit
Epidemiology (2016) · doi:10.1097/EDE.0000000000000423 · PMC4733816
Summary
The paper's main applied result is the number of men who have sex with men (MSM) living with HIV in the UK in 2013, given in the Abstract and Results as 48,310 (90% plausibility range 39,900–45,560). The Methods define the point estimate as the median and the range limits as the 5th and 95th percentiles of one distribution of model outputs, so the median cannot exceed the upper limit. Here it does, by 2,750. The point estimate is consistent with the paper's other numbers (its four CD4 strata sum to exactly 48,310), and the paper's own Figure 3A shows the 2013 range running from about 40,000 to about 60,400. The printed upper limit is therefore wrong, and as printed it understates the upward uncertainty of the headline estimate by roughly 15,000 people, in a paper whose stated contribution is a method that produces such ranges.
What the paper reports
Abstract:
In 2013, 48,310 (90% plausibility range: 39,900–45,560) men who have sex with men were estimated to be living with HIV in the UK, of whom 10,400 (6,160–17,350) were undiagnosed.
Results, third paragraph of "Calibration to Data on MSM in the UK and Resulting Estimates for 2013":
By 2013, an estimated 48,310 (90% plausibility range: 39,900–45,560) MSM were living with HIV in the UK (Figure 3), and 2,300, 5,500, 11,830, and 28,680 individuals had CD4 count ≤200, 201–350, 351–500, and >500 cells/mm3 respectively. It is thought that 10,400 (6,160–17,350) MSM were living with undiagnosed HIV, which means the undiagnosed proportion is 22% (13%–36%, Figure 3).
Methods, third paragraph of "How the Model Is Calibrated to Country Data", which defines the estimate and the range:
The median, 5th and 95th percentiles of the distribution of these model outputs at each calendar year are considered the point estimate and plausibility range limits, respectively.
Results, first paragraph of the same subsection, which says which runs the results come from:
The following results presented are those generated using the 742 parameter sets where the calibration score was <0.2 (median: 0.178, min: 0.107, max: 0.199) among the 1,000 resampled simulations.
Figure 3 legend:
Estimates of the (A) total number of MSM living with HIV in the UK and (B) total number of MSM living with undiagnosed HIV, by calendar year. Columns and error bars: Modeled median and 90% plausibility range.
Discussion, second paragraph (point estimate only):
The number of MSM living with HIV in the UK is now estimated to be 48,310 for 2013.
Discussion, final (tenth) paragraph, on what the method contributes:
This novel method allows us to also naturally produce plausibility ranges for these estimates, which describe the uncertainty surrounding the estimates, based on the data to which the model was calibrated.
What the paper's own numbers show
Method. I checked the reported estimate against its range using the paper's definition (median between the 5th and 95th percentiles; this holds for any distribution, and recompute.py.txt confirms it on four very different simulated ones). To see which of the three numbers is at fault, I summed the CD4 strata and the undiagnosed CD4 strata given in the same paragraph and recomputed the undiagnosed proportion. I checked every other estimate-with-range in the Results the same way, and expressed each as the position of the estimate within its range, (estimate − lower)/(upper − lower), which must lie between 0 and 1. Finally I read the 2013 column of the paper's Figure 3A, which the Results cite for this estimate. I fitted a straight line to the pixel rows of the eight labelled y-axis tick marks (0 to 70,000) on the PMC image ede-27-247-g004.jpg; one pixel row is 165 people, and the largest tick-mark residual is 154. I then converted the measured rows of the grey bar and the diamond. Every number below is printed by recompute.py.txt.
In the table, Results paragraphs are counted from 1 within the subsection "Calibration to Data on MSM in the UK and Resulting Estimates for 2013".
| Quantity | Location | Reported | Recomputed from the paper's own numbers |
|---|---|---|---|
| MSM living with HIV, 2013: is the estimate inside its range? | Abstract; Results, 3rd paragraph | 48,310 (39,900–45,560) | No. 48,310 − 45,560 = 2,750 above the upper limit |
| Lower limit to estimate | Abstract; Results, 3rd paragraph | 39,900 | 8,410 below the estimate; possible |
| Required upper limit (95th percentile ≥ median) | Methods, 3rd paragraph of "How the Model Is Calibrated to Country Data" | 45,560 | must be ≥ 48,310 |
| Sum of CD4 strata, 2013 | Results, 3rd paragraph | 2,300 + 5,500 + 11,830 + 28,680 | 48,310, equal to the point estimate |
| Sum of undiagnosed CD4 strata, 2013 | Results, 3rd paragraph | 710 + 1,930 + 3,040 + 4,720 | 10,400, equal to the undiagnosed estimate |
| Undiagnosed proportion | Results, 3rd paragraph | 22% (13%–36%) | 10,400 / 48,310 = 21.5%, rounds to 22% |
| Undiagnosed MSM, 2013 | Abstract; Results, 3rd paragraph | 10,400 (6,160–17,350) | inside; position 0.38 |
| Infections per year, 2010–2013 | Abstract; Results, 2nd paragraph | 3,210 (1,730–5,350) | inside; position 0.41 |
| Cumulative infections by end of 2012 | Results, 2nd paragraph | 67,720 (56,470–78,800) | inside; position 0.50 |
| Asymptomatic diagnosis rate per 3 months | Results, 2nd paragraph | 0.042 (0.025–0.069) | inside; position 0.39 |
| MSM living with HIV, 2013, as printed | Abstract; Results, 3rd paragraph | 48,310 (39,900–45,560) | position 1.49 |
| Figure 3A, 2013 column, read off | Figure 3A | median and 90% range drawn, no numbers | median about 48,500; range about 40,000–60,400 (position 0.42) |
| Figure 3A, 2012 and 2011 columns, read off | Figure 3A | as above | 2012: about 46,100 (38,200–56,400); 2011: about 43,800 (36,200–52,300) |
| Figure 3A minus text, 2013 | Figure 3A vs Abstract | — | median +190, lower limit +100, upper limit +14,840 |
| Check of the reading method: Figure 3B, undiagnosed, 2013 | Figure 3B vs Results, 3rd paragraph | 10,400 (6,160–17,350) | read off as about 10,400 (6,100–17,400) |
| eAppendix row described as "the same as the main result" | eAppendix eTable 6 (threshold 0.20, weights A) | 121 parameter sets; 51,000 (41,400–61,000) | upper limit above the median; but the set count and median differ from the main text (742 sets, 48,310) |
| Upper limits in all nine sensitivity scenarios | eAppendix eTable 6 | 59,700 to 61,500 | none is below 48,310 |
The point estimate fits every other number in the Results, and the lower limit agrees with Figure 3A to within reading precision. Only the upper limit fails, and Figure 3A, which plots the same quantity from the same model runs, puts it at about 60,400, not 45,560. The figure reading is approximate (about ±200 people), but the difference from the text is about 74 times larger than that. The same reading method applied to the 2013 column of Figure 3B (undiagnosed) gives about 10,400 (6,100–17,400), against the printed 10,400 (6,160–17,350), so the method recovers a range the text prints correctly.
Figure
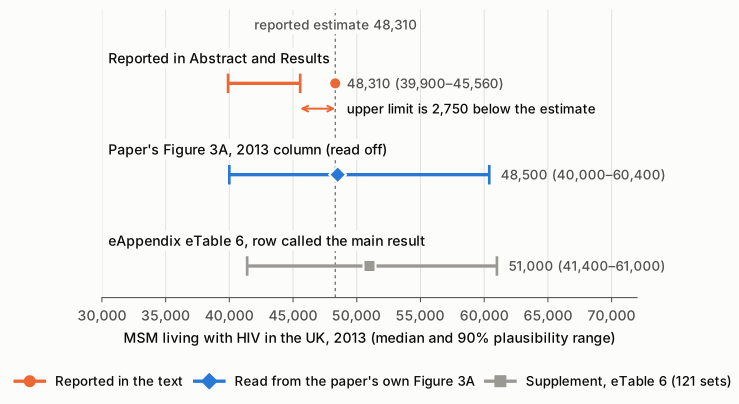
Figure 1. MSM living with HIV in the UK in 2013, on one axis of people (the axis starts at 30,000; no bar lengths are compared). Orange: the estimate and 90% plausibility range printed in the Abstract and Results, 48,310 (39,900–45,560). The printed upper limit lies 2,750 to the left of the estimate, which the Methods' definition (median ≤ 95th percentile) does not allow. Blue: the same quantity read from the 2013 column of the paper's Figure 3A, about 48,500 (40,000–60,400). Grey: the eAppendix eTable 6 row that the supplement describes as the main result, 51,000 (41,400–61,000), shown for context; it comes from 121 parameter sets, not the 742 the main text uses. The dashed line marks the reported estimate. The figure reading and the supplement agree that the upper limit is near 60,000.
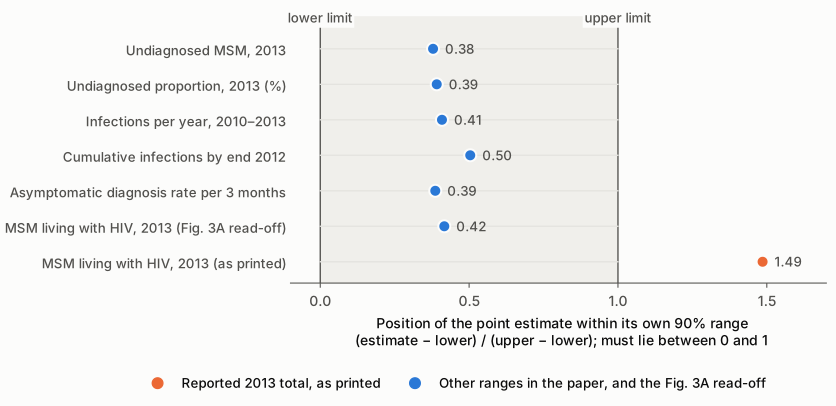
Figure 2. For each estimate with a 90% range in the Results, the position of the point estimate within its range, (estimate − lower)/(upper − lower). A median must fall between 0 (the lower limit) and 1 (the upper limit). The five other ranges in the Results (blue) put the estimate at 0.38 to 0.50, as does the Figure 3A reading for the 2013 total (0.42). The printed 2013 total (orange) is at 1.49, outside its own range.
Why it matters
- It is the paper's headline applied number. The range appears in the Abstract and in the Results paragraph that reports the main estimate for the UK. Readers who quote the Abstract will carry an impossible interval, and the error is not obvious unless the reader checks the ordering.
- As printed, it understates uncertainty, all on one side. The printed range spans 5,660 people and ends below the estimate. The paper's own figure suggests a span of about 20,400 people, about 12,090 of them above the reported estimate. A reader who used the printed interval, for example to plan services or to compare with other UK estimates, would wrongly conclude that values above 45,560 are implausible under the model.
- The method's stated contribution is uncertainty ranges. The Discussion says the method naturally produces "plausibility ranges for these estimates, which describe the uncertainty surrounding the estimates". The main applied range is the paper's showcase of that feature.
- What is not affected. The point estimate of 48,310, the CD4 breakdown, the undiagnosed estimate of 10,400 (6,160–17,350), the incidence and diagnosis-rate estimates and their ranges, the pseudo-data validation (Figure 5), and the conclusions about data availability do not depend on the printed upper limit. Figure 3A itself appears correct.
Explanations considered
- A different definition of the estimate or the range. This does not account for the numbers. The Methods name the median and the 5th and 95th percentiles of one distribution of model outputs. A median cannot exceed its own 95th percentile under any distribution, so no reading of the definition allows the printed range. A mean outside a percentile interval would be possible in principle, but the paper calls the estimate a median, and Figure 3's legend says "Modeled median".
- The two numbers refer to different quantities, years or runs. This does not account for the numbers. Both sentences give the estimate and range together, for the same quantity (total MSM living with HIV in the UK, 2013), and both cite Figure 3, whose 2013 median matches 48,310. The "based on prior distributions" outputs and the pseudo-epidemic results (Figure 5) are separate and are not the source.
- The point estimate is the wrong number, not the upper limit. This is ruled out by the paper's other numbers. 48,310 is the exact sum of the four CD4 strata, it gives the stated 22% undiagnosed, it is repeated in the Discussion, and it matches the Figure 3A median to within reading precision. The lower limit matches Figure 3A as well. Only the upper limit disagrees.
- A conversion artifact in the PMC text. This is excluded. The same "48,310 (90% plausibility range: 39,900–45,560)" appears in the PMC-archived text, on the PMC article page and in the Europe PMC full-text XML (the last two fetched on 2026-10-23), and "48,310 (90% plausibility range:39,900-45,560)" appears in the Abstract and Results of the manuscript file ede-27-247-s001.docx, which is independent of the PMC text conversion. The publisher's typeset PDF was not re-verified for this write-up (see Status).
- A typographical slip in one place. The same range appears in the Abstract, the Results and both places in the manuscript version supplied as supplementary file ede-27-247-s001.docx. So the error was present before typesetting and was carried into both places. The published material does not show how it arose. Possible correct values include a limit near 60,400 (Figure 3A) or 61,000 (the eTable 6 row described as the main result), but the exact figure cannot be recovered from the paper.
- A side observation, not needed for the main finding. The eAppendix states that its eTable 6 row for threshold 0.20 and weights A "is the same as the main result presented in the main manuscript", yet that row reports 121 parameter sets and 51,000 (41,400–61,000), while the main text reports 742 sets and 48,310. The supplement's own description of the calibration (page 20) says "The results in the manuscript are based on the 742 runs", so eTable 6 may report parameter sets rather than resampled runs, or a separate run. Either way, its upper limit, like those of all nine sensitivity scenarios (59,700 to 61,500), is well above 48,310.
Status
- Version of record. The archived PMC text, the PMC article page and the Europe PMC full-text XML (the last two fetched on 2026-10-23) all print 48,310 (90% plausibility range: 39,900–45,560). The publisher's typeset PDF was not re-verified: the Europe PMC PDF links and journals.lww.com (where the doi.org link resolves) refused automated access on 2026-10-23. Every quote above was confirmed verbatim against the PMC-archived text with
src/show.py, except the eAppendix sentences, which I read from the supplement PDF. - Figure. I read Figure 3 from the image ede-27-247-g004.jpg (800 × 1244 px; the same file is in the Europe PMC supplementaryFiles zip) and measured the 2011–2013 columns of panel A pixel by pixel. The pixel rows are recorded in
recompute.py.txt. The image is not reproduced here. Read the same way, panel B's 2013 column gives about 10,400 (6,100–17,400), which matches the printed undiagnosed estimate 10,400 (6,160–17,350). - Supplements. (a) The eAppendix (the article's Supplemental Digital Content 1, links.lww.com/EDE/A994, 30 pages), downloaded on 2026-10-23: I read page 20 (742 runs) and eTable 6 (pages 23–24), including the sentence on page 24 that the threshold 0.20, weights A row "is the same as the main result". The eAppendix does not print 45,560 anywhere, and it does not resolve the discrepancy. (b) The PMC supplementary file ede-27-247-s001.docx is a manuscript version of the article. I checked it directly on 2026-10-23, from the zip returned by the Europe PMC supplementaryFiles service (www.ebi.ac.uk/europepmc/webservices/rest/PMC4733816/supplementaryFiles). It prints "48,310 (90% plausibility range:39,900-45,560)" in both its Abstract and its Results, and 48,310 again in its Discussion.
- Corrections. One erratum exists: Epidemiology 2016;27(3):e24, doi:10.1097/EDE.0000000000000474, PMC6855333, PMID 27043876. I read its PMC page on 2026-10-23. It corrects only the Open Access footnote, to a CC BY 4.0 licence statement, and does not mention the estimate or its range. Crossref lists no update-to, updated-by or relation entries for the article. PMC and Europe PMC list no other notice, and there is no retraction or expression of concern.
- Comments. Not re-verified for this write-up: a PubPeer search on 2026-10-23 was refused by a human-verification check, and no Retraction Watch search was recorded.
- As of 2026-10-23, the range 39,900–45,560 is uncorrected.
- Sources. PMC4733816 (archived XML and article page); Europe PMC full-text XML and supplementaryFiles zip (manuscript docx and Figure 3 image ede-27-247-g004.jpg); eAppendix (links.lww.com/EDE/A994); erratum PMC6855333; Crossref.
Suggested correction
- Replace the upper limit of the 2013 estimate in both the Abstract and the Results ("48,310 (90% plausibility range: 39,900–45,560)") with the 95th percentile of the 742 accepted runs. The paper's Figure 3A puts it at about 60,400, so the corrected text would read about "48,310 (90% plausibility range: 39,900–60,400)" if the figure is right. The authors' model output is needed for the exact value.
- Confirm that the lower limit (39,900) and the point estimate (48,310) were taken from the same output. Both match Figure 3A, so no change is expected.
- Optionally, clarify in the eAppendix how the eTable 6 row described as "the same as the main result" (121 parameter sets; 51,000, 41,400–61,000) relates to the main text's 742 runs and 48,310.