← Back to the plain-language case
Between-subject SD of 2.8 Hz for alpha peak frequency is incompatible with the paper's Table 1
Neuroimage (2014) · doi:10.1016/j.neuroimage.2014.01.049 · PMC4013551
Summary
This MEG study of 51 subjects reports in its Abstract, Results and Discussion that posterior alpha peak frequency averaged 10.3 Hz, with a within-subject SD of 0.9 Hz and a between-subject SD of 2.8 Hz. The paper's own Table 1 lists the mean, SD and N of every detected peak for each of its 10 condition × ROI cells. Its Ns add up to the 499 detected observations, and its grand mean reproduces 10.3 Hz. Pooled exactly, these cells give an SD of 1.27 Hz across all 499 peaks. No between-subject SD can be larger than that, and once the reported within-subject SD of 0.9 Hz is taken out, about 0.90 Hz is left. The 2.8 Hz figure is used to say that between-subject variability is higher than the roughly 1 Hz reported earlier and about three times the within-subject SD. By the paper's own numbers it is neither.
What the paper reports
Abstract:
The average alpha peak frequency across all subjects, conditions, and regions of interest was 10.3 Hz with a within-subject SD of 0.9 Hz and a between-subject SD of 2.8 Hz.
Results, "Between-subject variability":
Taking all conditions and ROIs into account, detected alpha peak frequencies spread the full 7–14 Hz search range. The bin with the highest number of observations was centered at 10.8 Hz. The mean alpha peak frequency across subjects was 10.3 Hz with a between-subject SD of 2.8 Hz (compare with a within-subject SD of 0.9 Hz), and the median was 10.4 Hz.
Discussion, opening paragraph:
The average alpha peak frequency across subjects, conditions, and ROIs was 10.3 Hz with a within-subject SD of 0.9 Hz and a between-subject SD of 2.8 Hz.
Discussion, "Inter-subject variability":
As expected, inter-subject variability exceeded intra-subject variability. Individual alpha peak frequency values were found including the entire search range of 7–14 Hz, with a between-subject SD of 2.8 Hz (note that the fact that we find a higher SD than previously reported may be due to the use of various tasks and more subjects).
Introduction (the earlier value that the Discussion compares against):
The reasoning is that because of substantial inter-individual variability in alpha frequency (a mean SD of 1 Hz is reported, cf. Klimesch, 1997), significant portions of alpha power will fall outside a fixed frequency window
Table 1 caption, and the table:
Individual alpha peak frequency. Showing per condition and ROI: mean ± standard deviation (N). N indicates number of subjects that had a detectable peak for that particular condition ∗ ROI combination.
| Occipital ROI | Parietal ROI | |
|---|---|---|
| Rest | 9.981 ± 1.088 (47) | 10.143 ± 1.147 (49) |
| Base | 9.916 ± 1.303 (50) | 10.075 ± 1.107 (51) |
| Stim | 10.102 ± 1.249 (51) | 10.108 ± 1.092 (51) |
| 0-back | 10.716 ± 1.412 (49) | 10.304 ± 1.344 (51) |
| 2-back | 11.118 ± 1.132 (50) | 10.816 ± 1.311 (50) |
Fig. 4 caption, panel D:
Total number of observations was 510 (i.e., 2 ROIs, 5 conditions, 51 subjects). Note: number of observations of undetectable peak frequency was 11, not shown in histogram.
Results, "Beta peak frequency in relation to alpha" (parietal ROI, rest, N = 32):
we multiplied each individual's alpha peak frequency with factor 2 to get the estimated harmonic beta peak (mean, 20.3 Hz; SD, 2.3 Hz)
What the paper's own numbers show
Method. Each Table 1 cell holds one alpha peak frequency per subject with a detectable peak. The ten cells together therefore hold every detected observation, and their combined mean and SD follow exactly from the cell means m, SDs s and Ns n (law of total variance): the total sum of squares is Σ(n−1)s² + Σn(m − M)², where M is the N-weighted grand mean, and the SD of all observations is √(SS / (N − 1)). A between-subject SD is the spread of subjects around the grand mean, so it cannot exceed the spread of all observations. If the within-subject SD of 0.9 Hz is taken as given, the between-subject variance is what is left of the total variance after 0.9² is subtracted. Every number below is printed by recompute.py.txt.
| Quantity | Location | Reported | Recomputed from the paper's numbers |
|---|---|---|---|
| Number of detected observations | Table 1 Ns; Fig. 4D caption | 510 − 11 undetectable | Σn = 499: Table 1 covers every detected peak |
| Grand mean | Abstract; Results; Discussion | 10.3 Hz | 10.328 Hz (N-weighted mean of the cells): matches |
| SD within each cell (one value per subject) | Table 1 | 1.088–1.412 Hz | pooled within-cell SD 1.224 Hz |
| Spread of the 10 cell means | Table 1 | 9.916–11.118 Hz | N-weighted SD 0.387 Hz |
| SD of all 499 detected peaks | derived from Table 1 | not reported | 1.273 Hz (variance 1.621 Hz²; within-cell SS 732.71, between-cell SS 74.68) |
| Between-subject SD | Abstract; Results; Discussion (×2) | 2.8 Hz | at most 1.27 Hz; 0.90 Hz after removing within-subject 0.9 Hz (√(1.621 − 0.81)) |
| Reported vs recomputed between-subject SD | derived | 2.8 Hz | 2.20 × the upper bound; 3.11 × the implied value |
| Total variance the text implies | derived | 2.8² + 0.9² = 8.65 Hz² | 5.34 × the 1.62 Hz² that Table 1 allows (2.8² alone is 4.84 ×) |
| Alpha SD in the beta section (parietal, rest) | Results, beta section | 2 × alpha: SD 2.3 Hz, mean 20.3 Hz | alpha SD 1.15 Hz, mean 10.15 Hz (Table 1 parietal rest: 10.143 ± 1.147) |
| Ratio of between- to within-subject SD | derived | 2.8 / 0.9 = 3.1 | 1.00 (implied); at most 1.41 |
| Largest SD possible for values in 7–14 Hz | Methods (search range) | — | 3.50 Hz (half the range; Bhatia–Davis bound with mean 10.33 is also 3.50) |
The 2.8 Hz figure lies about two-thirds of the way from the observed spread to the largest SD that values confined to 7–14 Hz can have at all. Each of the ten Table 1 SDs is itself a between-subject SD for one condition and ROI. All ten lie between 1.09 and 1.41 Hz, and the beta section gives 1.15 Hz for the parietal rest condition in a further subset of subjects.
Figure
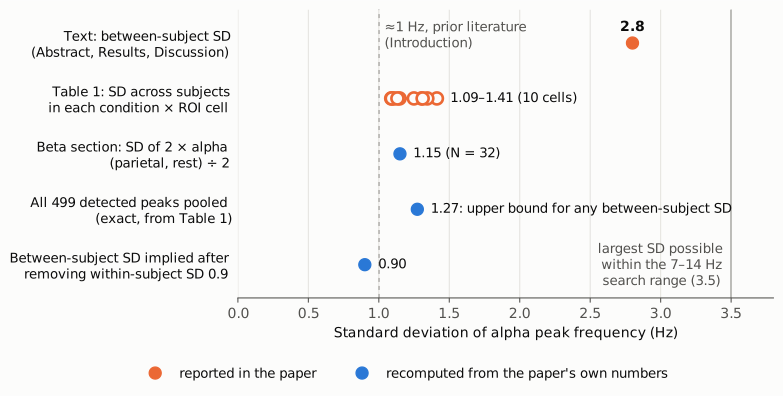
Figure 1. Standard deviations of alpha peak frequency (Hz). Orange: values printed in the paper, namely the between-subject SD of 2.8 Hz given in the Abstract, Results and Discussion, and the ten per-cell SDs of Table 1 (open circles), each of which is an SD across subjects for one condition and ROI. Blue: values recomputed from the paper's own numbers, namely the alpha SD implied by the beta section (2.3 Hz ÷ 2), the exact SD of all 499 detected peaks pooled from Table 1 (1.27 Hz, an upper bound for any between-subject SD), and the between-subject SD left once the reported within-subject SD of 0.9 Hz is removed (0.90 Hz). The dashed line marks the roughly 1 Hz reported in earlier work, as cited in the Introduction. The solid line at 3.5 Hz is the largest SD that any set of values within the 7–14 Hz search range can have.
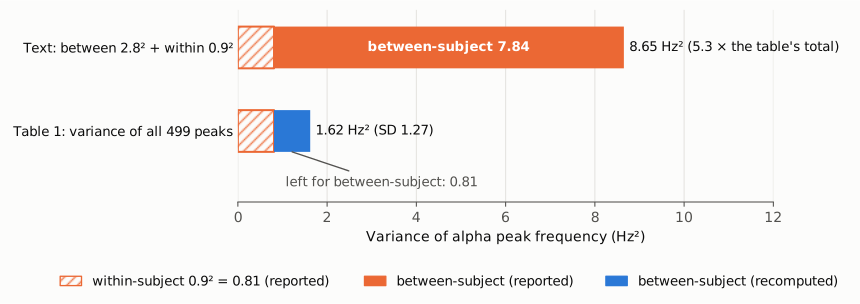
Figure 2. The same comparison on the variance scale (Hz²). Upper bar: the variance the text implies, a between-subject 2.8² = 7.84 plus a within-subject 0.9² = 0.81, for 8.65 Hz² in total. Lower bar: the exact variance of all 499 detected peaks computed from Table 1, 1.62 Hz². With the same within-subject 0.81 removed, 0.81 Hz² is left for between-subject variation (SD 0.90 Hz). The text requires 5.3 times the total variance present in the paper's own table.
Why it matters
The between-subject SD is one of the headline results of a paper about inter- and intra-individual variability. It appears in the Abstract and twice in the Discussion, and three interpretive claims rest on it.
- Comparison with earlier work. The Discussion says the paper finds "a higher SD than previously reported" and attributes this to "the use of various tasks and more subjects". The earlier value cited in the Introduction is about 1 Hz. The paper's own data give 0.90 Hz (at most 1.27 Hz), which agrees with that value and does not exceed it.
- Between versus within. The text contrasts 2.8 Hz with 0.9 Hz, a ratio of about 3. The recomputed between-subject SD is about the same as the within-subject SD (ratio 1.00, at most 1.41). The Discussion's statement that "inter-subject variability exceeded intra-subject variability" may still hold, but it cannot rest on the reported ratio, and the paper gives no other test of it.
- Fixed 8–12 Hz band. The argument that a fixed band "would bias against those with an alpha peak frequency outside of that range" is right in kind: the paper reports detected peaks over the whole 7–14 Hz search range. Its size is overstated, though. As a rough guide only (the distribution is described as skewed in some conditions), a normal distribution with mean 10.3 Hz and SD 2.8 Hz would put 47.8% of values outside 8–12 Hz and 21.2% outside the 7–14 Hz search range, where no detected peak can lie. With the table's SD of 1.27 Hz the figures are 12.8% and 0.6%.
The condition effects do not depend on the 2.8 Hz value: the repeated-measures ANOVA, the increase from rest and visual stimulation to N-back, and the 2-back versus 0-back difference. Nor does the recommendation to use individual alpha frequencies, which follows from the observed range of peaks. Readers who cite the paper for the size of between-subject variability in alpha peak frequency would, however, carry forward a value about 2.2 to 3.1 times too large. Crossref records more than 600 citations of the article.
Explanations considered
- The 2.8 Hz figure describes different observations from Table 1. This does not account for the numbers. The Table 1 Ns add up to 499, exactly the 510 observations minus the 11 undetectable peaks in the Fig. 4D caption, and the table's grand mean (10.328 Hz) reproduces the reported 10.3 Hz. The Results paragraph that gives 2.8 Hz cites "Table 1, Fig. 4D" itself.
- The Table 1 entries are standard errors, not SDs. Excluded. The caption says "mean ± standard deviation (N)". As SEMs they would imply SDs of 7.5–9.9 Hz, above the 3.5 Hz ceiling for values within 7–14 Hz. Fig. 4C shows SEMs separately.
- "Between-subject SD" means the SD of each subject's average over conditions and ROIs. This does not account for the numbers. Subject averages vary less than the individual observations they summarise, so their SD cannot exceed the 1.27 Hz of all observations (apart from a negligible effect of the 11 missing values). With the reported within-subject SD of 0.9 Hz it is about 0.90 Hz.
- The 11 undetectable peaks were coded as a number and left in. This does not account for the numbers. Coded as 0 Hz they raise the SD to 1.96 Hz but lower the mean to 10.11 Hz, which no longer matches the reported 10.3 Hz. Coded as 7 or 14 Hz they give SDs of 1.35 and 1.37 Hz. None reaches 2.8 Hz. The Methods also state that undetected peaks were set to NaN.
- 2.8 is a variance, not an SD. Excluded. The total variance of the observations is 1.62 Hz², and the between-subject variance implied by the text and table together is 0.81 Hz².
- 2.8 is a simple multiple of the pooled SD (for example a confidence half-width or a range). This is not supported. 1.96 × 1.27 = 2.50 and 2 × 1.27 = 2.55, neither of which rounds to 2.8; √5 × 1.27 = 2.85 comes close but corresponds to no quantity the paper names. The paper does not say how 2.8 Hz or 0.9 Hz were computed, so the source of the value cannot be identified from the published material.
- Rounding. Excluded. The table gives means and SDs to three decimals, and 2.8 is more than twice the largest SD any of them allows.
- A conversion or typesetting error in the archived text. Excluded. The value appears four times in identical form in the publisher-deposited PMC text, in Europe PMC's full-text XML and on the live PMC page, and Table 1 is native XML table markup with the same entries in every rendering.
Status
- Version of record. The PMC copy is the publisher's own deposit (collection "Elsevier Sponsored Documents", not an author manuscript; CC BY 3.0; PMC version 1). An earlier check compared three renderings, the live PMC page, the Europe PMC full-text XML and the locally archived PMC text: all carry the four 2.8 Hz sentences and the same Table 1. ScienceDirect could not be fetched automatically (the doi.org link resolves to a redirect stub, and the article page returned HTTP 403), and the PDF links on PMC and Europe PMC returned HTML, so the publisher's PDF was not compared directly. Every quotation above was confirmed verbatim against the PMC-archived text with
src/show.py. - Supplements. None. The PMC record has no supplementary material, and Europe PMC lists none (hasSuppl = N). No public subject-level data were found from which the between-subject SD could be recomputed directly.
- Corrections and comments. As of 2026-10-24 no correction, erratum, corrigendum, expression of concern or retraction was found. Crossref lists no update relations for the DOI, and a Crossref search for works updating it (which includes Retraction Watch data) returned none. PMC and Europe PMC list no notices, and the PubMed record (PMID 24508648) has no comments or corrections linked. A web search for corrections or comments on the article found none. PubPeer could not be checked directly: its search page returned a Cloudflare challenge (HTTP 403) and its publication API returned HTTP 404.
- Sources. PMC article PMC4013551 (archived and live); Europe PMC full-text XML and record for PMID 24508648; Crossref work record for doi:10.1016/j.neuroimage.2014.01.049; PubMed.
Suggested correction
- Recompute the between-subject SD of alpha peak frequency from the subject-level data, state how it is defined (for example the SD across subjects of each subject's mean over conditions and ROIs, or a variance component from the repeated-measures model) and how the within-subject SD of 0.9 Hz is defined, and replace 2.8 Hz in the Abstract, Results and Discussion. Table 1 implies a value of about 0.9 Hz, and at most 1.27 Hz.
- Revise the Discussion statement that the study finds "a higher SD than previously reported": the value implied by Table 1 is in line with the roughly 1 Hz cited in the Introduction.
- Restate the comparison between inter- and intra-subject variability with the corrected figures, and support the claim that inter-subject variability exceeds intra-subject variability with a stated test or variance-component estimate, if it still holds.
- Optionally, report the share of detected peaks that fall outside 8–12 Hz, taken directly from the Fig. 4D histogram, so that the argument against a fixed band rests on the observed proportion.