← Back to the plain-language case
Table 2 odds ratios for haplogroup B4 and other zero-cell rows cannot come from the counts
PLoS Genet (2013) · doi:10.1371/journal.pgen.1003696 · PMC3744426
Summary
The paper reports that mitochondrial haplogroup B4 is less common in biliary atresia (BA) than in controls, with an odds ratio (OR) of 0.71 (95% CI 0.66–0.77), and an age- and sex-adjusted OR of 0.82 (0.71–0.85) in the Abstract. Its own Table 2 shows that none of the 71 BA patients and 23 of the 200 controls carry B4. With an empty cell the sample odds ratio is 0. The exact 95% CI is 0 to 0.45, and adding 0.5 to each cell gives 0.053 (0.003–0.881). The printed 0.71 (0.66–0.77) instead equals, to two decimals, a different statistic: the proportion of B4-negative participants who are controls divided by the proportion of B4-positive participants who are controls, 0.714 (0.660–0.772). Three other zero-cell rows of Table 2 (M8&Z, Y and D) show the same pattern. The direction of the B4 association and its p-value (Fisher exact p = 0.0009) stand, but the effect size and its precision are misreported for the paper's headline genetic finding, and the adjusted estimate cannot be finite for these counts.
What the paper reports
Results, "Association of BA with specific mitochondrial haplogroups", second paragraph:
Evaluation of haplogroup distributions revealed that the haplogroup B4 was less prevalent in patients with BA than in the control group (odds ratio [OR], 0.71; 95% confidence interval [CI], 0.66–0.77; p = 0.001).
The same paragraph, adjusted analysis:
Multivariate logistic-regression analysis of haplogroups associated with BA with adjustment for age and sex, showing the risk for haplogroup B4 was p = 0.007, OR 0.82, 95%CI 0.71–0.85
Abstract:
The haplogroup B4 and E prevalence were significantly lower and higher respectively, in the patients with BA than in the controls (odds ratios, 0.82 [p = 0.007] and 7.36 [p = 0.032] respectively) in multivariate logistic-regression analysis.
Table 2, "Association between biliary atresia (BA) and the mitochondrial haplogroups". The columns are BA positive | BA negative | control positive | control negative | OR | 95% CI | p:
B4 | 0 | 71 | 23 | 177 | 0.71 | 0.66–0.77 | 0.001*
M8&Z | 0 | 71 | 5 | 195 | 1.36 | 1.27–1.47 | 0.331
Y | 0 | 71 | 1 | 199 | 1.36 | 1.26–1.46 | 1.000
D | 2 | 69 | 0 | 200 | 3.90 | 3.18–4.78 | 0.068
Z | 1 | 70 | 1 | 199 | 2.84 | 0.18–46.06 | 0.456
C | 1 | 70 | 1 | 199 | 2.84 | 0.18–46.07 | 1.456
Table 1, "Descriptive data of studied population". The columns are BA | control (children) | control (adult):
haplogroup B4 | 0 | 5 | 18
Materials and Methods, "Subjects", and "Statistical analysis":
The genetic background was similar in both control groups and was put together for statistical calculation.
Frequencies of all mitochondrial haplogroups in the BA patients and controls were tested for independency using Pearson chi-square statistics and Fisher's exact test as appropriate.
The statistical analyses were performed using the Statistical Package for Social Science (SPSS, version 12) software package.
The conclusions that rest on the B4 result. Author Summary:
The prevalence of haplogroup B4 and E was significantly lower and higher respectively, in the patients with BA than in the controls.
Discussion, first paragraph:
We found that whereas the haplogroup B4 was significantly less likely to occur in the patients with BA, the haplogroup E was more likely to occur in the patients with BA than in the healthy controls.
Conclusion:
The use of the cybrid models helped to establish the association of haplogroups B4 and E with BA
What the paper's own numbers show
Method. I first checked the B4 counts against Table 1: 5 child and 18 adult controls carry B4, so 23 of the 200 pooled controls, and 0 of 71 BA patients do. I then recomputed every row of Table 2 from its four counts: the sample odds ratio with a Woolf (log-Wald) CI, the odds ratio with 0.5 added to each cell (Haldane–Anscombe; for a single binary exposure this equals the Firth-penalised logistic estimate, which the script confirms), the exact conditional odds ratio and CI for B4, Fisher's exact test and Pearson's chi-square test. For the rows that did not reproduce, I tried simple ratios of proportions (with Katz log CIs) to find a statistic that does match the printed values. Every number below is printed by recompute.py.txt.
| Quantity | Location | Reported | Recomputed from the paper's numbers |
|---|---|---|---|
| B4 carriers, BA vs controls | Table 1, Table 2 | 0/71 vs 23/200 (5 + 18) | consistent: 23 = 5 + 18; 177 = 200 − 23 |
| B4 odds ratio | Table 2; Results | 0.71 | sample OR (0 × 177)/(71 × 23) = 0; exact conditional MLE 0 |
| B4 95% CI | Table 2; Results | 0.66–0.77 | exact conditional CI 0–0.45; with 0.5 added to each cell, OR 0.053 (0.003–0.881) |
| B4 CI width on the log scale | Table 2 | 0.154 | 5.63 for the 0.5-corrected OR (36 times wider) |
| Statistic that does match 0.71 (0.66–0.77) | Table 2 | — | P(control | B4-negative) / P(control | B4-positive) = (177/248)/(23/23) = 0.714 (0.660–0.772) |
| B4 p | Table 2; Results | 0.001 | Fisher exact two-sided 0.0009 (matches); Pearson 0.0028; Yates 0.0062 |
| B4 adjusted OR | Abstract; Results | 0.82 (0.71–0.85), p = 0.007 | no finite maximum-likelihood estimate: all 23 B4 carriers are controls, so the B4 coefficient is quasi-completely separated with or without age and sex in the model. The printed CI is also off-centre on the log scale (geometric midpoint 0.777, not 0.82) |
| M8&Z | Table 2 | OR 1.36 (1.27–1.47) | sample OR 0 (0/71 vs 5/200); 0.5-corrected 0.249 (0.014–4.552). Matching statistic: P(control | positive)/P(control | negative) = 1.364 (1.269–1.467) |
| Y | Table 2 | OR 1.36 (1.26–1.46) | sample OR 0 (0/71 vs 1/200); 0.5-corrected 0.930 (0.037–23.092). Matching statistic: P(control | positive)/P(control | negative) = 1.357 (1.263–1.457) |
| D | Table 2 | OR 3.90 (3.18–4.78), p = 0.068 | sample OR infinite (2/71 vs 0/200); 0.5-corrected 14.424 (0.684–304.150). Matching statistic: P(BA | positive)/P(BA | negative) = 3.899 (3.181–4.778). The printed CI excludes 1 while the printed p (Fisher 0.0679) does not reach 0.05 |
| C p | Table 2 | 1.456 | Fisher 0.456; row Z, with identical counts, prints 0.456. A probability cannot exceed 1 |
| The 14 rows without a zero cell | Table 2 | ORs and CIs | all 14 ORs reproduce to two decimals and the CIs to within rounding, e.g. E 11.88 (1.30–108.16), Fisher p 0.0177 vs 0.018 |
| E adjusted OR (side note) | Abstract; Results | 7.36 (1.22–94.6) | CI geometric midpoint 10.74, not 7.36; cannot be checked further without individual data |
The ratios of proportions that match the zero-cell rows are not oriented the same way: for B4 the B4-negative group is the numerator, whereas for M8&Z, Y and D the carrier group is the numerator. In the opposite orientation M8&Z would give 0.733 (0.682–0.788). For the two rows whose p-values differ from Fisher's test, F (0.324) and D5 (0.372), the printed values equal Pearson's chi-square p (0.3240 and 0.3723), which the Methods allow ("as appropriate"), so I do not count them as errors.
Figure
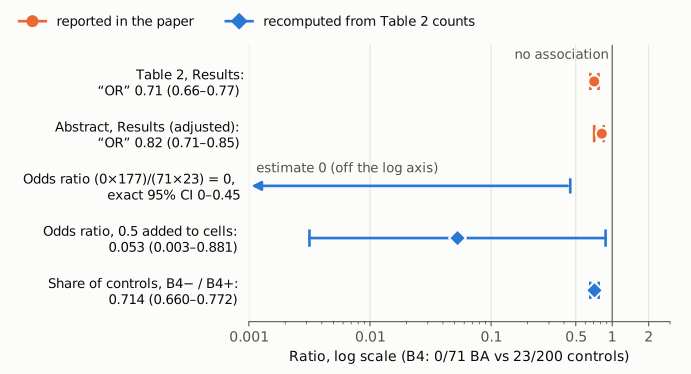
Figure 1. Haplogroup B4, 0 of 71 BA patients vs 23 of 200 controls, on one logarithmic ratio axis with the null value 1 marked by a thin vertical line. Orange marks the values the paper prints: the "OR" 0.71 (0.66–0.77) of Table 2 and the Results, and the adjusted "OR" 0.82 (0.71–0.85) of the Abstract and Results. Blue marks values recomputed from the Table 2 counts. The sample odds ratio is 0, which a log axis cannot show, so its exact 95% CI is drawn as an arrow from 0.45 towards zero. The odds ratio with 0.5 added to each cell is 0.053, with a CI (0.003–0.881) spanning more than two orders of magnitude. The bottom row is the ratio of the proportion of controls among B4-negative participants to that among B4-positive participants, 0.714 (0.660–0.772), which reproduces the printed 0.71 (0.66–0.77). The printed intervals are narrow enough to sit almost inside their markers. All values come from Table 2 or from recompute.py.txt.
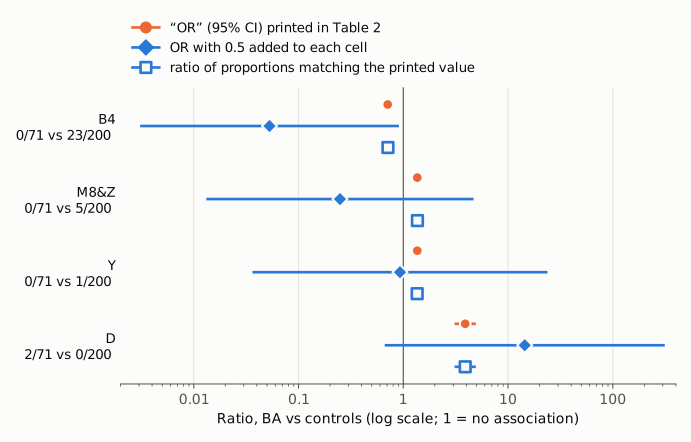
Figure 2. The four rows of Table 2 with an empty cell (B4, M8&Z, Y and D), on one logarithmic axis with the null value 1 marked. For each row, the top orange marker is the printed "OR" with its 95% CI, the blue diamond is the odds ratio with 0.5 added to each cell with its Woolf CI, and the hollow blue square is the ratio of proportions that matches the printed value. In every row the printed value and interval coincide with the ratio of proportions, not with any odds ratio, and the printed intervals are one to two orders of magnitude narrower than the counts allow. For M8&Z and Y the printed value lies above 1 although no BA patient carries the haplogroup.
Why it matters
B4 is the paper's headline genetic result. It appears in the title, the Abstract, the Author Summary, the Discussion and the Conclusion, and it is the reason the in vitro work compares a B4 cybrid with an E cybrid. The printed crude OR of 0.71 describes a 29% reduction in odds with a tight interval (0.66–0.77). The counts show something different in both size and certainty: no BA patient carried B4, so the data are compatible with anything from no carriers at all to an odds ratio of about 0.45 (exact CI), or 0.003 to 0.88 with a 0.5 correction. A reader using 0.71 (0.66–0.77) in a meta-analysis or a power calculation would carry over an effect measure of the wrong kind with a standard error about 36 times too small on the log scale.
The adjusted estimate in the Abstract, OR 0.82 (0.71–0.85), p = 0.007, is affected more seriously. With no B4 carrier among the cases, the logistic-regression likelihood keeps increasing as the B4 odds ratio goes to 0 (the script prints the profile log-likelihood at 0.1, 0.01 and 0.001), and adding age and sex as covariates cannot change that. Standard software then reports either no estimate or a very large negative coefficient with a very large standard error, not a finite OR with a narrow interval. Table 1 also shows that the BA patients are aged 0.1–11 years and the adult controls 18–60 years, so age alone separates the cases from three-quarters of the controls; any age-adjusted model of these data is fragile for that reason too.
What survives: the direction of the B4 association and its crude significance (Fisher exact p = 0.0009, matching the printed 0.001). The E association (crude OR 11.88) recomputes correctly, as do the other 13 rows without a zero cell. The cybrid experiments do not depend on Table 2's effect sizes. The finding is therefore a misreported key effect estimate and an adjusted estimate that cannot exist as stated, not an overturned conclusion. The errors in the M8&Z, Y and D rows matter less on their own, but the M8&Z and Y values point the wrong way (above 1 with no exposed cases), and the D interval contradicts its own p-value.
Explanations considered
- A different control group. If B4 had been compared against only one control group, the counts would differ. Table 1 gives 5 + 18 = 23 carriers among the 200 pooled controls, matching Table 2, and the Methods say the two control groups were "put together for statistical calculation". No subset of the controls gives an OR near 0.71 with 0 exposed cases, since any odds ratio with 0 exposed cases is 0.
- A zero-cell correction or an exact method. Adding 0.5 to each cell gives 0.053 (0.003–0.881); the exact conditional estimate is 0 with CI 0–0.45; the Firth estimate equals the 0.5-corrected one. None comes near 0.71, and none can give a CI as narrow as 0.66–0.77 from a table with an empty cell.
- A text-conversion or typesetting error. The publisher's PDF of the version of record prints the same Table 2 values as PMC and Europe PMC, cell for cell, and the Results text repeats 0.71 (0.66–0.77) independently of the table. The values are not a conversion artefact.
- A copying slip from the neighbouring row F, whose correct OR is also 0.71. Row F's CI is 0.36–1.41, so this would explain the B4 point estimate but not its interval. The ratio of proportions reproduces both the point estimate and both CI limits for B4, and it also reproduces M8&Z, Y and D, so it accounts for all four rows where a copying slip accounts for one number.
- A ratio of proportions reported under the heading OR. This fits every zero-cell row exactly. SPSS Crosstabs, the package named in the Methods, prints such ratios as "For cohort" risk estimates next to the odds ratio. This explains the numbers but does not make them odds ratios: they answer a different question (the relative probability of being a control, or a case, by carrier status), their orientation differs between rows, and they are not the measure the text and table headings name.
- The adjusted model used individual data that differ from Table 2. I cannot rule this out without the data. But Tables 1 and 2 agree that no BA patient carries B4, and with that the adjusted B4 odds ratio has no finite maximum-likelihood value whatever the other covariates are.
- Row C's p-value. A p-value of 1.456 is not a probability; row Z, with the same counts, prints 0.456, which matches Fisher's test. This reads as a typographical error and does not change any conclusion.
Status
- Version of record. Table 2 in the publisher's PDF (journals.plos.org, 11 pages, Table 2 on page 3) matches the PMC and Europe PMC full text for every row cited here. The PLOS HTML Abstract and Results give the same B4 and E numbers.
- Supplements. The article has two supplements: Figure S1 (characterisation of the ρ0 cells and the B4 and E cybrids) and Table S1 (full mitochondrial sequences of haplogroups B4 and E). Neither holds case-control counts or regression output, and no individual-level data are available.
- Corrections and comments. As of 2026-10-23 I found no correction, erratum, expression of concern or retraction. Crossref lists no update relations for the DOI; PMC and Europe PMC list no correction or comment links (PMID 23966875); the PLOS article page shows no correction notice and no reader comments. The PubPeer API refused automated access (HTTP 403), so PubPeer could not be checked directly; a web search for the article with "correction", "erratum" and "PubPeer" found no thread or notice for this paper.
- Sources. PMC article PMC3744426; publisher page and PDF at journals.plos.org/plosgenetics (doi:10.1371/journal.pgen.1003696); Europe PMC record and full-text XML; Crossref; PubPeer (blocked); web search.
Suggested correction
- Replace the B4 effect estimate in Table 2 and the Results with an estimate that suits a zero cell, for example the exact conditional OR (0; 95% CI 0–0.45) or a 0.5-corrected or Firth OR (0.053; 95% CI 0.003–0.88), and state the method. Alternatively, report the carrier proportions (0/71 vs 23/200) with Fisher's exact p = 0.0009.
- Withdraw or replace the adjusted B4 estimate in the Abstract and Results (OR 0.82, 0.71–0.85, p = 0.007). If an adjusted analysis is kept, use a method that handles separation (Firth-penalised or exact logistic regression) and report its estimate and interval. Recheck the adjusted E estimate (7.36, 1.22–94.6), whose interval is not centred on it on the log scale.
- Correct the OR and CI columns of Table 2 for rows M8&Z, Y and D in the same way, and correct the p-value for row C from 1.456 to 0.456.
- State in the Methods which test produced each p-value in Table 2 (Fisher's exact test or Pearson's chi-square).