← Back to the plain-language case
Reported renal-cancer P=0.004 is P=0.24 under the paper's own stated Fisher test
JAMA (2010) · doi:10.1001/jama.2010.1877 · PMC3655326
Summary
The paper compares the prevalence of cancers in Cowden or Cowden-like (CS/CSL) patients with germline KILLIN promoter methylation against patients with germline PTEN mutations. The Abstract and the Results both report renal cell carcinoma in 4/45 methylation-positive patients and 6/155 PTEN-mutation-positive patients, with P=0.004. The Methods say these prevalences were compared with a two-tailed Fisher exact test. On those counts that test gives P=0.237 (odds ratio 2.42; exact 95% CI 0.48–10.72), and none of the other standard tests for a 2×2 table gives a value below P=0.09. The renal association is one of the two cancer risks named in the abstract Conclusions, and the Comment bases advice on kidney surveillance and test prioritization on it. The paper's primary finding (methylation in 45/123 patients) and its breast-cancer comparison are not affected.
What the paper reports
Abstract, Results:
Individuals with KILLIN-promoter methylation had 3-fold increased prevalence of breast cancer (35/42 vs 24/64, P<0.0001) and a >2-fold increase of kidney cancer (4/45 vs 6/155, P=0.004) over those with germline PTEN mutations.
Abstract, Conclusions:
Germline KILLIN- methylation is common among CS/CSL patients, and associated with increased risks of breast and renal cancer over PTEN mutation-positive patients. These observations need to be replicated.
Results, paragraph "Prevalent Cancers in Pathogenic PTEN Mutation Positive versus KILLIN Methylation":
Renal cell carcinoma was over-represented in the methylation positive subjects over PTEN mutation positive individuals (4/45 vs 6/155, P=0.004).
Methods, "Statistical Analysis":
The prevalence of component malignancies between KILLIN promoter methylation positive patients and germline pathogenic PTEN mutation positive patients was compared using the Fisher’s 2-tailed exact test with P<0.05 considered to be significant.
Comment, second paragraph:
Patients with CS-like features, especially where breast cancer and/or renal carcinomas are present in the individual and/or family, should be offered KILLIN methylation analysis first
Comment, third paragraph:
In contrast to germline PTEN mutations, germline methylation of the KILLIN promoter confers a significantly higher prevalence of female invasive breast cancer and renal cell carcinomas. The current national practice guidelines for those with PTEN germline mutations includes heightened surveillance of the female breasts and thyroid, but do not have awareness of renal cancer risk. If our observations of two- to three-fold increased risks of renal and/or breast cancer with KILLIN germline methylation over those of PTEN mutation holds, then extra vigilance for the organs-at-risk, breast and kidneys, is warranted.
Comment, "Conclusions":
Among CS/CSL patients, presence of germline KILLIN gene promoter hypermethylation was common and was associated with increased risk of breast and renal cancer compared with PTEN mutation-positive patients.
Every quote was checked verbatim against the article as archived in PubMed Central (the author manuscript). The publisher's version of record gives the same counts and P value in JAMA house style ("4/45 vs 6/155; P = .004").
What the paper's own numbers show
Method. The reported counts give the 2×2 table [[4, 41], [6, 149]]: renal cell carcinoma present or absent among 45 methylation-positive and 155 PTEN-mutation-positive patients. I applied the test the Methods name (two-tailed Fisher exact), then the other common tests for this table, to see whether any of them gives 0.004. I also worked out which counts would be needed to reach P=0.004. As a control, I recomputed the breast-cancer comparison from the same sentence and the methylation prevalence the same way. Every value below is printed by recompute.py.txt (scipy 1.18.1). The paper has no tables holding these counts; they appear only in the text.
| Quantity | Location | Reported | Recomputed |
|---|---|---|---|
| Renal prevalence, methylated vs PTEN | Abstract Results; Results | 4/45 vs 6/155, ">2-fold" | 8.9% vs 3.9%; prevalence ratio 2.30 (consistent) |
| Expected renal cases among the 45 if prevalence were equal | derived | — | 2.25 (observed 4; 10 cases among 200 patients) |
| Fisher exact, two-tailed (the test the Methods name) | Abstract Results; Results | P=0.004 | P=0.237 |
| Fisher exact, one-tailed | same counts | — | P=0.164 |
| Fisher one-tailed mid-p | same counts | — | P=0.106 |
| Pearson chi-square, uncorrected / Yates-corrected | same counts | — | P=0.174 / 0.331 |
| Barnard / Boschloo exact, two-sided | same counts | — | P=0.212 / 0.208 |
| Exact binomial, 4/45 against a fixed rate of 6/155 (one-sided) | same counts | — | P=0.096 |
| Odds ratio (sample), Wald 95% CI, Wald P | same counts | not reported | 2.42 (0.65–8.99), P=0.186 |
| Odds ratio (conditional MLE), exact 95% CI | same counts | not reported | 2.41 (0.48–10.72) |
| Renal cases among the 45 needed for two-tailed Fisher P≤0.004 (PTEN group held at 6/155) | sensitivity | 4 | 8 (P=0.0038) |
| Renal cases among the 45 needed for P<0.05 (PTEN group held at 6/155) | sensitivity | 4 | 6 (P=0.029) |
| PTEN-group renal cases needed for P≤0.004 (methylated group held at 4/45) | sensitivity | 6/155 | 0/155 (P=0.0023); 1/155 gives P=0.0096 |
| Breast cancer, 35/42 vs 24/64 (control check) | Abstract Results; Results | P<0.0001 | Fisher two-tailed P=3.1×10⁻⁶ (consistent) |
| Methylation prevalence (control check) | Abstract Results | 45/123, 37% (95% CI 29–45%) | 36.6%; Wald 28.1–45.1%, exact 28.1–45.7% (consistent) |
The reported P value is about 1/59 of the value the stated test gives. The ">2-fold" prevalence ratio is correct. Only the P value, and the claim of statistical significance that rests on it, do not follow from the counts.
A smaller point, which does not change any conclusion: the Abstract calls the breast-cancer difference a "3-fold increased prevalence", but 35/42 vs 24/64 is 83.3% vs 37.5%, a prevalence ratio of 2.22 (odds ratio 8.33).
Figure
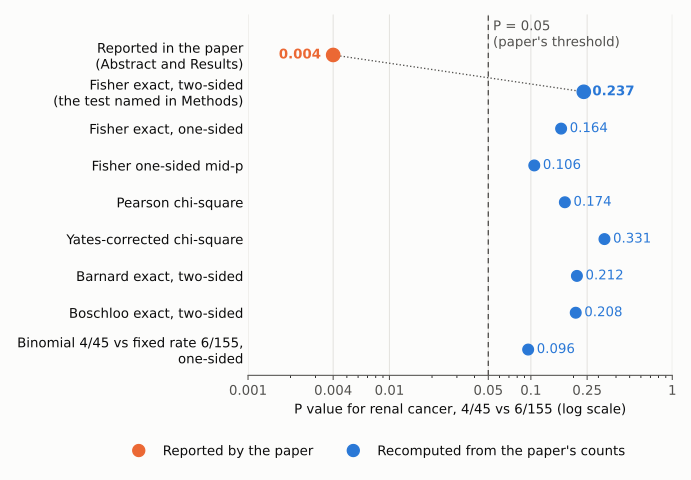
Figure 1. P values for renal cell carcinoma in 4/45 KILLIN-methylation-positive vs 6/155 PTEN-mutation-positive patients, on one logarithmic axis. The orange point is the value reported in the Abstract and Results (P=0.004). Blue points are recomputed from the same counts; the larger blue point is the two-tailed Fisher exact test named in the Methods (P=0.237), joined to the reported value by a dotted line. The dashed line marks the paper's significance threshold, P=0.05. Every recomputed value lies to the right of the threshold, between 0.096 and 0.331, so the conclusion does not depend on the choice of test.
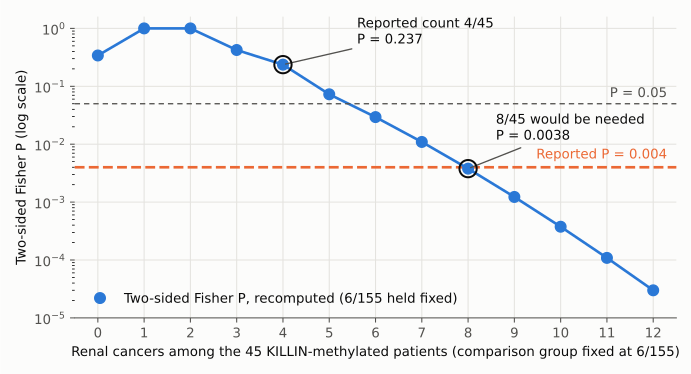
Figure 2. Two-tailed Fisher exact P (blue, log scale) for x/45 methylation-positive patients with renal cancer against the reported 6/155 in the PTEN-mutation group, for x from 0 to 12. At the reported count of 4/45 the test gives P=0.237. The reported P=0.004 (orange dashed line) is first reached at 8/45 (P=0.0038), twice the reported count. A count of 6/45 would be needed to cross P=0.05.
Why it matters
- It changes significance. With the stated test, the renal comparison is far from the paper's own threshold of P<0.05 (P=0.24). The exact 95% CI for the odds ratio, 0.48–10.72, includes 1. With only 10 renal cancers among 200 patients, the data are compatible both with no difference and with a large one.
- It is a headline result. "Prevalence of component cancers in methylation-positive and PTEN mutation-positive patients" is a listed Main Outcome Measure. The renal association appears in the Abstract Results, the Abstract Conclusions ("associated with increased risks of breast and renal cancer") and the closing Conclusions.
- Clinical advice depends on it. The Comment says that current PTEN guidelines "do not have awareness of renal cancer risk", that "extra vigilance for the organs-at-risk, breast and kidneys, is warranted", and that patients with renal carcinomas in the individual or family should be offered KILLIN methylation analysis first. With the P value corrected, the paper's data no longer give statistically significant support for the kidney part of this advice.
- What is not affected. The primary finding (germline methylation in 45/123 PTEN-mutation-negative CS/CSL patients), the expression experiments, and the breast-cancer association (recomputed P=3.1×10⁻⁶) do not depend on this number. The paper itself calls the observations in need of replication and notes that the small sample "may result in type II error".
Explanations considered
- A different test was used. This does not account for the value. The Methods name the test exactly ("Fisher’s 2-tailed exact test"). I also tried one-tailed Fisher, mid-p, chi-square with and without continuity correction, Barnard, Boschloo, a binomial test against a fixed reference rate, and a Wald test on the odds ratio. The smallest result, 0.096, is 24 times larger than 0.004 (Figure 1).
- A slip between sections, or in conversion to PMC. This does not account for the value. The counts and the P value are identical in the Abstract and the Results, and the publisher's version of record matches the PMC archive. The values are plain text in prose, so no table cell, minus sign or decimal-point conversion is involved. A typographical error in the P value itself remains possible, but no standard analysis of the stated counts gives a value that rounds to 0.004.
- The counts, rather than the P value, are in error. Possible, but the paper gives no basis for it. The denominator 45 matches the number of methylation-positive patients reported elsewhere (45 of 123). With the PTEN group fixed at 6/155, reaching P≤0.004 requires 8/45 renal cancers. With the methylated group fixed at 4/45, it requires 0/155 in the PTEN group (P=0.0023). Keeping 6 PTEN-group cases, the group would have to be several times larger (6/500 gives P=0.0059; 6/1000 gives P=0.0005). The paper reports none of these figures. The 155-patient PTEN-mutation group is not described further in the text, whereas the breast comparison uses 64 PTEN-mutation-positive women.
- Other denominators in the paper. These do not account for the value. Substituting the breast-comparison denominators (4/42 vs 6/64), or 4/45 vs 6/64, gives P=1.0; 4/42 vs 6/155 gives P=0.225.
- Adjustment, stratification or person-time analysis. None is described. The paper reports crude prevalences, and the Methods name only the Fisher test for this comparison.
- The supplement holds a different analysis. Not verified. PMC lists one supplementary file. According to the text it holds the CS diagnostic criteria, primer sequences and a per-patient list of the methylation-positive individuals (eTable 1). It could not be retrieved (see Status). Nothing in the text says it holds a different renal analysis. eTable 1 might confirm or change the count of 4 renal cancers among the 45, but no table can make 4/45 vs 6/155 give P=0.004 under the stated test.
- Rounding. P=0.237 cannot round to 0.004.
None of these explanations accounts for the reported value.
Status
As of 2026-10-23:
- Version of record. The publisher's page (jamanetwork.com/journals/jama/fullarticle/10.1001/jama.2010.1877; JAMA 2010;304(24):2724) shows the same counts and "P = .004" in both the Abstract Results and the Results, and the same Methods wording on the two-tailed Fisher test. The PubMed abstract (PMID 21177507) and the PMC author manuscript (NIHMS467022) agree.
- Supplement. One file is listed in PMC ("KLB Supp_data_JAMA_revised.doc"). It could not be retrieved: the PMC download returned a proof-of-work/captcha page, Europe PMC reports the article as outside the open-access subset, and the JAMA supplemental-content tab showed no file link to an automated fetch. Its contents as described in the text are listed above.
- Corrections and notices. None found. The Crossref
updatesfilter for this DOI returns 0 records (re-queried 2026-10-23), and the work record has noupdate-toorupdated-by. PMC and Europe PMC list no correction or retraction notice (src/known.py). PubMed links only an accompanying editorial (JAMA 2010;304(24):2744-5) as "Comment in", and no erratum. The JAMA article page shows no correction notice. - PubPeer and other discussion. Earlier web searches found no PubPeer thread and no published comment on this point. The PubPeer API could not be queried directly (Cloudflare block, again on 2026-10-23), and a fresh web search on 2026-10-23 could not be run because the session's search budget was exhausted. Press coverage at the time repeated the >2-fold kidney-cancer finding.
- Sources. PMC3655326 (local archive via
src/show.py); the publisher's version of record; Crossref API; PubMed E-utilities; Europe PMC; web searches for correction, erratum and PubPeer. Recomputation:recompute.py.txtin this folder.
Suggested correction
In the Abstract Results and in the Results paragraph on prevalent cancers, replace "P=0.004" for renal cell carcinoma (4/45 vs 6/155) with the two-tailed Fisher exact value, P=0.24, and preferably give the odds ratio with its exact 95% CI (2.41, 0.48–10.72). Then revise the statements that rest on this result: the abstract Conclusions, the Comment ("confers a significantly higher prevalence of ... renal cell carcinomas", and the kidney-surveillance and testing-priority statements) and the closing Conclusions. They could say that renal cancer was more common in the methylation-positive group (8.9% vs 3.9%) but that the difference was not statistically significant in this sample. If the counts, rather than the P value, are in error, the correction should give the correct counts and describe the 155-patient PTEN-mutation comparison group. Separately, the breast-cancer difference described as "3-fold" corresponds to a prevalence ratio of 2.2 (83.3% vs 37.5%).