← Back to the plain-language case
The abstract's Y-maze P = 0.065, called significant, conflicts with the Results' P = 0.015
BMC Med (2013) · doi:10.1186/1741-7015-11-90 · PMC3616817
Summary
The paper reports the same Y-maze spatial-novelty comparison (control IgG vs 16/6-Id-injected mice) three ways. The abstract gives 42% vs 9% at P = 0.065 and calls the difference "significantly higher". The Results text gives 46% vs 9% at P = 0.015, and the Figure 2 legend gives 0.46 vs 0.09 at P = 0.02. The paper prints no Y-maze SEMs, so I measured the means and SEMs from the Figure 2 bars. A t-test rebuilt from those values, with the group sizes in Methods, gives P = 0.015. That matches the Results text and the legend; it does not match the abstract's 42% or P = 0.065. The abstract also attaches a P-value above the paper's own 0.05 threshold to a claim of significance.
What the paper reports
Abstract, Results:
Similarly, the preference for spatial novelty in the Y-maze test was significantly higher in the control group compared to the 16/6-Id-injected mice (42% vs. 9%, respectively, P = 0.065).
Results, "Cognitive and behavioral performance":
The control IgG mice spent 46% additional time in the new lane while the mice injected with 16/6-Id spent 9% additional time in the new lane (P = 0.015 by t-test).
Figure 2 legend:
Results are presented as the proportion of time (mean ± SEM) spent in the new arm introduced by the 16/6-Id (gray bars) and IgG control (black bars) injected mice.
There was a significant difference in additional time spent in the new lane between the 16/6 and IgG group (0.46 vs. 0.09, P = 0.02 respectively). * Statistically significant (P <0.05).
Methods, "Experimental design":
Twenty-one CH3 mice were injected ICV to the right hemisphere, 11 with human 16/6-Id antibodies and 10 with commercial human IgG antibodies (control).
Methods, "Statistical analysis":
The differences in mean for average immobility time in the FST, the staircase test parameters (number of rearing and stair-climbing events), novel object recognition and Y-maze tests were evaluated by T-test. Significant results were determined as P <0.05.
What the paper's own numbers show
Method. The text gives no Y-maze SEMs and no per-mouse data. I therefore measured the two bars of Figure 2 from the pixels of the open-access image in PubMed Central (1741-7015-11-90-2.jpg, 600 × 430 px). The axis ticks sit at row 378 (0%) and row 25 (100%). The intermediate ticks check the scale: they read 60.1 and 39.9. One pixel equals 0.28 percentage points. I took the bar tops as the means and the error-bar caps as mean + SEM. From these I rebuilt a two-sample t-test (SD = SEM × √n) with n = 10 control and n = 11 16/6-Id from Methods. I then varied every measured edge by ±1 px, the group sizes, the test (Student vs Welch) and one- vs two-sided P. recompute.py.txt downloads the image, checks its SHA-256, and prints every number below.
| Quantity | Location | Reported | Recomputed |
|---|---|---|---|
| Control preference | Abstract | 42% | 46.7% (Fig. 2 bar) |
| Control preference | Results text / Fig. 2 legend | 46% / 0.46 | 46.7% (Fig. 2 bar) |
| 16/6-Id preference | Abstract / Results / legend | 9% / 9% / 0.09 | 10.5% (Fig. 2 bar) |
| SEM, control / 16/6-Id | Fig. 2 error bars | not stated in numbers | 12.5 / 6.2 points |
| Between-group P, Student t, n = 10/11 | Abstract | 0.065 | 0.015 (±1 px on every edge: 0.011–0.020) |
| Between-group P, Student t, n = 10/11 | Results text | 0.015 | 0.015: matches |
| Between-group P | Fig. 2 legend | 0.02 | 0.015 rounds to 0.02: consistent |
| Between-group P, Welch t, n = 10/11 | — | — | 0.022 (±1 px: 0.016–0.028) |
| P with the abstract's means (42 vs 9) and the figure's SEMs | Abstract | 0.065 | 0.025 (Student) – 0.034 (Welch) |
| P with other group sizes (11/10, 10/10, 9/11, 8/8) | — | — | 0.013–0.026 |
| P with only 5 mice per group | — | — | 0.032 (Student) – 0.041 (Welch) |
| SE of the difference: figure / needed for P = 0.065 | derived | — | 13.5 / 18.9 points (difference 37) or 16.8 (difference 33) |
| |t| needed, df 19: P = 0.065 vs P = 0.015 | derived | — | 1.96 vs 2.67 |
| Ratio 0.065 / 0.015 | derived | — | 4.33 (a one- vs two-sided mix-up gives exactly 2) |
No variant I tried reproduces P = 0.065. Every variant built from the figure, including those that use the abstract's own 42% vs 9%, falls below 0.05. With the figure's means and SEMs, Student P reaches 0.065 only with groups of 2 to 3 mice (n = 3 gives 0.060; n = 2 gives 0.121), and the study injected 10 and 11.
Figure
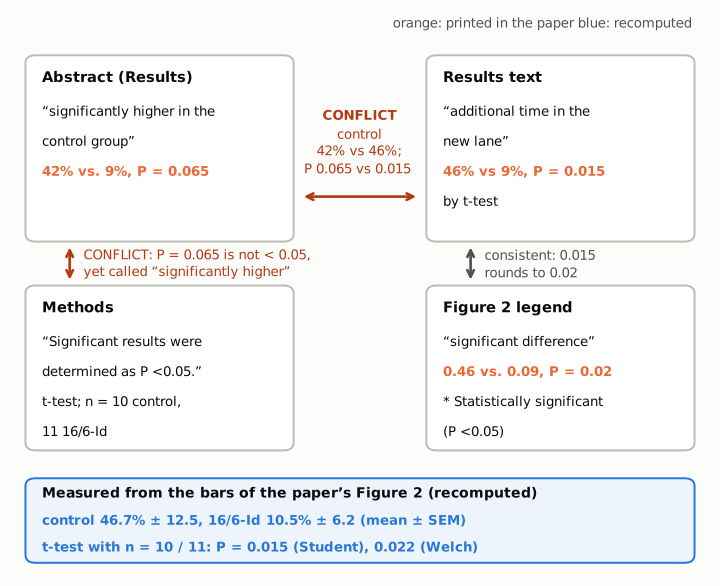
The conflicting excerpts, quoted from the paper (printed numbers in orange). The horizontal connector marks the conflict between the abstract (42% vs 9%, P = 0.065) and the Results text (46% vs 9%, P = 0.015). The left vertical connector marks the conflict inside the abstract: P = 0.065 is not below the Methods threshold of P < 0.05, yet the result is called "significantly higher". The right vertical connector shows that the legend's P = 0.02 agrees with the Results text after rounding. The blue box gives the means and SEMs measured from the bars of the paper's Figure 2 and the t-test rebuilt from them, which support the Results text.
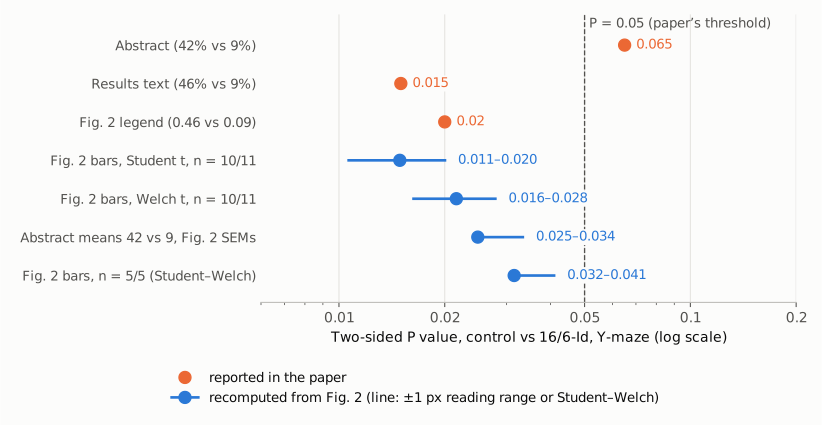
Two-sided P values for the control vs 16/6-Id Y-maze comparison on one log axis. Orange dots are the three values printed in the paper. Blue dots are recomputed from the Figure 2 bars. Their lines show the range when every measured edge moves by ±1 px (Student and Welch rows), or the span between the Student and Welch tests (other rows). The dashed line is the paper's threshold, P = 0.05. Only the abstract's P = 0.065 lies above it. Every recomputed value lies below it, including the one that uses the abstract's own means.
Why it matters
The abstract is the part of the paper most readers see, and it is what indexing services reproduce. As written, it reports a non-significant P-value under a claim of significance. A reader of the abstract alone cannot tell whether the spatial-memory effect met the paper's threshold. The direction of the effect is the same in all three versions: the controls prefer the new arm by 33 or 37 percentage points more than the injected mice.
The Y-maze is the paper's only test of spatial memory. It is the sole support for the "spatial" half of the Discussion's statement that the antibody caused "a selective cognitive impairment, expressed as visual recognition and spatial memory deficits". It also supports the Discussion's statement that "the 16/6-Id is related to spatial novelty and visual recognition memory impairments in mice", which the paper uses to argue for hippocampal involvement. The headline conclusion of cognitive impairment rests also on the novel object recognition test (P = 0.012) and on immunohistochemistry. If the Results text and Figure 2 are correct, as the measured bars indicate, the conclusions stand and only the abstract needs correcting. If the abstract's P = 0.065 were correct, the spatial-memory claim would not meet the paper's own criterion. Without per-mouse data that cannot be ruled out with certainty, although the figure argues against it.
Explanations considered
- Rounding. P = 0.015 rounds to 0.02, which accounts for the legend. No rounding turns 0.015 into 0.065, and none turns 46% (or the measured 46.7%) into 42%.
- One-sided vs two-sided test. Halving or doubling a P-value gives a ratio of 2. The ratio 0.065 / 0.015 is 4.33. The figure gives a one-sided P of 0.007 and a two-sided P of 0.015, so neither matches 0.065.
- Student vs Welch t-test. From the figure, Student gives 0.015 and Welch gives 0.022. Both are below 0.05 and both are far from 0.065.
- Fewer mice in the Y-maze (exclusions). The Methods for the object recognition test allow animals to be excluded, so the Y-maze groups might be smaller than 10/11. With the figure's means and SEMs, P is 0.013–0.026 for 8–11 mice per group and 0.032–0.041 for 5 per group. It reaches 0.065 only at 2–3 mice per group. Nothing in the paper suggests groups that small.
- A different scale for the preference measure. The Methods define the index as (new − old)/(new + old), while the legend speaks of the "proportion of time" in the new arm. Converting between these scales is linear, so t and P do not change. A change of scale also cannot move one mean (46 to 42) while leaving the other (9) the same.
- The abstract's numbers come from a different analysis or an earlier dataset. This cannot be checked from the paper. Even taking the abstract's 42% vs 9% with the figure's SEMs gives P = 0.025–0.034. To reach 0.065, the standard error of the difference would have to be 16.8 points; the figure shows 13.5.
- A non-parametric test. A rank test on 10 and 11 mice could give a larger P than the t-test. The paper, however, states that the Y-maze was analysed by t-test, and reports no other test. This cannot be ruled out without per-mouse data, but nothing in the paper supports it.
- A typographical slip (0.015 printed as 0.065, 46 as 42). This would account for the numbers but cannot be confirmed from the paper. Even so, it would not account for the abstract calling P = 0.065 significant.
- A conversion or archiving error. Ruled out. The publisher's version of record carries the same text as PMC and Europe PMC.
Separately, and outside the claim above, the novel object recognition result for the 16/6-Id group is given as P = 0.655 in the Results text but P = 0.5 in the Figure 1 legend. The Figure 1 bars for that group read 51.4% (new) and 39.5% (old), against 56% and 44% in the text. The control bars (63.9% and 36.1%) match the text's 64% and 36%. Neither value changes that the 16/6-Id group showed no significant preference.
Status
As of 2026-10-24:
- Version of record. The publisher's page (link.springer.com/article/10.1186/1741-7015-11-90, reached from doi.org through bmcmedicine.biomedcentral.com; "Published: 04 April 2013") carries the same abstract, Results, Figure 2 legend and Methods wording as PMC and Europe PMC. The discrepancy is in the version of record.
- Supplements. The article has no supplementary material. The publisher lists only the authors' original image files. Figure 2 is the nearest thing to source data, and I measured it as described above.
- Corrections and notices. None found. Crossref has no update-to or updated-by relation; its only relation is an F1000 recommendation (has-review). PMC and Europe PMC list no correction, erratum, expression of concern or retraction. Europe PMC lists only a "Comment in" link to the related commentary (BMC Med 2013;11:91), which is an editorial, not a correction. Crossref's Retraction Watch data show no entry, and the publisher's page has no update notice.
- PubPeer. The PubPeer API required human verification, so it could not be queried directly. A web search found no PubPeer thread about this article.
- Sources. The PMC archive of the article (PMC3616817); PMC open-access image 1741-7015-11-90-2.jpg (s3://pmc-oa-opendata/PMC3616817.1/); the Springer/BMC article page; Europe PMC full-text XML and annotations; Crossref metadata for doi:10.1186/1741-7015-11-90.
Suggested correction
If the Results text and Figure 2 are correct, as the measured bars indicate, the abstract's sentence could read:
Similarly, the preference for spatial novelty in the Y-maze test was significantly higher in the control group compared to the 16/6-Id-injected mice (46% vs. 9%, respectively, P = 0.015).
If the abstract's P = 0.065 is the correct value, the word "significantly" should be removed from the abstract, and the Results text and Figure 2 legend should be brought into line with it. The Discussion and Conclusions should then be qualified where they rely on a spatial-memory deficit. Either way, stating the Y-maze group sizes and SEMs, or depositing the per-mouse preference indices, would settle which value is correct. The same would resolve the Figure 1 legend's P = 0.5 against the Results text's P = 0.655 for the 16/6-Id group in the object recognition test.