← Back to the plain-language case
Fisher exact P reported as 0.0005 for 1/6 versus 7/18 remissions; the counts give 0.62
Clin Cancer Res (2012) · doi:10.1158/1078-0432.CCR-12-2442 · PMC3596113
Summary
The Discussion of this phase I trial compares the CR/CRi rate (complete remission plus complete remission with incomplete recovery) between dose groups of SCH 900776: 1 of 6 patients (17%) below 40 mg/m² and 7 of 18 (39%) at 40 mg/m² or above, reported as "P = 0.0005, Fisher exact test". The counts agree with Table 3, Table 4, the Results text and the abstract. A Fisher exact test on them gives a two-sided P of 0.62 (one-sided 0.32), and with 6 and 18 patients and 8 responders no table in the reported direction can reach a P below 0.066. This is the only P value in the paper, and the Discussion uses it as statistical support for a dose-response that would point to a contribution of SCH 900776 itself; the trial's toxicity-based dose-finding conclusions do not depend on it.
What the paper reports
The comparison and its P value (Discussion, paragraph 1):
Indeed, the CR/CRi rate was 1 of 6 (17%) for patients who received <40 mg/m2 SCH 900776 versus 7 of 18 (39%) for those receiving ≥ 40 mg/m2 (P = 0.0005, Fisher exact test).
The sentence immediately before it, which states the claim the P value supports (Discussion, paragraph 1; the PMC text prints "doseresponse", the publisher's HTML "dose-response"):
The notion that part of the responses might relate to adding SCH 900776 to the timed sequential cytarabine infusions is supported by the presence of a doseresponse curve, with clinical responses to SCH 900776 beginning at 40 mg/m2, in conjunction with Cmax exceeding 1,000 ng/mL.
The same counts, without a P value (Results, "Clinical outcome"):
Similarly, the overall response rate (CR plus CRi) was 8 of 24 (33%), with 1 CRi (17%) of 6 patients treated with SCH 900776 doses of ≤ 20 mg/m2 and 7 (39%; 5 CR, 2 CRi) of 18 patients treated at dose level 3 (40 mg/m2) or higher, with at least 2 of 6 (33%) in each of dose levels 3 through 5.
Abstract, Results:
Complete remissions occurred in 8 of 24 (33%) patients, with 7 of 8 at 40 mg/m2 or higher.
Table 3 ("Dose escalation and clinical outcome for 24 adults with relapsed or refractory acute leukemia"), dose-level labels and the "Response (CR/CRi)" column, condensed to one line with the archived typography kept:
- 10 mg/m2 (n = 3): 1 · 2. 20 mg/m2 (n = 3): 0 · 3. 40 (mg/m2 (n = 6): 3 · 4. 56 (mg/m2 (n = 6): 2 · 5. 140 mg (n = 6): 2 · Total: 8
Table 4 lists the 8 responders individually, at dose levels 1, 3, 3, 3, 4, 4, 5 and 5.
The authors' caveats, later in the same paragraph (Discussion, paragraph 1):
we cannot exclude the possibility that some or all of the responders might have responded to timed sequential cytarabine without SCH 900776
Moreover, the small sample size and heterogeneous nature of this patient population preclude any ability to draw accurate conclusions about additive or synergistic clinical effects of adding SCH 900776 to cytarabine
The statistics subsection of the Methods names no hypothesis test (Methods, "Statistical considerations"):
The primary objective was to determine the combination-recommended phase II dose (RP2D) by assessing the safety, tolerability, DLT, and antileukemic activity (CR rate) of the combination of cytarabine and SCH 900776 in adult patients with relapsed and/or refractory acute leukemias.
What the paper's own numbers show
Method. I rebuilt the 2×2 table from Table 3. Dose levels 1–2 (10 and 20 mg/m², 3 patients each) form the group below 40 mg/m²: 1 + 0 = 1 responder of 6. Dose levels 3–5 (40 mg/m², 56 mg/m² and a flat 140 mg that the paper states is equivalent to 80 mg/m²; 6 patients each) form the group at or above 40 mg/m²: 3 + 2 + 2 = 7 responders of 18. Table 4's responder dose levels and the abstract's "7 of 8" give the same split. The table is therefore [[1 responder, 5 non-responders], [7, 11]]. I ran Fisher's exact test with scipy and cross-checked it by enumerating the hypergeometric distribution directly. I also ran the usual alternatives for a 2×2 table, two tests across all five dose levels, and enumerated every table with the same margins (6 vs 18 patients, 8 responders). Every number below is printed by recompute.py.txt.
| Quantity | Location | Reported | Recomputed from the paper's numbers |
|---|---|---|---|
| CR/CRi below 40 mg/m² | Discussion ¶1; Results; Table 3 | 1 of 6 (17%) | 1/6 = 16.7% (Table 3: 1 + 0 of 3 + 3) |
| CR/CRi at or above 40 mg/m² | Discussion ¶1; Results; Table 3; abstract | 7 of 18 (39%); "7 of 8" | 7/18 = 38.9% (Table 3: 3 + 2 + 2 of 6 + 6 + 6); Table 4: 7 of 8 responders at level ≥ 3 |
| Fisher exact test, below vs at or above 40 mg/m² | Discussion ¶1 | P = 0.0005 | two-sided P = 0.6214, 1,243 times larger |
| Fisher exact, one-sided (fewer responses below 40 mg/m²) | – | – | P = 0.3191 |
| Odds ratio, ≥ 40 vs < 40 mg/m² | – | – | sample 3.18; conditional MLE 3.05, exact 95% CI 0.25 to 171.6 |
| Exact 95% CIs for the two response rates | – | – | 16.7% (0.4% to 64.1%) and 38.9% (17.3% to 64.3%) |
| Pearson chi-square / Yates-corrected chi-square | – | – | P = 0.3173 / 0.6171 |
| Barnard / Boschloo exact unconditional tests | – | – | P = 0.4090 / 0.3761 |
| Cochran-Armitage trend over the 5 dose levels | – | – | P = 0.7423 (scores 1–5); 0.7159 (mg/m²); 0.6541 (log dose) |
| Fisher-Freeman-Halton exact test, 2×5 dose levels | – | – | P = 0.8265 |
| Smallest two-sided Fisher P in the reported direction, same margins | – | – | P = 0.0664, at 0/6 vs 8/18 |
| Tables with these margins giving P ≤ 0.0005 | – | – | only 6/6 vs 2/18 (P = 0.00021), the reverse of the reported pattern |
| Responders needed at ≥ 40 mg/m² for P ≤ 0.0005 if the low-dose group stays at 1/6 | – | – | 18 of 18 (P = 0.00014) |
The arithmetic of the counts and percentages is correct; only the P value is not. It is 1,243 times smaller than the two-sided Fisher P for the stated counts and lies below the smallest value that any table with these margins can produce in the reported direction (0.066). With 8 responders among 24 patients, 2.0 responders would be expected in the low-dose group if response did not depend on dose; 1 was observed.
Figure
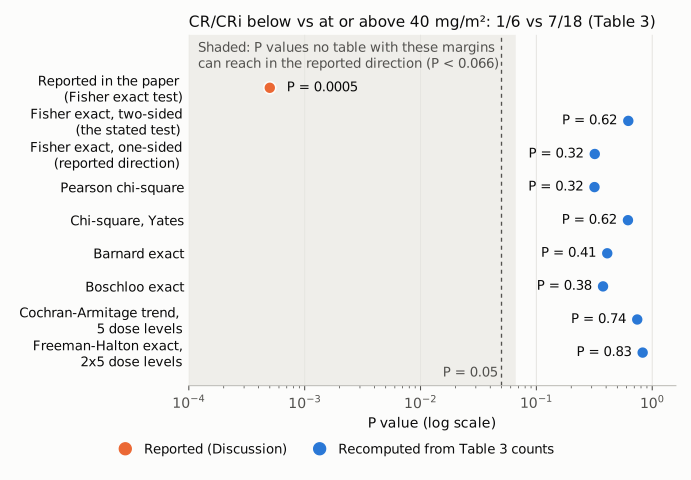
Figure 1. P values for CR/CRi below vs at or above 40 mg/m² (1/6 vs 7/18, Table 3) on one logarithmic axis. The orange point is the value printed in the Discussion (P = 0.0005, Fisher exact test). The blue points are recomputed from the paper's own counts: the stated test (Fisher exact, two-sided, and one-sided in the reported direction), common alternatives for a 2×2 table (Pearson and Yates chi-square, Barnard and Boschloo exact tests), and two tests across the five dose levels (Cochran-Armitage trend, Fisher-Freeman-Halton). The dashed line marks P = 0.05 for reference. The shaded region (P < 0.066) contains P values that no 2×2 table with the paper's margins can produce in the reported direction. All recomputed values lie between 0.32 and 0.83.
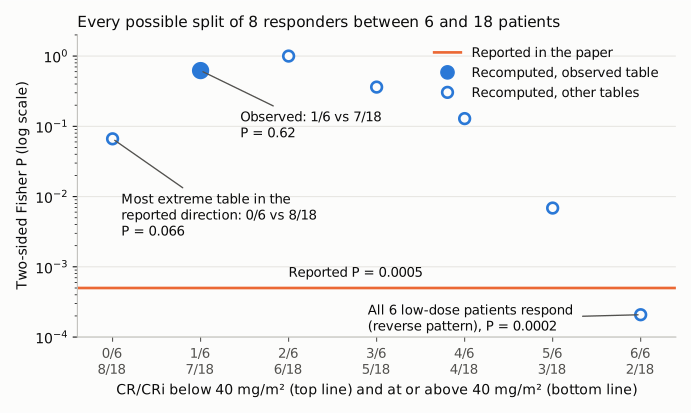
Figure 2. With the margins fixed by the paper (6 patients below 40 mg/m², 18 at or above, 8 responders), only seven 2×2 tables are possible. Each is labelled on the horizontal axis by its responder counts, below 40 mg/m² on the top line and at or above 40 mg/m² on the bottom line. Blue markers give the two-sided Fisher P for each table; the filled marker is the observed table (P = 0.62). The orange line is the reported P = 0.0005. Only the table in which all 6 low-dose patients respond, the opposite of the reported pattern, falls below it. The most extreme table in the reported direction (0/6 vs 8/18) gives P = 0.066.
Why it matters
The P value is the only formal statistical result in the paper. The Discussion presents it as evidence for a dose-response, and uses the dose-response to support "the notion that part of the responses might relate to adding SCH 900776" to cytarabine. As printed, it reads as strong evidence that response rates differ between the dose groups. Computed from the paper's own counts, the two-group comparison gives P = 0.62, the trend test across all five dose levels gives P = 0.65 to 0.74 depending on scoring, and the exact 95% CI for the odds ratio runs from 0.25 to 172. With 6 patients in the lower-dose group, the data are consistent both with no dose effect and with a large one; they do not establish a dose-response either way.
The error is limited in scope. It is not in the title, the abstract or any table. The abstract gives only correct counts ("8 of 24 (33%)", "7 of 8 at 40 mg/m2 or higher"), although its emphasis on the 7 of 8 carries the same dose-response reading, now without statistical support. The phase I conclusions (feasibility and tolerability, the dose-limiting toxicities at 140 mg, the recommended phase II dose of 100 mg, about 56 mg/m², the pharmacokinetics and the H2Ax observations) rest on other data and are unaffected. The raw counts are printed next to the P value, and the authors state in the same paragraph that the small, heterogeneous sample precludes firm conclusions about added effect. Even so, a reader who takes the P value at face value, for example when judging whether the dose-response signal justifies a randomized trial, or when citing the paper as evidence of activity attributable to the Chk1 inhibitor, would overestimate that signal considerably.
Three smaller inconsistencies, separate from the P value and not affecting any conclusion, turned up during the check:
- Results, "Clinical outcome": day-14 complete tumor clearance at the two lowest doses is given as "2 of 6 (17%)"; 2/6 is 33% (Table 3: 1 + 1 of 3 + 3).
- The CR/CRi split differs between tables. Table 3 and the Results text give 5 CR and 3 CRi, with "3 (2/1)" at dose level 3. Table 4 lists three CRs at dose level 3 and 6 CR and 2 CRi overall. The combined CR/CRi counts, which the P value concerns, are the same in both.
- Discussion, paragraph 5: "2 of 10 (20%) patients with a complex karyotype achieved CR/CRi versus 5 of 14 (36%)" covers all 24 patients but sums to 7 of the 8 responders.
Explanations considered
- A different test, or a one-sided test. Fisher one-sided gives 0.32 and two-sided 0.62; Pearson chi-square 0.32 and Yates-corrected 0.62; Barnard 0.41 and Boschloo 0.38; the Cochran-Armitage trend test 0.65 to 0.74 and the 2×5 Freeman-Halton test 0.83. None comes within two orders of magnitude of 0.0005, and the Methods describe no other analysis. Does not account for the value.
- Different counts, grouping or cut-point. The 1/6 vs 7/18 split is confirmed independently by Table 3, Table 4, the Results text and the abstract, so the 2×2 table is fixed. Placing the 140 mg flat dose anywhere at or above 40 mg/m² does not change it. Other cut-points on the same data (below 20, 56 or 80 mg/m²) each give a Fisher P of 1.00. Keeping 1/6 in the low-dose group, the high-dose group would need 18 of 18 responders to reach P ≤ 0.0005. Does not account for the value.
- The P value belongs to another comparison. The nearest is CR/CRi in patients with day-14 tumor clearance against those with residual leukemia (8 of 12 vs 0 of 12, from the Results text): two-sided P = 0.0013, one-sided 0.00067. That is the same order of magnitude but not the same number, the paper attaches no P value to that comparison, and the sentence clearly refers to the dose groups. Other comparisons in the paper give larger values: day-14 clearance by dose group (2/6 vs 10/18) 0.64, AML vs other leukemias (8/21 vs 0/3) 0.53, complex karyotype vs not (2/10 vs 5/14) 0.65. A one-sample test of 7/18 against an assumed historical response rate gives 0.00002 (against 5%) or 0.0012 (against 10%); neither matches, and the sentence describes a two-group Fisher test. Does not account for the value; the source of 0.0005 cannot be identified from the paper.
- A typographical slip, such as misplaced digits. Cannot be excluded, but neither "0.05" nor "0.5" matches the correct two-sided value of 0.62, so a simple digit shift does not reconcile the numbers. Does not reconcile the numbers.
- An error introduced in the archived manuscript. The PMC copy is the NIH author manuscript. An archived copy of the publisher's full-text page (see Status) contains the identical sentence, "(P = 0.0005, Fisher exact test)", together with the same Results counts and abstract. The value is plain text with no superscripts or special characters that a conversion could alter. Ruled out for the sentence.
- Patient-level or supplementary data that would change the table. The paper has no supplementary material. Table 3's per-level counts and Table 4's per-patient dose levels fully determine the 2×2 table. Ruled out.
Status
As of 2026-10-23:
- Version of record. The live publisher site (aacrjournals.org, reached through the doi.org redirect) returned HTTP 403 and a browser-verification page to automated access, as did the publisher PDF link listed in Crossref. I therefore checked an Internet Archive capture of the publisher's full-text HTML (clincancerres.aacrjournals.org/content/18/24/6723.full, captured 2021-10-19; citation metadata Clin Cancer Res 18(24):6723–6731). It contains the Discussion sentence word for word, including "(P = 0.0005, Fisher exact test)", the same Results paragraph and the same abstract. Table 3 is not rendered inline in that capture, so the table itself was checked only in the PMC copy, where it agrees with the Results text and Table 4. The PMC copy (NIHMS author manuscript) matches the publisher text in every passage compared, apart from the hyphen in "dose-response".
- Supplements. None. The PMC record has no supplementary material, Europe PMC lists none, and the archived publisher page links none.
- Corrections, retractions, expressions of concern. None found. The repository's
known.pycheck returned no Crossref update relations, no PMC notices and no Europe PMC notices. The Crossref record has no update-to, updated-by or relation entries, and the PubMed record has no comment/correction links. - PubPeer. Could not be checked directly: both the PubPeer search page and its browser-extension API returned HTTP 403 / Cloudflare verification to automated access. Earlier web searches for the DOI and title with "PubPeer", "erratum" and "correction" found no thread or notice; a fresh web search could not be run for this write-up.
- Sources. PMC3596113 (as archived in PubMed Central); doi:10.1158/1078-0432.CCR-12-2442; Internet Archive capture of the publisher's full-text page dated 2021-10-19; Crossref and Europe PMC records; ClinicalTrials.gov NCT00907517 (no per-patient results that bear on these counts).
Suggested correction
The sentence in Discussion paragraph 1 could read: "Indeed, the CR/CRi rate was 1 of 6 (17%) for patients who received <40 mg/m2 SCH 900776 versus 7 of 18 (39%) for those receiving ≥ 40 mg/m2 (P = 0.62, two-sided Fisher exact test)." Because neither this comparison nor a trend test across the five dose levels (P ≈ 0.7) supports a dose-response at this sample size, the preceding sentence's statement that the responses are "supported by the presence of a dose-response curve" could be qualified as a descriptive observation. If the reported value came from a different comparison, the correction should say which one. Separately, "2 of 6 (17%)" for day-14 tumor clearance at ≤ 20 mg/m² should read "2 of 6 (33%)", and the CR/CRi breakdown at dose level 3 and the karyotype counts could be reconciled between Table 3, Table 4 and the Discussion.