← Back to the plain-language case
Abstract's 95% CI for the borderline-use socioeconomic odds ratio (0.45–0.60) differs from Table 5's 0.32–0.81
BMJ (2012) · doi:10.1136/bmj.e1805 · PMC3328544
Summary
The abstract's worked example says that, at medical schools using the UKCAT only in borderline cases, applicants from socioeconomic class 4 or 5 had lower odds of a conditional offer: odds ratio 0.51, 95% confidence interval 0.45 to 0.60. Table 5, which the abstract draws on, gives the same odds ratio with a much wider interval, 0.51 (0.32 to 0.81), P = 0.004. The table's odds ratio, interval and P value agree with each other. The abstract's interval is 3.2 times narrower on the log scale, and its bounds are exactly those Table 5 prints for a different predictor in a different model (state-school attendance at factor-use schools, 0.52, 0.45 to 0.60). The direction and significance of the finding do not change, but the abstract overstates the precision of its headline socioeconomic estimate about 3.2-fold.
What the paper reports
Abstract, Results:
For example, a candidate from a non-professional background was much less likely to receive a conditional offer of a place compared with an applicant from a higher social class when applying to an institution using the test only in borderline cases (odds ratio 0.51, 95% confidence interval 0.45 to 0.60). No such effect was observed for such candidates applying to medical schools using the threshold approach (1.27, 0.84 to 1.91). These differences were generally reflected in the interactions observed when the analysis was repeated, pooling the data.
Table 5 (multilevel multiple logistic regression, outcome a conditional offer), block "UKCAT scores for borderline cases (n=7558)†" (columns: odds ratio (95% CI), P value, ICC):
Socioeconomic class 4 or 5‡ | 0.51 (0.32 to 0.81) | 0.004 | 0.23
Table 5, block "UKCAT scores as factor for admissions (n=8163)†":
Attendance at state (non-grammar) school | 0.52 (0.45 to 0.60) | <0.001 | 0.12
Socioeconomic class 4 or 5‡ | 0.62 (0.42 to 0.91) | 0.01 | 0.12
Table 5, block "UKCAT scores as threshold (n=6564)†":
Socioeconomic class 4 or 5‡ | 1.27 (0.84 to 1.91) | 0.3 | 0.13
Results, "Multilevel multiple logistic regression: applications" (the same state-school interval cited in the text):
Nevertheless this finding was consistent with the results from the separate models for the prediction of conditional offer provision (table 5) in that medical schools using UKCAT as a factor in the admissions process showed a relatively high degree of disadvantage for state school students (0.52, 0.45 to 0.60, P<0.001) even after controlling for the effects of other, potentially confounding, variables and interactions.
Methods, definition of the group:
As in previous research on widening participation we classified those who gave themselves a socioeconomic classification rating of four or more as being from a non-professional background.
Other estimates for the same predictor, checked as possible sources (Table 3, univariate, conditional offer, borderline / factor / threshold; Table 6, unconditional offer, borderline block; Table 7, pooled conditional-offer model):
Socioeconomic class 4 or 5‡ | 0.31 (0.19 to 0.50) | <0.001 | 0.34 | | 0.51 (0.40 to 0.65) | <0.001 | 0.38 | | 0.50 (0.33 to 0.76) | 0.001 | 0.49
Socioeconomic class 4 or 5‡ | 0.61 (0.39 to 0.95) | 0.03 | <0.001
Socioeconomic class*-borderline use interaction | 0.52 (0.29 to 0.91) | 0.02 | NA | NS
What the paper's own numbers show
Method. A 95% Wald interval for a logistic-regression odds ratio is exp(b ± 1.96·SE), where b is the log odds ratio. The standard error can be recovered from the printed limits as SE = (ln upper − ln lower) / (2 × 1.96), the point estimate should sit at the geometric midpoint √(lower × upper), and the two-sided P value is 2·(1 − Φ(|ln OR| / SE)). I applied this to the abstract interval, to the Table 5 row it summarises, and to every other socioeconomic estimate in the paper that could have been its source. I also checked the full rounding range of the printed values and every other odds ratio quoted in the abstract. All numbers below are printed by recompute.py.txt.
| Quantity | Location | Reported | Recomputed from the paper's numbers |
|---|---|---|---|
| Borderline use, SES 4/5, conditional offer | Abstract, Results | 0.51 (0.45 to 0.60); no P given | log width 0.288, SE 0.073, midpoint 0.520; implied P ≈ 4.5 × 10⁻²⁰ |
| Same estimate | Table 5, borderline block | 0.51 (0.32 to 0.81), P = 0.004 | log width 0.929, SE 0.237, midpoint 0.509, z = −2.84, P = 0.0045: consistent |
| Table 5 P over rounding range of OR and limits | derived | P = 0.004 | 0.0032 to 0.0062: includes 0.004 |
| Interval implied by Table 5's OR 0.51 and P = 0.004 | derived | 0.32 to 0.81 | 0.322 to 0.807 (0.320 to 0.812 for P = 0.0045) |
| Width of Table 5 interval relative to abstract | derived | — | 3.23 times as wide on the log scale |
| State (non-grammar) school, factor use | Table 5, factor block; Results text | 0.52 (0.45 to 0.60), P < 0.001 | same bounds as the abstract; midpoint 0.520 |
| Abstract interval midpoint, rounding range of limits | derived | 0.45 to 0.60 | 0.515 to 0.525 (fits 0.52 best; does not by itself exclude 0.51) |
| SES 4/5, factor use | Table 5, factor block | 0.62 (0.42 to 0.91), P = 0.01 | SE 0.197, P = 0.015; not the abstract interval |
| SES 4/5, threshold use (the abstract's comparator) | Abstract; Table 5, threshold block | 1.27 (0.84 to 1.91), P = 0.3 | identical in abstract and table; SE 0.210, P = 0.25 |
| SES 4/5, univariate, borderline / factor | Table 3 | 0.31 (0.19 to 0.50) / 0.51 (0.40 to 0.65) | neither matches 0.45 to 0.60 |
| SES 4/5, unconditional offer, borderline | Table 6 | 0.61 (0.39 to 0.95) | does not match |
| SES × borderline-use interaction, pooled | Table 7 | 0.52 (0.29 to 0.91), P = 0.02 | SE 0.292; does not match |
| Smallest SE possible with about 431 low-SES applications (5.7% of 7558, assuming the Table 1 share holds in the model sample) | Table 1; Table 5 n | — | √(4/431) = 0.096 unadjusted, before covariates and clustering; the abstract's 0.073 is below it, Table 5's 0.237 is above it |
| Low-SES applications needed for SE 0.073 | derived | — | at least 743 (9.8% of 7558) |
| Borderline vs threshold contrast, SES 4/5 (ratio 0.51/1.27) | Abstract; Table 5 | "No such effect ... threshold approach" | ratio 0.40; with Table 5 SEs: 95% CI 0.22 to 0.75, z = −2.88, P = 0.0039; with the abstract SE: CI 0.26 to 0.62, P = 4 × 10⁻⁵ |
| Other abstract ORs: 1.74 (1.25 to 2.41), 1.60 (0.97 to 2.62), 5.19 (2.02 to 13.33), 2.15 (1.03 to 4.48) | Abstract; Tables 11 and 12 | as in abstract | all identical to the tables |
| Abstract OR 3.57 (1.03 to 12.39), low-SES entrants | Abstract; Table 12 | 0.28 (0.08 to 0.97), borderline v factor | reciprocal 3.57 (1.03 to 12.5): consistent within rounding |
Table 5's socioeconomic row is internally consistent: its interval is centred on its odds ratio and reproduces its P value. The abstract's interval is not consistent with that row: it implies a standard error less than a third as large, and a P value about 10¹⁷ times smaller (about 9 × 10¹⁶) than the 0.004 printed in Table 5. Its bounds, 0.45 and 0.60, are exactly those of the state-school row in the factor-use block of the same table, whose odds ratio, 0.52, sits closer to the interval's geometric midpoint. A rough count-based check points the same way: if the Table 1 share applies, with about 431 low-SES applications in the borderline-use model, no adjusted estimate could have a log-odds-ratio SE as small as 0.073. Every other odds ratio and interval quoted in the abstract matches its table.
Figure
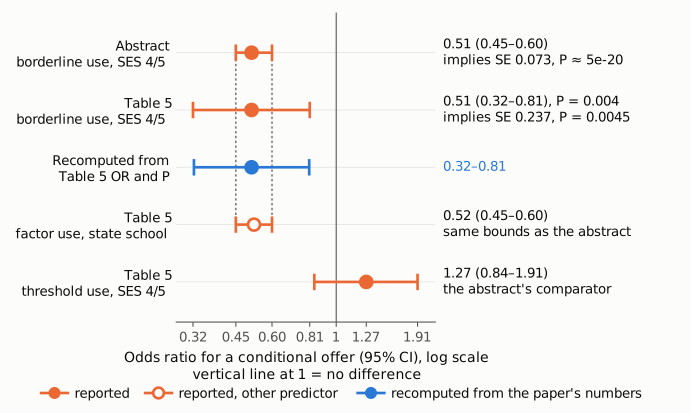
Figure 1. Odds ratios for a conditional offer with 95% confidence intervals on one logarithmic axis; the vertical line marks an odds ratio of 1. Orange: values printed in the paper (filled for socioeconomic class 4 or 5, hollow for the state-school predictor). Blue: the interval recomputed from Table 5's odds ratio 0.51 and P = 0.004, which reproduces Table 5's printed interval. The abstract interval (top row) is about a third as wide as the Table 5 interval for the same estimate (second row). The dotted guides show that its bounds coincide with those of state-school attendance in the factor-use model (fourth row). The threshold-use estimate (bottom row) is the comparator the abstract quotes, and it matches Table 5.
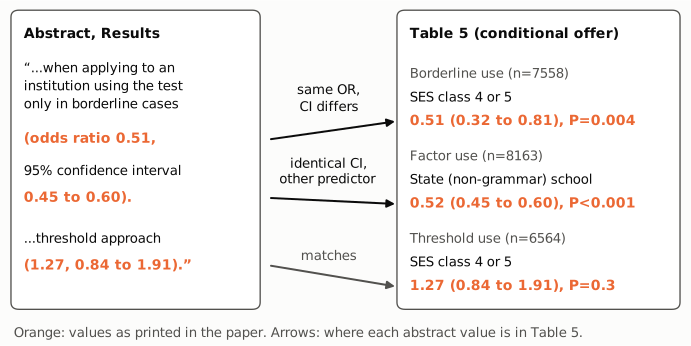
Figure 2. The abstract sentence (left) and the three Table 5 rows (right) that hold its numbers. The odds ratio 0.51 and the comparator 1.27 (0.84 to 1.91) match the socioeconomic rows of the borderline-use and threshold-use models. The interval 0.45 to 0.60 does not match the borderline-use socioeconomic row, which gives 0.32 to 0.81. It is identical to the interval for state-school attendance in the factor-use model.
Why it matters
The sentence is the abstract's only worked example of the paper's main claim, that disadvantage for under-represented groups depends on how schools use the UKCAT. Readers who see only the abstract are told that the socioeconomic disadvantage at borderline-use schools is estimated precisely, with a reduction in odds of 40% to 55%. The paper's own model gives a reduction of 19% to 68%, with P = 0.004 instead of the P of about 10⁻²⁰ that the abstract interval implies. The estimate rests on a small group: about 5.5% of applicants reported a non-professional background, and the Discussion itself says that because of these small numbers the study may have lacked power to detect differences between categories of medical school.
The error does not reverse any conclusion. Both intervals exclude 1, so the direction and statistical significance of the borderline-use result are unchanged. The contrast with threshold-use schools (1.27, 0.84 to 1.91) also survives with the correct interval: the ratio of the two odds ratios is 0.40 (95% CI 0.22 to 0.75, P ≈ 0.004 if the two models are treated as independent), and the pooled interaction in Table 7 gives 0.52 (0.29 to 0.91, P = 0.02). The main conclusions, the "What this study adds" box and the tables are unaffected. The affected reader is anyone who quotes or meta-analyses the abstract figure, or who judges from it how precisely the socioeconomic effect is known. Such a reader would take the uncertainty to be about a third of what the data support.
Explanations considered
- Conversion or typesetting error in the archived text. This does not account for the numbers. The PMC text and the publisher-deposited JATS XML in Europe PMC both carry "0.45 to 0.60" in the abstract and "0.51 (0.32 to 0.81)" in the correct Table 5 cell, in the borderline-use block. No minus signs, superscripts or decimal commas are involved. The publisher's own HTML and PDF on bmj.com could not be fetched (see Status).
- Rounding. This does not account for the numbers. Over the full rounding range of the printed odds ratio and limits, the Table 5 row gives P between 0.0032 and 0.0062, which includes the printed 0.004. The abstract interval gives P between 10⁻²³ and 10⁻¹⁷. A rounding change cannot turn a 0.93-wide log interval into a 0.29-wide one.
- A different model for the same predictor. This does not account for the numbers. None of the paper's other socioeconomic estimates has the interval 0.45 to 0.60: the factor-use model in Table 5 (0.42 to 0.91), the univariate models in Table 3 (0.19 to 0.50 for borderline use, 0.40 to 0.65 for factor use, 0.33 to 0.76 for threshold use), the unconditional-offer model in Table 6 (0.39 to 0.95), and the pooled interaction in Table 7 (0.29 to 0.91). The abstract's comparator (1.27, 0.84 to 1.91) matches Table 5 exactly, which identifies Table 5 as the source.
- The multiple-imputation sensitivity analysis. This is very unlikely to account for the numbers. Those results are not in the paper; they were placed on an author-hosted web page that could not be retrieved. The abstract SE is 3.23 times smaller than Table 5's, which would need about 10.4 times as many observations. Imputing the missing data could at most bring in the rest of the borderline-use sample (Table 1 lists 10 086, against 7558 applications in the model), which would shrink the SE only to about 0.205. The Results ("Missing data analysis") also say the imputed odds ratios differed from the complete-case ones by around 5% to 10%, and by 12% on average in the one exception, and the abstract point estimate is the complete-case value, 0.51.
- A different confidence level. This does not account for the numbers. With Table 5's standard error, 0.45 to 0.60 would be about a 46% interval, and the abstract labels it 95%.
- Copying of the adjacent state-school interval. This fits all the numbers, but the paper cannot confirm it. The bounds are identical to the factor-use state-school row of Table 5, which the Results text also cites as "(0.52, 0.45 to 0.60, P<0.001)". The abstract interval's geometric midpoint (0.520) matches that row's odds ratio, while 0.51 sits only at the edge of its rounding range.
Status
- Version of record. bmj.com returned HTTP 403 to every automated request: the DOI redirect, the article page, the full-text PDF and the rapid-responses page. Three PDF mirrors (bmj.com, the Durham repository and the Europe PMC render) returned bot-check pages instead of PDFs. I therefore checked the text in the publisher-deposited full text: the PMC article page (pmc.ncbi.nlm.nih.gov/articles/PMC3328544) and the Europe PMC full-text XML for PMC3328544. Both carry the abstract sentence and the Table 5 cells quoted above, with identical values. Every quotation above was confirmed verbatim against the PMC-archived text with
src/show.py. - Supplements. The journal published no data supplement. The Europe PMC supplementary-files package for PMC3328544 contains only the two article figures, and the XML has no supplementary-material element. The Data sharing statement points to an author-hosted page with further multiple-imputation details, which returned HTTP 403. The applicant-level data are not public, so the model cannot be refitted. Because Table 5 is internally consistent, the correct interval can be identified without them.
- Corrections and comments. As of 2026-10-24 I found no correction, erratum, expression of concern or retraction. Crossref lists no update relations for the DOI, and PMC and Europe PMC list no correction notices. A web search for corrections or comments on the article found none. The PubPeer API refused automated access (HTTP 403), so PubPeer could not be checked directly. BMJ rapid responses could not be read (HTTP 403).
- Sources. PMC article PMC3328544; Europe PMC full-text XML and supplementary-files endpoint for PMC3328544; Crossref metadata for 10.1136/bmj.e1805; PMC and Europe PMC correction notices; a web search.
Suggested correction
- In the abstract's Results, replace "(odds ratio 0.51, 95% confidence interval 0.45 to 0.60)" with "(odds ratio 0.51, 95% confidence interval 0.32 to 0.81)", the interval given for this estimate in Table 5 (P = 0.004).
- No other change appears to be needed: Table 5, the Results text and the other abstract odds ratios agree with each other. If the multiple-imputation estimate was meant instead, report it with its own interval and say so in the abstract.