← Back to the plain-language case
Abstract's 95% CI for the duration effect of tricyclics excludes its own point estimate
BMJ (2010) · doi:10.1136/bmj.c5222 · PMC2958257
Summary
The abstract reports that the benefit of tricyclic antidepressants for headache grew with treatment duration, with a metaregression slope of β = −0.11 and a 95% confidence interval of −0.63 to −0.15 (P < 0.0005). The point estimate −0.11 lies 0.04 above the upper limit of its own interval, which cannot happen for a 95% CI of any estimate. The interval's midpoint is −0.39, and its width implies a standard error under which −0.11 would have P ≈ 0.37, not P < 0.0005. The Results give only subgroup slopes, both internally consistent: tension-type −0.16 (−0.23 to −0.10) and migraine −0.09 (−0.14 to −0.04). These support the direction and significance of the abstract's finding, so the error concerns the printed precision of one abstract result, not the conclusion's direction.
What the paper reports
The PMC-archived text prints minus signs as hyphens; the quotations below keep that form. Every quotation was checked verbatim against the PMC text with src/show.py.
Abstract, Results:
The effect of tricyclics increased with longer duration of treatment (β=-0.11, 95% confidence interval -0.63 to -0.15; P<0.0005).
Abstract, Conclusions:
The effectiveness of tricyclics seems to increase over time.
Results, "Tricyclics versus placebo", second paragraph:
For both headache types this beneficial effect increased over time (tension-type: β=-0.16, 95% confidence interval -0.23 to -0.10, P<0.0005, migraine: β=-0.09, -0.14 to -0.04, P=0.001, fig 3). Therefore for every additional week of treatment with a tricyclic, the number of headaches were reduced by 0.16 standard deviations.
Fig 3 legend:
Fig 3 Effect of tricyclic antidepressants compared with placebo over time. SMD=standardised mean difference
Results, "Assessment of bias and sensitivity analyses":
Metaregression found no effect of any other variables abstracted on summary outcomes, with the exception of study duration. Duration explained 32.4% of the heterogeneity for continuous outcomes and 27.3% of the variance for dichotomous outcomes.
Methods, "Statistical analysis":
We pooled data using the DerSimonian and Laird random effects model
Because of the large number of analyses, we used P=0.01 as our threshold for significance.
All analyses were done using Stata (v 11.2).
Discussion, "Strengths and weaknesses of the study":
This analysis should be viewed as exploratory rather than definitive.
The average duration of the trials in our study was 11 weeks and the longest only 26 weeks; consequently our timeline was constrained to four to 26 weeks.
What the paper's own numbers show
Method. A 95% confidence interval produced by metaregression (as in Stata) is estimate ± 1.96 SE, so it must contain the estimate, and its half-width gives the SE. I checked whether each printed estimate lies inside its interval, took the midpoint and implied SE of each interval, and converted estimate ÷ SE into a two-sided P value to compare with the printed P. The paper reports no overall (pooled) duration slope outside the abstract. As a plausibility check on the abstract's −0.11, I pooled the two Results subgroup slopes by inverse variance (fixed effect). This is an approximation, not a re-run of the authors' metaregression, which used study-level data I do not have. Every number below is printed by recompute.py.txt.
| Quantity | Location | Reported | Recomputed from the paper's own numbers |
|---|---|---|---|
| Overall duration slope: is the point inside its CI? | Abstract, Results | β = −0.11 (−0.63 to −0.15) | No. −0.11 is 0.04 above the upper limit −0.15 |
| Midpoint of the abstract interval | Abstract, Results | — | −0.39 |
| SE implied by the abstract interval width (0.48) | Abstract, Results | — | 0.1225 |
| P for β = −0.11 with that SE | Abstract, Results | P < 0.0005 | z = −0.90, P = 0.37 |
| Interval symmetric about −0.11 keeping the printed upper limit | Abstract, Results | — | lower limit −0.07, above the upper limit −0.15 (impossible) |
| Tension-type slope | Results, "Tricyclics versus placebo", para 2; Fig 3 | −0.16 (−0.23 to −0.10), P < 0.0005 | inside CI; midpoint −0.165; SE 0.0332; z = −4.82; P = 1.4 × 10⁻⁶. Consistent |
| Migraine slope | Results, para 2; Fig 3 | −0.09 (−0.14 to −0.04), P = 0.001 | inside CI; midpoint −0.090; SE 0.0255; z = −3.53; P = 0.0004. Consistent (printed P slightly conservative) |
| Inverse-variance pool of the two subgroup slopes | Derived from Results | (abstract: −0.11) | −0.116 (−0.156 to −0.076), z = −5.74, P = 9.6 × 10⁻⁹; width 0.079, one-sixth of the abstract's 0.48 |
| Heterogeneity between the two slopes | Derived from Results | — | Cochran Q = 2.80 on 1 df, P = 0.09 |
| One possible reading: a dropped zero, −0.063 to −0.15 (hypothesis) | Abstract, Results | — | contains −0.11; midpoint −0.1065; SE 0.0222; z = −4.96; P ≈ 7 × 10⁻⁷, which matches P < 0.0005 |
| Total change over the 11-week average trial at the printed lower limit | Abstract; Discussion (11 weeks) | −0.63 per week | −6.93 SD, against an overall SMD of −0.96 for tricyclics vs placebo (Results) |
Three separate checks point the same way. The printed point estimate is outside its interval. The printed interval width is inconsistent with the printed P value: if the SE were 0.12, as the width implies, −0.11 would be far from significant. And the printed interval is six times wider than the pooled interval of the two subgroups and wider than either subgroup interval, whereas an estimate that uses both subgroups would normally be more precise than either one alone. The point estimate and the P value, by contrast, agree with the subgroup results.
Figure
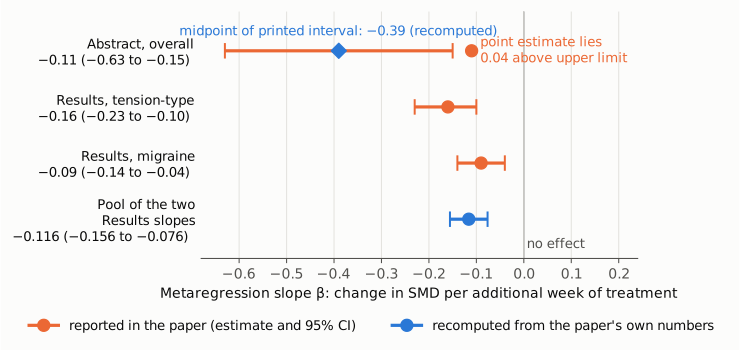
Figure 1. Metaregression slopes of the standardised mean difference (SMD) per additional week of treatment, with 95% confidence intervals, on one linear axis; the vertical line at 0 marks no effect of duration. Orange: values printed in the paper, namely the abstract's overall slope −0.11 (−0.63 to −0.15) and the Results subgroup slopes for tension-type −0.16 (−0.23 to −0.10) and migraine −0.09 (−0.14 to −0.04). Blue: values recomputed from those printed numbers, namely the midpoint of the abstract's interval (−0.39, diamond) and the inverse-variance pool of the two subgroup slopes, −0.116 (−0.156 to −0.076). The abstract's point estimate sits outside its interval; the subgroup estimates sit inside theirs, and the pooled subgroup estimate lies close to the abstract's −0.11 with a much narrower interval.
Why it matters
- An impossible interval in the abstract. The abstract is the part of the paper most often read and quoted, and this sentence is the only overall estimate of the duration effect anywhere in the paper. A reader who takes the interval at face value would conclude that the slope could be as steep as −0.63 SD per week, which over the 11-week average trial would be about 6.9 SD of extra benefit, seven times the overall treatment effect of −0.96 SD. The printed interval also cannot be reconciled with the printed P value.
- The supported conclusion is unaffected in direction. The direction (benefit grows with duration) and the statistical significance rest on the Results subgroup slopes, which are internally consistent, both below the paper's P = 0.01 threshold, and close to the abstract's −0.11 when pooled. The abstract conclusion "The effectiveness of tricyclics seems to increase over time" is therefore not reversed.
- The magnitude and its precision are not recoverable from the paper. Because no overall slope is reported in the body, the correct interval for −0.11 cannot be confirmed from the published text. A dropped leading zero (−0.063 to −0.15) would fit the point estimate and the P value, but that is only one possibility.
- Scope. The authors already describe the duration analysis as exploratory. The primary efficacy and adverse-effect results do not depend on this number.
Explanations considered
- A different model or population for the abstract's β. Partly plausible for the point estimate: the abstract's −0.11 may be an overall slope across both headache types rather than either subgroup, and the inverse-variance pool of the subgroups gives −0.116. This cannot explain the interval. Whatever the model, population or outcome, a 95% CI must contain the estimate it belongs to.
- A transformed or asymmetric scale. Not applicable. Metaregression coefficients on SMD are reported on the linear scale (the Results define β as SMD per additional week). Even an asymmetric interval on a log or ratio scale still contains its point estimate.
- A different confidence level, or a one-sided interval. Not able to explain it. Changing the level widens or narrows an interval around the estimate; it never moves the estimate outside. The Methods use P = 0.01 as a significance threshold but do not describe a different interval convention, and the subgroup intervals in the same paragraph behave as ordinary 95% intervals.
- A reversed-sign or reordered interval. Not able to explain it. Reading the limits in either order gives the same set, −0.63 to −0.15, which excludes −0.11. Changing signs would put the interval on the positive side and contradict both the point estimate and the stated direction of effect.
- A text-conversion artifact. Ruled out. The same string appears in the PMC article page, in the publisher-deposited Europe PMC JATS XML (which uses true Unicode minus signs on all three numbers) and in the PubMed abstract (PMID 20961988). The publisher's own page could not be reached (see Status), but three independent renderings of the publisher's text agree.
- A correct value given elsewhere. Not found. The Results text and the Fig 3 legend give only the two subgroup slopes; there are no supplementary tables (see Status).
- A correction already issued. None found (see Status).
- Side observation, outside the main finding. For tension-type headache versus SSRIs, the abstract gives −0.80 (−2.63 to 0.02) while the Results give −0.80 (−1.63 to 0.02, four studies). The lower limits differ by exactly 1.00, and only the Results interval is centred near −0.80 (midpoint −0.805 vs −1.305). The abstract's placebo comparisons (tension-type −1.29, −2.18 to −0.39; migraine −0.70, −0.93 to −0.48) also differ from the Results' "burden" estimates (−0.99, −1.66 to −0.32; −1.00, −1.52 to −0.48). The abstract describes these as headache frequency outcomes, so they may come from a different outcome definition; I did not assess them further.
Status
- Version of record. As of 2026-10-24, bmj.com (reached through doi.org) returned HTTP 403 to automated requests, and the publisher PDF could not be downloaded from bmj.com, PMC or Europe PMC. The abstract sentence was checked in three renderings of the publisher's text, which agree: the PMC article page, the Europe PMC full-text JATS XML, and the PubMed record (PMID 20961988).
- Supplements. The JATS XML has no supplementary-material elements and no web-extra or appendix links. The Europe PMC supplementary bundle holds only the seven figure images. Fig 3, the duration metaregression plot, is labelled only with the two subgroup slopes and shows no overall slope or interval. The paper states that it is based on a Cochrane review; that review could not be reached through the publisher sites.
- Corrections and comments. No correction, erratum, retraction or expression of concern was found.
src/known.pyreturns no Crossref update relations, no PMC notices and no Europe PMC notices. The Crossref record has no update-to or updated-by entries, and a Crossref filter for updates to this DOI returns nothing. The PubMed CommentsCorrections entries are two comments (the accompanying BMJ editorial, c5250, and an Evidence-Based Medicine commentary, doi:10.1136/ebm1176), neither an erratum. A Retraction Watch site search and web searches for the title together with "correction", "erratum" and "PubPeer" found nothing relevant. The PubPeer API could not be queried (Cloudflare block or HTTP 404 to automated requests), and the Europe PMC REST search was unavailable (HTTP 503) on several attempts, so those two sources are not fully confirmed. - Sources. PMC article PMC2958257; Europe PMC full-text XML and supplementary files for PMC2958257; PubMed 20961988; Crossref; https://doi.org/10.1136/bmj.c5222; Retraction Watch; PubPeer (attempted).
Suggested correction
The authors may wish to check the overall duration metaregression output and replace, in the abstract,
(β=-0.11, 95% confidence interval -0.63 to -0.15; P<0.0005)
with the interval that the analysis actually produced for β = −0.11. If the intended interval is −0.15 to −0.063 (one possible reading, consistent with the point estimate and P < 0.0005), the corrected text would read "(β=−0.11, 95% confidence interval −0.15 to −0.063; P<0.0005)". It would also help readers if the overall slope and its interval were reported in the Results, next to the subgroup slopes, so that the abstract figure can be traced. The authors may also wish to check the abstract's interval for tension-type headache versus SSRIs (−2.63 to 0.02), which the Results give as −1.63 to 0.02.