← Back to the plain-language case
Paired t-test p-values for one-year cortical thickness change do not match the reported t statistics
Hum Brain Mapp (2009) · doi:10.1002/hbm.20740 · PMC2903209
Summary
The paper's only real-MRI validation (Section IV.B) tests one-year change in mean cortical thickness in 9 patients with Alzheimer's disease (AD) and 13 controls. It reports paired t statistics of −1.200 and −1.495 in AD (df = 8) and −0.274 and +0.175 in controls (df = 12), with p = 0.001, 0.001, 0.009 and 0.001. For those t statistics the two-sided p-values are 0.264, 0.173, 0.789 and 0.864. Table I independently gives t values of about the same size and p-values of 0.19 to 0.84. With the correct p-values none of the four within-group changes is statistically significant. That undoes the paper's statement that both methods "detect a systematic change" in both groups. It also undoes footnote 9's statement that FreeSurfer's increase in controls "is statistically significant", which the paper uses in its comparison with FreeSurfer.
What the paper reports
Section IV.B (Real MRI Data), paragraph 3, sample:
Our dataset includes pairs of scans over a one-year interval from 22 subjects (total of 44 scans), of whom 9 had been diagnosed with Alzheimer’s disease at their first scan, and 13 were age-matched normal subjects.
Section IV.B (Real MRI Data), paragraph 5, the tests in question:
Both techniques are able to detect a systematic change in cortical thickness over time, both in the AD (Alzheimer’s disease) group and in controls. Our method found thickness declined in AD (tpaired = -1.200; p=0.001), and in controls (tpaired = -0.274; p=0.009); FreeSurfer found thickness declined in AD (tpaired = -1.495; p=0.001), and increased in controls (tpaired = +0.175; p=0.001).9
Footnote 9, attached to that sentence (in the PMC text it sits in the back matter):
This increase, which is anatomically not expected, is statistically significant. No increase is found with our proposed method.
Section IV.B, paragraph 6, the baseline/follow-up correlations (the next paragraph):
Our technique gives measures that correlated highly over the 1 year time-interval in AD (p=0.001) and in controls (p=0.009), and so did FreeSurfer (p=0.001 both for AD and for normal subjects).
Section IV.B, paragraph 9, the interpretation:
Both our method and FreeSurfer report a few subjects that show increases (less pronounced with our approach), while on average our proposed method shows decline for both populations (much more significant for the AD subjects, as expected). Even so, FreeSurfer shows a net increase for the control subjects, not very large but still statistically significant. A number of reasons might explain this, including registration issues and segmentation errors, which are minimized in our proposed technique.
Table I ("Statistical Results on Real MRI Data"; relative change in mean thickness over one year), rows for the two groups (columns: proposed algorithm | FreeSurfer; spacing normalised):
Mean change for AD subjects | -1.42 % | -1.15 % Mean change for normal subjects | -0.19 % | +0.20 % SD of change for AD subjects | 3.52 | 2.40 SD of change for normal subjects | 3.39 | 2.82
The Abstract mentions this dataset without giving numbers ("demonstrate its performance on both artificial volumes and real 3D brain MRI data from subjects with Alzheimer’s disease and healthy individuals"). The Conclusion says the authors "presented reasonable results for longitudinal MRI scans of Alzheimer’s disease and normal subjects".
What the paper's own numbers show
Method. The tests compare each subject's baseline and follow-up thickness, so df = n − 1: 8 for AD and 12 for controls. I computed the two-sided p-value for each reported t from the t distribution, along with the one-sided p-value and the |t| that the reported p would require. As an independent check I rebuilt each t from Table I as mean % change / (SD / √n), with a rounding envelope of ±0.005 on the mean and SD. I also used Table I's "all subjects" rows to confirm the group sizes. All values come from recompute.py.txt (scipy.stats).
| Quantity | Location | Reported | Recomputed |
|---|---|---|---|
| Proposed method, AD: paired t, df = 8 | Sec IV.B para 5 | t = −1.200; p = 0.001 | two-sided p = 0.264 (one-sided 0.132); p = 0.001 needs |t| ≥ 5.04 |
| FreeSurfer, AD: paired t, df = 8 | Sec IV.B para 5 | t = −1.495; p = 0.001 | two-sided p = 0.173 (one-sided 0.087); p = 0.001 needs |t| ≥ 5.04 |
| Proposed method, controls: paired t, df = 12 | Sec IV.B para 5 | t = −0.274; p = 0.009 | two-sided p = 0.789 (one-sided 0.394); p = 0.009 needs |t| ≥ 3.11 |
| FreeSurfer, controls: paired t, df = 12 | Sec IV.B para 5; footnote 9 | t = +0.175; p = 0.001; "statistically significant" | two-sided p = 0.864 (one-sided 0.432); p = 0.001 needs |t| ≥ 4.32 |
| Same four t, with unlimited df (normal approximation) | — | — | p = 0.230, 0.135, 0.784, 0.861; no choice of df gives the reported p |
| t from Table I, proposed method, AD (−1.42 %, SD 3.52, n = 9) | Table I | (text: −1.200) | t = −1.210 (rounding range −1.216 to −1.204); p = 0.261 |
| t from Table I, FreeSurfer, AD (−1.15 %, SD 2.40, n = 9) | Table I | (text: −1.495) | t = −1.438 (−1.447 to −1.428); p = 0.189 |
| t from Table I, proposed method, controls (−0.19 %, SD 3.39, n = 13) | Table I | (text: −0.274) | t = −0.202 (−0.208 to −0.196); p = 0.843 |
| t from Table I, FreeSurfer, controls (+0.20 %, SD 2.82, n = 13) | Table I | (text: +0.175) | t = +0.256 (+0.249 to +0.263); p = 0.803 |
| Mean change, all subjects (weighted from group rows) | Table I | −0.69 % / −0.35 % | −0.693 % / −0.352 % |
| SD of change, all subjects (pooled from group rows) | Table I | 3.42 / 2.68 | 3.416 / 2.683 |
| Group separation, (mean normal − mean AD) / SD all | Table I | 0.36 / 0.50 | 0.360 / 0.504 |
| p-values of the t-tests vs p-values of the baseline/follow-up correlations | Sec IV.B paras 5 and 6 | 0.001, 0.009, 0.001, 0.001 (para 5); 0.001, 0.009, 0.001, 0.001 (para 6) | identical, in the same order; at n = 9 a correlation of r = 0.898 gives two-sided p = 0.001 |
The Table I checks confirm n = 9 and n = 13. All four printed t values are close to, but slightly outside, the range implied by Table I's rounded means and SDs. They differ from the Table I values by 0.010 and 0.058 (AD) and by 0.072 and 0.081 (controls). The paper does not say whether the tests used percent change or absolute thickness, which could account for those differences. They do not affect the conclusion: every t value the paper's numbers support gives a two-sided p between 0.17 and 0.86.
A separate check on the next paragraph found a smaller inconsistency of the same kind. It does not affect the main finding:
| Quantity | Location | Reported | Recomputed |
|---|---|---|---|
| Agreement of change between methods, all subjects (r = 0.572, n = 22) | Sec IV.B para 7 | p = 0.0028 | two-sided p = 0.0054 (one-sided 0.0027) |
| Agreement of change between methods, controls (r = 0.583, n = 13) | Sec IV.B para 7 | p = 0.0011 | two-sided p = 0.0365 (one-sided 0.0183) |
| Agreement of change between methods, AD (r = 0.558, n = 9) | Sec IV.B para 7 | p = 0.0047 | two-sided p = 0.1185 (one-sided 0.0592) |
Figure
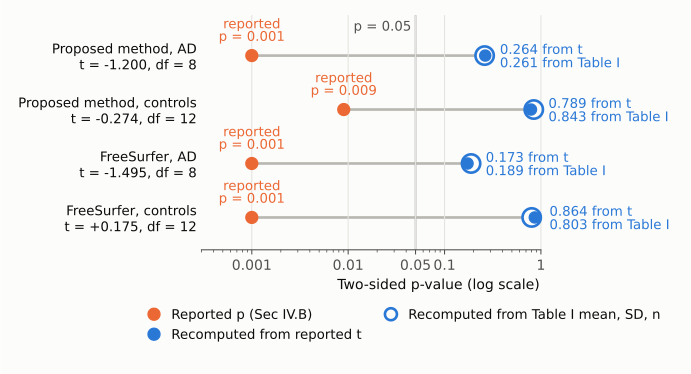
Figure 1. The four paired t-tests of one-year change in mean cortical thickness in Section IV.B, on one log-scaled p-value axis. Orange dots are the p-values printed in the paper. Filled blue dots are the two-sided p-values for the printed t statistic and df (8 for 9 AD patients, 12 for 13 controls). Hollow blue rings are the two-sided p-values for t rebuilt from Table I's mean and SD of percent change. The thin vertical line marks p = 0.05. In every row the two recomputed values agree with each other (0.17 to 0.86) and lie well above the printed value, on the other side of the p = 0.05 line. All four changes are non-significant at the conventional level.
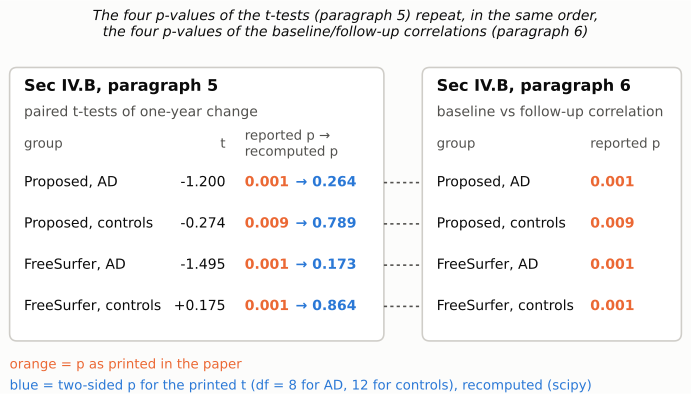
Figure 2. The left panel shows the four paired t-tests from Section IV.B paragraph 5, with the printed t, the printed p (orange) and the two-sided p for that t (blue). The right panel shows the p-values that paragraph 6 gives for the baseline/follow-up thickness correlations in the same four method-by-group cells. The printed p-values in the two paragraphs are identical, cell for cell. That identity is a fact about the text. It is consistent with, but does not prove, the explanation that the correlation p-values were entered in place of the t-test p-values (see Explanations considered).
Why it matters
The paper is mainly a methods paper. Its central contribution is defining thickness as a minimum line integral over a gray-matter probability map, together with the algorithm, the synthetic-data validation and the run time, and none of that depends on these p-values. The method-agreement correlation for all 22 subjects (r = 0.572) is also unaffected in substance.
The longitudinal AD/control dataset is the paper's only test on real MRI, and these four tests are its main quantitative result. With the corrected values:
- "Both techniques are able to detect a systematic change in cortical thickness over time, both in the AD … group and in controls" is not supported. Neither method detects a statistically significant one-year change in either group (p = 0.17 to 0.86 with n = 9 and n = 13). The mean changes are in the expected direction for AD. With these sample sizes and SDs of change, they do not differ significantly from zero.
- The comparative argument against FreeSurfer loses its statistical basis. Footnote 9 and paragraph 9 describe FreeSurfer's mean increase in controls as "statistically significant" and attribute it to "registration issues and segmentation errors, which are minimized in our proposed technique." The increase has p = 0.864 (t = +0.175), or 0.803 from Table I, and is consistent with no change. Neither method's control-group mean differs significantly from zero, so on these numbers the paper cannot conclude that one method is biased and the other is not.
- "Much more significant for the AD subjects" compares p-values (0.001 vs 0.009) that are not the p-values of these tests.
The descriptive content of Table I (means, SDs, group separation 0.36 vs 0.50) is internally consistent and not affected.
Explanations considered
- Different sample size or df. This does not account for the numbers. Section IV.B gives 9 AD patients and 13 controls, and Table I's pooled "all subjects" mean and SD reproduce exactly from those group sizes. No df rescues the values: even with unlimited df, t = −1.200 gives p = 0.230 and t = +0.175 gives p = 0.861.
- One-sided tests. This does not account for the numbers. The one-sided p-values are 0.132, 0.087, 0.394 and 0.432, all far above the reported values.
- The "t" values are something other than t statistics (for example mean differences or effect sizes). This does not account for the numbers. They match mean / (SD/√n) from Table I closely (within 0.06 for both AD tests), so they behave as one-sample t statistics on the paired change.
- A non-parametric test (Wilcoxon signed-rank) produced the p-values. This is not plausible for AD. With n = 9 the smallest attainable exact two-sided p is 2/2⁹ = 0.0039, so p = 0.001 cannot arise. It would also be inconsistent with the label "tpaired".
- Tests run across many vertices or voxels rather than subjects. Nothing in the paper indicates this. Table I summarises one percent change per subject, and as noted above, the reported t values cannot give these p-values at any df.
- Typographical error in the t values rather than the p-values. This does not account for the numbers. The t values agree with Table I, which is reported independently. Reaching p = 0.001 would need |t| ≥ 5.04 (AD) or ≥ 4.32 (controls), which is inconsistent with Table I's means and SDs.
- The p-values belong to a different analysis. This is consistent with the numbers. The four printed p-values are identical, in the same order, to those the next paragraph gives for the baseline/follow-up thickness correlations. Correlations of about r = 0.90 (n = 9) and r = 0.69 to 0.80 (n = 13) would produce them, which is plausible for test-retest thickness. Standard paired-samples output reports a correlation significance next to the paired-t significance. This would explain how the values could have been transposed, but it does not make them correct for the t-tests.
- PMC conversion or transcription artefact. This is ruled out. The publisher's typeset PDF (page 3193) carries the same numbers.
Status
- Version of record. The Wiley article pages (doi.org redirect to onlinelibrary.wiley.com, including /pdf, /pdfdirect and /full) returned HTTP 403. I checked the publisher's typeset PDF that PMC hosts instead (HBM-30-3188.pdf, 12 pages, "Human Brain Mapping 30:3188–3199 (2009)", © 2009 Wiley-Liss, created 2009-09-11). Page 3193 carries the paragraph 5 sentence, footnote 9 and the paragraph 6 correlation p-values exactly as quoted. Page 3194 carries Table I with the same values. Every quotation above was also confirmed verbatim against the PMC-archived text.
- Supplements. The article has no supporting information (Europe PMC hasSuppl = N), and no individual-subject data are deposited. Figure 7 shows per-subject bars only. Nothing available could resolve the discrepancy.
- Corrections and comments. As of 2026-10-23, no correction, erratum, expression of concern, retraction or published comment was found. Crossref lists no update relations (update-to / updated-by empty; filter=updates returns 0 items). PMC and Europe PMC list no notices (src/known.py). The PubMed record (PMID 19219850) has no CommentsCorrectionsList or ErratumIn entries. PubPeer's search page returned HTTP 403 to automated access and its publication API returned no record for the DOI. Web searches for the DOI with "correction", "erratum" or "PubPeer" found nothing.
Suggested correction
- Replace the four p-values in Section IV.B paragraph 5 with the p-values of the paired t-tests. For the printed t statistics these are, two-sided, 0.264 (proposed method, AD), 0.789 (proposed method, controls), 0.173 (FreeSurfer, AD) and 0.864 (FreeSurfer, controls). Also state whether the tests used percent change or absolute thickness, because the printed t values differ slightly from those implied by Table I.
- Revise the opening sentence of paragraph 5 ("Both techniques are able to detect a systematic change … both in the AD group and in controls"), footnote 9 ("is statistically significant"), and the paragraph 9 statements "much more significant for the AD subjects" and "not very large but still statistically significant", together with the inference about FreeSurfer's registration and segmentation errors that rests on them.
- Check the p-values for the method-agreement correlations in paragraph 7. For r = 0.583 (n = 13) and r = 0.558 (n = 9) the two-sided values are 0.037 and 0.119, not 0.0011 and 0.0047. Also state whether the tests are one- or two-sided (the all-subjects value of 0.0028 matches a one-sided test).