← Back to the plain-language case
Abstract and Table 3 give a myocardial infarction confidence interval that excludes its own estimate
Diabetes Care (2009) · doi:10.2337/dc09-1297 · PMC2782995
Summary
The abstract and Table 3 report the ratio of relative risks (RRs) of aspirin for myocardial infarction (MI), in patients with diabetes versus without, as 1.19 with a 95% CI of 0.82–1.17. The upper limit, 1.17, is below the point estimate, 1.19, so the interval cannot be right as printed. The paper's stated Altman–Bland method, applied to the subgroup RRs printed in the same table, gives 1.19 (95% CI 0.82–1.73), P = 0.35. The same calculation reproduces the mortality and ischemic stroke rows exactly. The corrected interval still includes 1, so the paper's conclusion of no significant interaction stands. But the printed interval is about half as wide as it should be on the log scale, and it makes a headline result look much more precise than the data allow. The 2018 erratum to this article does not address the interval.
What the paper reports
Abstract, Results:
The ratios of RRs comparing the benefit of aspirin among patients with diabetes compared with patients without diabetes for mortality, myocardial infarction, and ischemic stroke were 1.12 (95% CI 0.92–1.35), 1.19 (0.82–1.17), and 0.70 (0.25–1.97), respectively.
Table 3, "Aspirin-diabetes subgroup interaction analyses", MI row. The columns are RR with diabetes | RR without diabetes | P interaction | Ratio of RRs pooled across trials† | Ratio of RRs pooled within trials‡ | Ratio of RRs Bayesian analyses§:
Myocardial infarction | 0.86 (0.67–1.11) | 0.72 (0.55–0.95) | 0.36 | 1.19 (0.82–1.17) | 1.02 (0.71–1.47) | 1.06 (0.16–6.71)
Table 3, footnote † (the column that holds the error):
Ratios of RRs in this method are pooled across randomized controlled trials and subgroups of randomized controlled trials of patients with diabetes versus without diabetes; then a ratio of pooled estimates is estimated. Numbers in parentheses represent 95% CIs, which indicate a significant interaction if it excludes 1.
Research Design and Methods, "Interaction between the effect of aspirin and diabetes status":
First, we estimated the ratio of RRs and its 95% CI using the method of Altman and Bland (13). This estimate compares the pooled RRs across subgroups of patients with diabetes and without across trials.
Results, "Prevention of cardiovascular events with aspirin" (the subgroup RRs that feed the ratio):
Estimates among patients with diabetes were 0.97 (0.87–1.08; I2 0%), 0.86 (0.67–1.11; I2 53%), and 0.62 (0.31–1.24; I2 67%), respectively. The corresponding estimates among patients without diabetes were 0.87 (0.75–1.02; I2 0%), 0.72 (0.55–0.95; I2 70%), and 0.89 (0.41–1.94; I2 0%), respectively.
Abstract, Conclusions:
Whereas estimates of benefit among patients with diabetes remain imprecise, our analysis suggests that the relative benefit of aspirin is similar in patients with and without diabetes.
What the paper's own numbers show
Method. Altman and Bland (BMJ 2003;326:219) compare two independent estimates on the log scale. The ratio is RR₁/RR₂, and SE(ln ratio) = √(SE₁² + SE₂²), where each SE comes from its published 95% CI as (ln upper − ln lower)/(2 × 1.96). I applied this to the "RR with diabetes" and "RR without diabetes" columns of Table 3 for all three outcomes. As cross-checks, I also computed (a) the upper limit that is log-symmetric with the printed lower limit about the printed point, (b) the interval implied by the printed P interaction, and (c) the ratio from the MI subgroup subtotals in the corrected Fig. 2B published in the 2018 erratum. Every number below is printed by recompute.py.txt.
| Quantity | Location | Reported | Recomputed |
|---|---|---|---|
| MI ratio of RRs, point | Abstract; Table 3, across-trials column | 1.19 | 1.194 (0.86/0.72) |
| MI ratio of RRs, 95% CI | Abstract; Table 3, across-trials column | 0.82–1.17 | 0.82–1.73 (0.823–1.733) |
| MI two-sided P for the ratio | Table 3, P interaction | 0.36 | 0.35 |
| MI SE(ln ratio) | derived | 0.091 (implied by 0.82–1.17) | 0.190 |
| Log-scale midpoint of the printed MI CI | derived | should equal the point, 1.19 | 0.979 |
| Upper limit log-symmetric to printed 0.82 about 1.19 | derived | — | 1.727 |
| 95% CI implied by printed P = 0.36 and point 1.19 | derived | — | 0.82–1.73 |
| MI ratio from 2018 erratum Fig. 2B subtotals, 0.85 (0.66–1.10) and 0.72 (0.55–0.94) | Erratum, Fig. 2B | "Subgroup interaction: p=0.38" | 1.181 (0.815–1.709), p = 0.38 |
| Mortality ratio of RRs (control row) | Abstract; Table 3 | 1.12 (0.92–1.35), P = 0.28 | 1.115 (0.924–1.345), p = 0.26 |
| Ischemic stroke ratio of RRs (control row) | Abstract; Table 3 | 0.70 (0.25–1.97), P = 0.50 | 0.697 (0.246–1.974), p = 0.50 |
Applied to the paper's own inputs, the method reproduces both control rows to the printed precision. (The mortality point, 0.97/0.87 = 1.1149, sits on the rounding boundary between 1.11 and 1.12. The small P differences fit with recomputing from rounded inputs.) For MI it reproduces the point estimate (1.19), the lower limit (0.82) and the P value (0.35 vs 0.36). Only the upper limit fails, at 1.73 against the printed 1.17. Three independent routes all put the upper limit between 1.71 and 1.73: log symmetry with the printed lower limit, the printed P value, and the erratum's corrected subtotals.
Figure
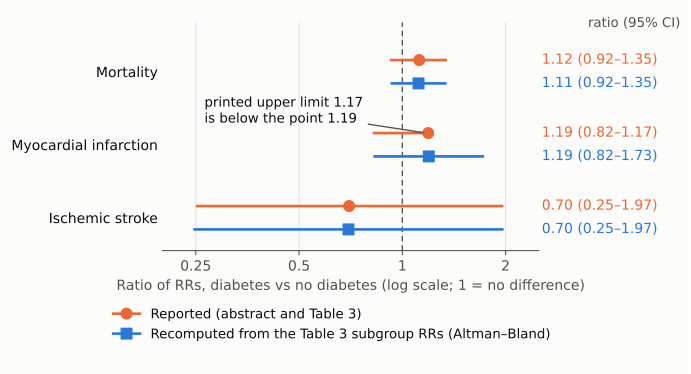
Figure 1. Ratio of RRs of aspirin (diabetes vs no diabetes), with 95% CIs, on a log axis. For each outcome, the upper line (orange circle) is the value printed in the abstract and in Table 3's "pooled across trials" column. The lower line (blue square) is recomputed by recompute.py.txt from the Table 3 subgroup RRs using the paper's stated Altman–Bland method. The dashed vertical line marks a ratio of 1 (no difference). For mortality and ischemic stroke the two intervals coincide. For MI the printed interval (0.82–1.17) stops short of its own point estimate (1.19). The recomputed interval runs to 1.73. Both MI intervals include 1. The recomputed mortality point shows as 1.11 rather than 1.12 only because 1.1149 rounds down.
Why it matters
- It is a headline result. The MI ratio is one of three numbers in the abstract's Results, and it is the only support the abstract gives for its MI conclusion. Abstract-only readers, indexers and later meta-analysts will take the printed interval as it stands.
- The printed interval overstates the precision a great deal. On the log scale, the printed interval implies a standard error of 0.091. The paper's inputs give 0.190, about twice as large. As printed, the upper limit of 1.17 suggests that the relative MI benefit of aspirin in diabetes is at most modestly smaller than without diabetes. Taking the no-diabetes RR of 0.72, a ratio of 1.17 corresponds to an RR in diabetes of at most 0.84, which is still a benefit. The recomputed upper limit of 1.73 corresponds to an RR in diabetes of up to 1.25, which includes no benefit at all. This bears on the abstract's statement that the relative benefit is "similar" and on the Implications statement that between-group differences were "inconsistent and of small magnitude". The data are compatible with a small difference but do not rule out a large one.
- The paper's conclusion of non-significance is unchanged. The corrected interval (0.82–1.73) still includes 1 and agrees with the printed P interaction of 0.36. The Results statement that "All three methods yielded nonsignificant ratios of RR" remains true. The point estimate and its direction are unchanged.
- A reader can see that something is wrong but cannot repair it. Because the upper limit sits below the point estimate, the error is detectable. The correct value is not printed anywhere in the paper or in the erratum. To recover it, a reader has to recompute it.
Explanations considered
- A different method or a different interval type. This does not account for the numbers. The Methods name the Altman–Bland method, and footnote † defines the column as an ordinary 95% CI. The same method with the same inputs reproduces the mortality and stroke rows, and the MI point, lower limit and P value. No method yields a 95% interval that excludes its own point estimate.
- A value copied from another column. Ruled out. The other MI columns are 1.02 (0.71–1.47) within trials and 1.06 (0.16–6.71) Bayesian. Neither contains 1.17.
- A text-conversion artifact (lost minus sign, superscript read as a digit, shifted table cell). Ruled out. The identical string "1.19 (0.82–1.17)" appears in both the abstract and Table 3. Table 3 is live text in separate cells in the PMC/Europe PMC XML, not an image. The same string appears in the PubMed abstract (PMID 19741185) and in the PMC HTML page. The PMC copy is the publisher-deposited version (not an author manuscript).
- Different inputs to the ratio (for example, unrounded subgroup estimates or a corrected trial denominator). This does not account for the numbers. Rounding in the inputs moves the limits by about 0.01. The 2018 erratum's corrected MI subtotals give 0.82–1.71, still nowhere near 1.17.
- Already corrected. No. The only correction notice (see Status) concerns the Fig. 2 panel labels and the ETDRS denominators. It does not mention Table 3 or the abstract.
- The intended value. Three independent routes give an upper limit near 1.71–1.73, so a reporting slip in the upper limit is the simplest explanation consistent with the numbers. The exact intended value cannot be fixed from the rounded published inputs. Note that 1.71, the value from the erratum's subtotals, has the same digits as 1.17. That is an observation, not evidence of how the error arose.
Status
As of 2026-10-24.
- Version of record. The publisher's site (diabetesjournals.org) and its PDF links did not serve the article to automated requests (HTTP 403, or an HTML page instead of the PDF). The PMC copy is publisher-deposited (JATS metadata: is-manuscript no). The PMC HTML, the Europe PMC full-text XML and the PubMed abstract all carry "1.19 (0.82–1.17)" in the abstract, and the PMC and Europe PMC copies carry it in Table 3 as well. A web-search snippet of the abstract shows the same string.
- Supplements. The article lists no supplementary material. The Europe PMC file bundle holds only the two figure images.
- Corrections. Crossref and Europe PMC (via
src/known.py) list one notice, doi:10.2337/dc18-er06a (PMC5961400, PMID 29686158; Diabetes Care 2018;41(6):1321–1322, online 2018-04-23). It states that the Fig. 2 plots were mislabeled and that the ETDRS denominators were wrong, and it republishes Fig. 2. It does not mention Table 3 or the MI ratio of RRs in the abstract. Its corrected Fig. 2B prints MI subtotals of 0.85 (0.66, 1.10) with diabetes and 0.72 (0.55, 0.94) without, and "Subgroup interaction: p=0.38". These support an upper limit near 1.7 (see table above). No retraction or expression of concern was found. - PubPeer. The PubPeer API and search page refused automated access (HTTP 404 on the legacy API, Cloudflare challenge on the search page), so PubPeer could not be queried directly. A web search for the title together with "PubPeer" found no thread for this article.
- Sources. PMC article PMC2782995 (via
src/show.py); Europe PMC full-text XML and supplementary-file bundles for PMC2782995 and PMC5961400; erratum figuredc18er06af2.jpg; Crossref; PubMed PMID 19741185 and 29686158; https://doi.org/10.2337/dc09-1297; Altman DG, Bland JM, BMJ 2003;326:219.
Suggested correction
In the abstract (Results) and in Table 3 (myocardial infarction row, column "Ratio of RRs pooled across trials"), the 95% CI for the ratio of RRs should read approximately 0.82–1.73 in place of 0.82–1.17. That is the value the paper's stated Altman–Bland method gives from the Table 3 subgroup RRs. If the authors recompute from the unrounded estimates, or from the subtotals corrected in the 2018 erratum (which give 0.82–1.71), they should print their own figure. The point estimate (1.19) and the P interaction (0.36) need no change. The authors may also wish to state that the corrected interval, while still including 1, is compatible with a substantially smaller relative MI benefit of aspirin in patients with diabetes than the printed interval suggested.