← Back to the plain-language case
NRSF gain stated as 299% more binding sites; Table 1 counts give 199% more
Nucleic Acids Res (2008) · doi:10.1093/nar/gkn488 · PMC2532738
Summary
The paper says that its method, SISSRs, found "32, 299 and 78% more" binding sites than previous analyses of the same CTCF, NRSF and STAT1 datasets. It makes this statement in the abstract, the introduction and the Results, and the Discussion repeats it as the range "32–299%". Table 1 gives the counts behind the NRSF figure: 5813 sites from SISSRs and 1946 from the previous approach. That is (5813 − 1946)/1946 = 198.7% more, or 2.99 times as many. "299" is the new count expressed as a percentage of the old one (298.7%), while the CTCF and STAT1 figures in the same sentence are correct "% more" values (32.3% and 77.9%). The NRSF gain is therefore overstated by 100 percentage points in the paper's headline sensitivity claim. SISSRs still finds about three times as many NRSF sites, not about four times as many.
What the paper reports
Abstract:
We identified 26 814, 5813 and 73 956 binding sites for CTCF, NRSF and STAT1 proteins, respectively, which is 32, 299 and 78% more than that inferred previously for the respective proteins.
Introduction, second paragraph:
Using SISSRs, we identified a total of 26 814, 5813 and 73 956 binding sites for CTCF, NRSF and STAT1, respectively, which is 32, 299 and 78% more than that inferred previously for the respective proteins (3–5).
Results, section "ChIP-Seq datasets and binding sites":
Using an FDR threshold of 10-3, we identified a total of 26 814, 5813 and 73 956 binding sites for CTCF, NRSF and STAT1 proteins, respectively. The number of sites identified in this study is 32, 299 and 78% more than what was previously identified from the same datasets for the respective proteins (3–5) (Table 1).
Discussion, first paragraph:
SISSRs’ ability to identify binding sites with high resolution helped it achieve unprecedented sensitivity and specificity, as evidenced by its ability to identify 32–299% more binding sites than that by previous approaches using the same dataset (3–5).
Table 1 ("Data and results summary"), two of its rows:
| CTCF | NRSF | STAT1 | |
|---|---|---|---|
| Binding sites identified by SISSRs | 26 814 | 5813 | 73 956 |
| Binding sites identified by previous approaches | 20 262 | 1946 | 41 582 |
What the paper's own numbers show
Method. For each protein I took the two counts in Table 1 and computed the increase as (SISSRs − previous)/previous × 100, which is what "X% more than" means. I also computed the ratio SISSRs/previous × 100, the new count as a percentage of the old one, to see which convention each reported figure matches. As a check on the table, I compared the SISSRs counts with the subset sizes the paper gives elsewhere, and the previous NRSF count with the source the paper cites for it. Every number below is printed by recompute.py.txt.
| Quantity | Location | Reported | Recomputed from the paper's own numbers |
|---|---|---|---|
| CTCF, % more sites (26 814 vs 20 262) | Abstract; Introduction; Results | 32% | 32.3% (matches) |
| NRSF, % more sites (5813 vs 1946) | Abstract; Introduction; Results | 299% | 198.7% (rounds to 199%) |
| STAT1, % more sites (73 956 vs 41 582) | Abstract; Introduction; Results | 78% | 77.9% (matches) |
| NRSF, SISSRs count as % of previous count | — | — | 298.7% (ratio 2.987) |
| CTCF and STAT1, same ratio as % | — | — | 132.3% and 177.9% (do not match 32 and 78) |
| Range of improvement | Discussion, paragraph 1 | 32–299% | 32–199% |
| Fold change implied by "299% more" | — | 3.99 | Table 1 gives 2.987 |
| Previous NRSF count that would make "299% more" correct | — | 1946 (Table 1) | 1456.9 needed |
| SISSRs NRSF count that would make "299% more" correct | — | 5813 (Table 1) | 7765 needed |
| Top 20% of NRSF sites | Methods; Results, "Accuracy" | 1160 | 20% of 5813 = 1163 (consistent) |
| 10% of NRSF and STAT1 sites | Methods, "Motif analysis" | 581 and 7396 | 581.3 and 7395.6 (consistent) |
The CTCF and STAT1 figures fit "% more" and not "% of". The NRSF figure fits "% of" and not "% more". The subset sizes in Methods and Results are consistent with the SISSRs counts in Table 1, so the NRSF count of 5813 is used consistently across the paper. (The CTCF and STAT1 subsets of 2622 and 3825 are defined by a tag-count cut-off and are approximately, not exactly, 10% and 5% of the sites; they do not bear on the NRSF figure.)
Figure
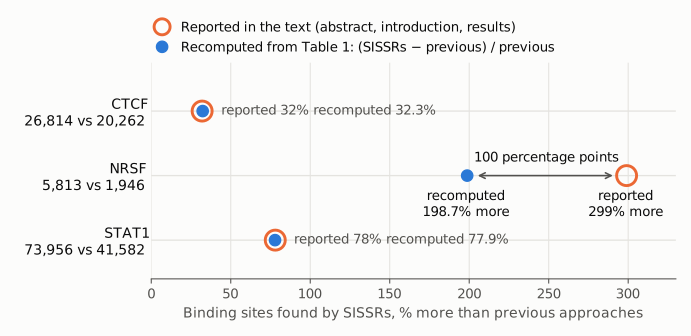
Figure 1. Percentage increase in binding sites found by SISSRs over previous approaches, for each of the three proteins. Each row is labelled with the two Table 1 counts it is computed from (SISSRs vs previous approaches). Open orange circles are the values the paper reports in the abstract, introduction and Results; filled blue dots are the values recomputed from Table 1 as (SISSRs − previous)/previous, by recompute.py.txt. For CTCF and STAT1 the two coincide to within 0.4 percentage points. For NRSF the reported 299% lies 100 percentage points above the recomputed 198.7%; 299 matches 5813/1946 × 100 = 298.7%, the new count as a percentage of the old one. The axis starts at zero.
Why it matters
- It is one of three headline numbers in the abstract. The site counts and the percentage gains are the paper's main quantitative evidence for the sensitivity of SISSRs. The Discussion uses the "32–299%" range as the evidence for "unprecedented sensitivity and specificity". With the NRSF value corrected, the range is 32–199%.
- "299% more" implies a gain about one-third larger than the data show. 299% more means about 4.0 times as many sites; Table 1 gives 2.99 times as many. A reader comparing ChIP-Seq peak callers, or citing this paper for the size of SISSRs' gain on the NRSF dataset, would overstate it.
- The conclusion holds. SISSRs still finds about three times as many NRSF sites as the previous analysis of the same data, and the CTCF and STAT1 figures are correct. The paper's other findings (motif support for the sites, tag density as an indicator of binding affinity, and core residues in NRSF and CTCF sites) do not depend on this percentage. Table 1 prints the raw counts, so a careful reader can recompute the value.
Explanations considered
- A different convention ("299% of" rather than "299% more"). It accounts for the NRSF number but not for the sentence. 5813/1946 = 298.7%, so 299 is the ratio written as a percentage. But the same sentence gives 32 for CTCF and 78 for STAT1, which are "% more" values; as ratios they would be 132 and 178. No single convention fits all three numbers, and the text says "more than" each time.
- A different baseline count. Not supported. Table 1 gives 1946 previous NRSF sites, and the earlier NRSF ChIP-Seq study that the paper cites for it (Science 2007, doi:10.1126/science.1141319) reports NRSF binding "to 1946 locations in the human genome" in its abstract. "299% more" would require a previous count of about 1457 or a SISSRs count of about 7765. Neither appears in the paper.
- A different threshold or subset. Not supported. The Results give all three counts at the same FDR threshold of 10^-3 and point to Table 1 for the comparison. No footnote, legend or other passage gives a different NRSF count, and the Methods subset sizes (1160 and 581) are consistent with 5813.
- A conversion or typesetting artifact. Not possible here. The publisher's version of record, the PMC archive and the Europe PMC full-text XML all carry "299" in the abstract, introduction and Results and "32–299%" in the Discussion, with 5813 and 1946 in the NRSF column of Table 1.
- A correction already issued. None found (see Status).
Status
- Version of record. The DOI resolves to the publisher's page (academic.oup.com/nar/article/36/16/5221/6334562). Its abstract, Table 1 and Discussion carry the same numbers as the PMC archive: "32, 299 and 78% more", SISSRs row 26 814 / 5813 / 73 956, previous-approaches row 20 262 / 1946 / 41 582, and "32–299% more". The Europe PMC full-text XML matches as well. Every quotation above was checked verbatim against the PMC-archived text with
src/show.py. - Supplements. The supplementary archive (Supplementary Figures 1–4, as PowerPoint files) covers fragment-length estimation, the CTCF motif against tag density, and the lengths, resolution and motif counts of binding regions from previous studies. It gives no alternative site counts and does not resolve the discrepancy.
- Corrections and comments. As of 2026-10-24 I found no correction, erratum, expression of concern or retraction.
src/known.pyreturns no Crossref update relations and no PMC or Europe PMC notices, and a Crossref query for works that update this DOI returns none. The Europe PMC article record (PMID 18684996) has an empty comments-and-corrections list, and the PubMed record lists no erratum. The publisher and PMC pages show no notice. A web search for the title with "erratum", "correction" or "PubPeer" found no notice or thread. Two checks could not be completed: PubPeer returned HTTP 403 to automated requests, and the Europe PMC search endpoint returned 503 (service unavailable). - Sources. https://doi.org/10.1093/nar/gkn488 (publisher version of record); PMC article PMC2532738; Europe PMC full-text XML and supplementary files for PMC2532738; Crossref; Europe PMC record MED/18684996; PubMed; PubPeer; abstract of doi:10.1126/science.1141319 (PubMed 17540862) for the previous NRSF count.
Suggested correction
In the abstract, the introduction (second paragraph) and the Results ("ChIP-Seq datasets and binding sites"), replace
32, 299 and 78% more
with
32, 199 and 78% more
and in the Discussion (first paragraph), replace
32–299% more binding sites
with
32–199% more binding sites
Alternatively, the NRSF result could be stated as "about three times as many binding sites as previously identified (5813 vs 1946)". Table 1 needs no change.