← Back to the plain-language case
Abstract's "significant" April 2020 drop in early treatment access has a sign-flipped confidence limit
Lancet Reg Health Am (2026) · doi:10.1016/j.lana.2026.101406 · PMC13404213
Summary
The Abstract's lead interrupted time-series result is a "significant level decrease" in April 2020 in the rate of colorectal cancer treatment started within 30 days, all treatments combined: −0.035 (95% CI −0.091 to −0.022). The Results text and Table 2 print the same estimate with the interval −0.091 to +0.022. Only that version is centred on the estimate (midpoint −0.0345, against −0.0565 for the Abstract's interval), so the Abstract's upper limit carries a sign error. The correct interval contains zero (back-calculated z = −1.21, p = 0.22), and so does the interval for chemotherapy and surgery (−0.040, −0.096 to 0.018, p = 0.17). The paper's own numbers therefore do not support the "significant" immediate drops claimed in the Abstract and the Results, although its separate 2020 ITAR estimates still show a reduction in early access.
What the paper reports
Abstract, Findings:
ITS analysis revealed a significant level decrease by April 2020 for early access to all the treatments combined (-0.035; 95% CI: -0.091 to -0.022), chemotherapy (-0.040; 95% CI: (-0.096 to 0.018) and surgery (-0.040; 95% CI: (-0.096 to 0.018), while radiotherapy (0.002; 95% CI: 0.000–0.004) showed no meaningful level change.
Results, "Interrupted time series", first paragraph:
According to Table 2 and Fig. 2, for treatments initiated within 30 days, a significant immediate level decrease was observed in April 2020 for all treatments combined (estimate: -0.035; 95% CI: -0.091 to 0.022), corresponding to an absolute reduction of 3.5% in ASTAR. Similar declines were identified for chemotherapy and surgery (both -0.040; 95% CI: -0.096 to 0.018), indicating a 4.0% drop in early access for these modalities. In contrast, radiotherapy showed a small but significant positive level change (0.002; 95% CI: 0.000–0.004).
Table 2, "≤30 days", row "COVID-19" (columns All treatment, Chemotherapy, Radiotherapy, Chemotherapy + Radiotherapy, Surgery; estimate and 95% CI):
-0.035 | (-0.091 to 0.022) | -0.040 | (-0.096 to 0.018) | 0.002∗ | (0.000–0.004) | -0.000a | (-0.000 to 0.000) | -0.040 | (-0.096 to 0.018)
Table 2, footer:
p-value: ∗<0.05; ∗∗<0.01; ∗∗∗<0.001.
Methods, "Statistical analysis":
ITS analysis was conducted using two models: one using ordinary least squares (OLS) regression and the other using generalized least squares (GLS) regression.
Statistical significance was set at p < 0.05.
The primary outcome of this study was the age-standardized treatment access rate (ASTAR) per 100,000 inhabitants.
Results, "Interrupted time series", second paragraph (used below as a cross-check on the handling of minus signs):
In other hand, for treatments initiated after 60 days, the pandemic was associated with significant negative level changes for all treatments combined (-0.045; 95% CI: -0.061 to -0.029), chemotherapy (-0.033; 95% CI: -0.045 to -0.020), and combined chemoradiotherapy (-0.045; 95% CI: -0.061 to -0.029)
Table 2, ">60 days", row "COVID-19":
-0.045 | (-0.061 to 0.029) | -0.033 | (-0.045 to 0.020) | -0.009∗∗∗ | (-0.015 to 0.004) | -0.045 | (0.061–0.029) | -0.002a | (-0.005 to 0.000)
Results, "Impact of COVID-19 on treatment access rate (ITAR)":
The ITAR analysis corroborated the ITS findings and allowed direct comparison between observed and expected access levels during 2020 as seen in Table 3.
What the paper's own numbers show
Method. The level change β2 is a linear coefficient from an OLS or GLS segmented regression. Its 95% confidence interval is the symmetric Wald interval β2 ± c·SE, so the printed estimate should sit at the midpoint of its interval. From the printed limits, SE = (upper − lower) / (2c) and z = β2 / SE. I used c = 1.96, and also the t quantile with 54 residual degrees of freedom (60 monthly points from 2018 to 2022, minus β0–β3 and one sine and one cosine harmonic term). I applied this to both printed versions of the ≤30-day all-treatment interval and to the other ≤30-day level changes named in the Abstract. As a cross-check, I audited all 33 Table 2 cells that have a full interval for (a) a midpoint far from the estimate and (b) an interval that excludes 0 but has no significance star. Every number below is printed by recompute.py.txt.
| Quantity | Location | Reported | Recomputed from the paper's numbers |
|---|---|---|---|
| ≤30 days, all treatments, level change: CI as printed in the Abstract | Abstract | −0.035 (−0.091 to −0.022), "significant" | midpoint −0.0565, 0.0215 away from the estimate; upper − est minus est − lower = −0.043; not a Wald interval around −0.035 |
| Same quantity: CI as printed in the body | Results text; Table 2 | −0.035 (−0.091 to 0.022) | midpoint −0.0345, matching the estimate within rounding; contains 0 |
| Same quantity: SE, z, p from the body CI | derived | "significant" (Abstract, Results); no star (Table 2) | SE 0.0288, z = −1.21, two-sided p = 0.22 (t with 54 df: 0.22); one-sided p = 0.11 |
| Same quantity: rounding range | derived | three-decimal estimate and limits | p = 0.21 to 0.24 |
| Same quantity: what p = 0.05 would need | derived | SE 0.0288 | SE ≤ 0.0179, i.e. a 95% CI ending at 0.000 |
| ≤30 days, chemotherapy and surgery (identical values), level change | Abstract; Results; Table 2 | −0.040 (−0.096 to 0.018), "significant"; no star | midpoint −0.039; SE 0.0291, z = −1.38, p = 0.17 (t: 0.17) |
| ≤30 days, radiotherapy, level change | Abstract; Results; Table 2 | 0.002 (0.000–0.004); "no meaningful level change" (Abstract), "small but significant" (Results), one star (Table 2) | midpoint 0.002; z = 1.96 at face value; over the rounding range p = 0.001 to 0.24, so significance cannot be read from the print |
| >60 days, all treatments, level change | Results text vs Table 2 | text −0.045 (−0.061 to −0.029); table −0.045 (−0.061 to 0.029) | text midpoint −0.045 (centred); table midpoint −0.016 (not centred) |
| >60 days, chemotherapy, level change | Results text vs Table 2 | text −0.033 (−0.045 to −0.020); table −0.033 (−0.045 to 0.020) | text midpoint −0.0325 (centred); table midpoint −0.0125 |
| >60 days, chemoradiotherapy, level change | Results text vs Table 2 | text −0.045 (−0.061 to −0.029); table −0.045 (0.061–0.029) | table interval excludes its own estimate (midpoint +0.045) |
| Table 2 audit: midpoint far from estimate | Table 2, 33 cells | — | 6 cells: the three >60-day COVID-19 cells above, radiotherapy in the same row (−0.009, −0.015 to 0.004, midpoint −0.0055), the ≤30-day all-treatment "Post-pandemic start" cell (−0.004, −0.072 to 0.018, midpoint −0.027), and one >60-day intercept by a small margin |
| Table 2 audit: stars | Table 2, 33 cells | footer: ∗ p < 0.05 | 18 intervals exclude 0; 9 of them carry no star (for example 31–60 days, COVID-19, all treatments, 0.008, 0.001–0.014) |
Two results follow. First, the body version of the ≤30-day interval is the internally consistent one: it is centred on the estimate that all three locations print, whereas the Abstract's interval would need an estimate of about −0.0565. Second, that consistent interval contains zero, as does the chemotherapy and surgery interval, so neither level change reaches the paper's stated threshold of p < 0.05. The Table 2 stars agree (neither cell has one), but the audit shows the stars are applied inconsistently elsewhere in the table, so the conclusion here rests on the intervals, not on the stars.
Figure
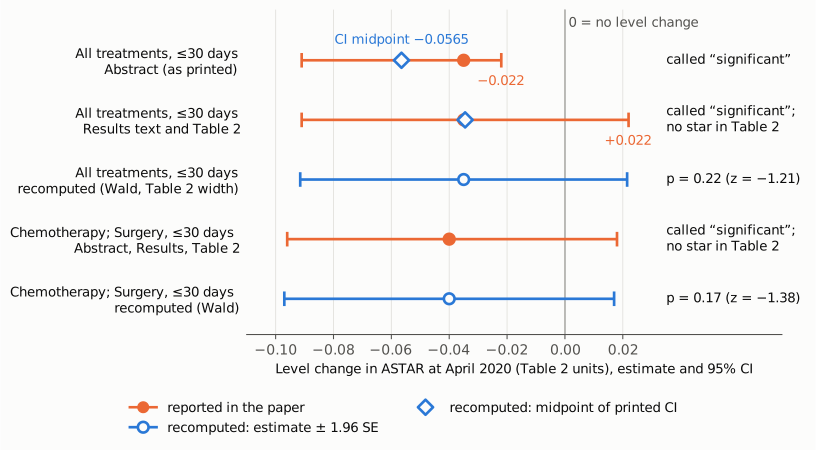
Figure 1. Estimates and 95% confidence intervals for the immediate level change at April 2020 in the ≤30-day treatment access rate, in Table 2 units, with the vertical line at 0 (no level change). Orange: values as printed in the paper, with filled dots at the printed estimates; the top row is the Abstract's interval for all treatments (upper limit −0.022), the second row the interval printed in the Results text and Table 2 (upper limit +0.022), and the fourth row the interval for chemotherapy and surgery, which the paper prints with identical values. Blue diamonds mark the midpoint of each printed all-treatment interval: −0.0565 for the Abstract, which is far from the estimate of −0.035, and −0.0345 for the body, which coincides with it. Blue open dots and lines are the symmetric Wald intervals rebuilt around each printed estimate from the printed interval width, with the two-sided p value this implies (0.22 and 0.17). Both rebuilt intervals cross 0, although the paper calls both decreases "significant".
Why it matters
The ≤30-day level change is the first interrupted time-series result in the Abstract and the first in the Results section on the time series. It is the paper's only estimate of the immediate effect of the pandemic on timely treatment for all modalities combined, and the Abstract presents it, with the chemotherapy and surgery estimates, as a statistically significant drop. With the interval the paper prints in its body, the estimate is compatible with no immediate change (p ≈ 0.22), and the same holds for chemotherapy and surgery (p ≈ 0.17). A reader of the Abstract would see an interval that excludes zero and would not know that the paper's own table gives one that does not.
The reach of the error is limited. The paper's broader conclusion that early access fell in 2020 does not rest on these coefficients alone: the ITAR estimates in Table 3 for treatment within 30 days are 0.88 (0.79–0.98) for all treatments and 0.82 (0.68–0.96) for chemotherapy, surgery and chemoradiotherapy, and both intervals exclude 1. These measure a different quantity (observed over expected access across 2020, not the immediate step in April 2020), so they do not make the level change significant, and the Results sentence that the ITAR analysis "corroborated the ITS findings" should be read with that in mind. The spatial analysis and the >60-day level changes, whose Results-text intervals exclude zero, are also unaffected. The title, the Research in context panel and the Interpretation do not quote the ≤30-day coefficient.
Two related reporting points affect how the ITS results can be read. Table 2 drops minus signs in several >60-day cells (in one case the printed interval, 0.061–0.029, excludes its own estimate of −0.045), so readers working from the table would reach wrong conclusions there too. And the Results read the coefficient −0.035 as "an absolute reduction of 3.5% in ASTAR", while the Methods define ASTAR as a rate "per 100,000 inhabitants". On that definition −0.035 is a change of 0.035 per 100,000, not 3.5 percentage points; a rough check from the Table 2 intercept and pre-pandemic trend (0.117 + 0.005 × 27 ≈ 0.25 just before April 2020, ignoring the seasonal terms) puts it nearer 14% of the pre-pandemic level. The unit of the coefficients is not stated, so this is a point for the authors to clarify, not a finding.
Explanations considered
- The Abstract and the body describe different quantities. This does not account for the numbers. All three locations give the same estimate (−0.035) for the same row of the same model: ≤30 days, all treatments, the "COVID-19" level term at April 2020. Only the sign of the upper limit differs.
- The Abstract is right and the body dropped a minus sign. Table 2 does drop minus signs in other rows, so this had to be checked. It is excluded by the symmetry of the interval. For the Abstract's interval to be a Wald interval, the estimate would have to be about −0.0565, yet −0.035 is printed in the Abstract, the Results and Table 2, and the Results restate it as "3.5%". In the >60-day rows, where the table and the Results text disagree, it is the text's version that is centred on the estimate; in the ≤30-day row, the Results text and the table agree with each other and are the centred version.
- An asymmetric or transformed interval (for example on a log scale, or a bootstrap interval). This does not account for the numbers. The Methods describe OLS and GLS regressions of the monthly rate on its natural scale, whose coefficient intervals are symmetric, and the body interval for this coefficient, like most intervals in Table 2, is centred on its estimate.
- A one-sided test, t rather than normal critical values, or rounding. None of these changes the conclusion. The Methods set significance at p < 0.05 and mention no one-sided tests; even one-sided, p = 0.11. With a t distribution on 54 df, p = 0.22. Over the full rounding range of the three printed numbers, p stays between 0.21 and 0.24.
- "Significant" means substantively important, not statistically significant. This cannot be ruled out from the wording, but the Abstract attaches the word to a 95% CI, and the same paragraph of the Results uses "small but significant" for a radiotherapy change of 0.002 that carries a significance star. Read either way, the Abstract's printed interval excludes zero and the paper's own interval does not.
- The significance star convention settles it. It points the same way but is not decisive on its own: neither the all-treatment nor the chemotherapy and surgery cell has a star, but 9 of the 18 Table 2 intervals that exclude zero also have none. The argument above rests on the intervals.
- A conversion or typesetting error in the archived text. This is excluded. The PMC page, the publisher-supplied full-text XML in Europe PMC (where every minus sign is the U+2212 character) and the PubMed abstract (PMID 42516946) all carry −0.022 in the Abstract and 0.022 in the Results and Table 2.
- A correction or supplement resolves it. No correction notice and no supplementary material were found (see Status).
Status
- Version of record. The publisher's own pages (doi.org, which redirects to linkinghub.elsevier.com; thelancet.com; sciencedirect.com; the Lancet PDF; the Elsevier text-mining API) returned redirects or HTTP 403 to automated requests and could not be read. I compared three copies derived from the publisher's XML: the PMC article page (PMC13404213), the Europe PMC full-text XML, and the PubMed record (PMID 42516946). All three carry the Abstract interval −0.091 to −0.022 and the Results and Table 2 interval −0.091 to 0.022, so the discrepancy is in the published text. Every quotation above was confirmed verbatim against the PMC-archived text with
src/show.py. - Supplements. The PMC and Europe PMC full text contain no supplementary-material element, and the Europe PMC supplementary-files endpoint returns 404. The data-sharing statement points to the public DATASUS and IBGE databases; no model output or analysis code is deposited, so the unrounded estimates cannot be checked.
- Corrections and comments. As of 2026-10-24 I found no correction, erratum, expression of concern or retraction. Crossref lists no update relations for the DOI (this also covers the Retraction Watch data held in Crossref), and PMC, Europe PMC and PubMed list no correction notices or linked comments. A web search for corrections or comments on the article found none. The PubPeer search API refused automated access (HTTP 403), so PubPeer could not be checked directly.
- Sources. PMC article PMC13404213; Europe PMC full-text XML for PMC13404213; PubMed record 42516946; Crossref metadata for doi:10.1016/j.lana.2026.101406.
Suggested correction
- In the Abstract, correct the interval for the ≤30-day all-treatment level change to −0.091 to 0.022, or, if the unrounded model output gives a different interval, report that interval consistently in the Abstract, Results and Table 2.
- Revise the Abstract and the first Results paragraph on the time series so that the immediate April 2020 level changes for all treatments, chemotherapy and surgery within 30 days are not described as statistically significant (their 95% CIs include zero; back-calculated p ≈ 0.22 and 0.17), for example by describing them as point estimates of a decrease with intervals compatible with no change.
- Qualify the statement that the ITAR analysis "corroborated the ITS findings" for the ≤30-day window, since the ITAR and the level change measure different quantities and only the ITAR excludes the null.
- Correct the Table 2 cells whose intervals are not centred on their estimates, in particular the >60-day COVID-19 row (all treatments, chemotherapy, radiotherapy and chemoradiotherapy) and the ≤30-day all-treatment "Post-pandemic start" cell, and apply the significance stars consistently.
- Reconcile the radiotherapy wording ("no meaningful level change" in the Abstract, "small but significant" in the Results).
- State the unit of the Table 2 coefficients and correct the reading of −0.035 as "an absolute reduction of 3.5% in ASTAR" if ASTAR is per 100,000 inhabitants. Minor: the Methods describe the outcome of the regression model as "the monthly hand soap usage at time t", which appears to be text left over from another study and should read monthly ASTAR.