← Back to the plain-language case
Abstract effect sizes for crowding, ageing and primary care coverage disagree with the paper's Table 2
Lancet Reg Health Am (2026) · doi:10.1016/j.lana.2026.101572 · PMC13382474
Summary
The abstract reports three effects from "the final spatial GAMLSS model", each per one percentage-point increase. It gives +3.25% expected tuberculosis (TB) mortality for household crowding, +5.92% for the population aged 60 or older, and −0.30% for primary health care (PHC) coverage. The paper's Table 2 reports that model's coefficients: 0.0211, 0.0432 and −0.0025. Converted with the formula the Results themselves use, 100·(exp(β)−1), these give +2.13%, +4.41% and −0.25%. The Results text prints exactly those three values. So the abstract states each effect larger than the paper's own estimate, by 52%, 34% and 20%. No coefficient in Table 2 or in the supplement's sensitivity models (Table S3) reproduces all three abstract figures. The direction and significance of each association are unchanged, but the abstract's headline magnitudes do not match the model they cite.
What the paper reports
The abstract:
In the final spatial GAMLSS model, proportions of household crowding (>2 residents/bedroom) and elderly population (>59 years) were associated with 3.25% and 5.92% increases in expected TB mortality for each one percentage-point increase, respectively. In contrast, each one percentage-point increase in primary health care coverage was associated with a 0.30% decrease in expected TB mortality.
— Abstract, Findings
The Results, describing the same model:
Table 2 presents the final spatial GAMLSS model associated with the outcome at p-value <0.01.
— Results, "Final association model", paragraph 1
Each additional month was associated with a 0.48% [ (exp (0.0048) -1) ∗ 100] increase in the expected number of municipal-monthly TB deaths.
— Results, "Final association model", paragraph 2 (this states how coefficients are converted to percentages)
Among the contextual variables, each one percentage-point increase in the proportion of households with more than two residents per bedroom was associated with a 2.13% increase in expected TB deaths. Similarly, each one percentage-point increase in the proportion of residents aged 60 years or older was associated with a 4.41% increase,
— Results, "Final association model", paragraph 3
Each one percentage-point increase in coverage was associated with a 0.25% decrease in expected TB deaths.
— Results, "Final association model", paragraph 4
Table 2 ("Parametric covariate estimates from the spatial GAMLSS model for monthly TB deaths in São Paulo, Brazil, 2020–2024"). The columns are variable, coded variable, estimate, standard error, exponential of the estimate and p-value:
Households with more than 2 residents per bedroom (%) | prop_mais2_dorm | 0.0211 | 0.0073 | 1.0213 | =0.0041
Population aged 60 years or older (%) | prop_mais59 | 0.0432 | 0.0077 | 1.0442 | <0.0001
Primary health care coverage (%) | cobertura_aps | -0.0025 | 0.0007 | 0.9975 | =0.0002
— Table 2
I checked each quotation against the article as archived in PubMed Central (src/show.py PMC13382474). Each occurs exactly once. recompute.py.txt repeats that check.
What the paper's own numbers show
Method. The model uses a negative binomial type I distribution with a log link and an offset of log municipal population. A one-unit increase in a covariate therefore multiplies expected deaths by exp(β), a change of 100·(exp(β)−1)%. The Results state this formula for the time trend. All three covariates are measured in percent, so a one-unit increase is one percentage point. I applied the formula to the printed Table 2 coefficients. To allow for rounding, I also used the full range each coefficient could have before it was rounded to four decimals (β ± 0.00005). I inverted each abstract figure, ln(1 + p/100), to find the coefficient it would require. I formed 95% intervals as β ± 1.96·SE from the printed standard errors; the paper reports SEs and p-values but no intervals. Finally, I read every coefficient in the supplement's Table S3, which has the final model and four models that each drop one covariate. I tested whether any of them gives an abstract figure, either exponentiated or as 100·β.
| Quantity | Location | Reported | Recomputed from the paper's own numbers |
|---|---|---|---|
| Crowding (>2 residents/bedroom), % change per 1 pp | Abstract | +3.25% | +2.13% = 100·(exp(0.0211)−1); rounding range +2.127 to +2.138% |
| Crowding, % change per 1 pp | Results text; Table 2 | +2.13%; β 0.0211, exp(β) 1.0213 | +2.13% (consistent) |
| Coefficient needed for the abstract's +3.25% | Abstract vs Table 2 | β = 0.0211 | ln(1.0325) = 0.0320 |
| Population aged 60+, % change per 1 pp | Abstract | +5.92% | +4.41% = 100·(exp(0.0432)−1); rounding range +4.409 to +4.420% |
| Population aged 60+, % change per 1 pp | Results text; Table 2 | +4.41%; β 0.0432, exp(β) 1.0442 | +4.41% (+4.42% from the rounded 1.0442; consistent) |
| Coefficient needed for the abstract's +5.92% | Abstract vs Table 2 | β = 0.0432 | ln(1.0592) = 0.0575 |
| PHC coverage, % change per 1 pp | Abstract | −0.30% | −0.25% = 100·(exp(−0.0025)−1); rounding range −0.255 to −0.245% |
| PHC coverage, % change per 1 pp | Results text; Table 2 | −0.25%; β −0.0025, exp(β) 0.9975 | −0.25% (consistent) |
| Coefficient needed for the abstract's −0.30% | Abstract vs Table 2 | β = −0.0025 | ln(0.9970) = −0.0030 |
| Abstract ÷ Table 2 effect (crowding / age 60+ / PHC) | Abstract vs Table 2 | — | 1.52 / 1.34 / 1.20 |
| 95% CI implied by Table 2, % per 1 pp (crowding / age 60+ / PHC) | Table 2 (β ± 1.96 SE) | not reported | +0.68 to +3.60 / +2.85 to +6.00 / −0.39 to −0.11 |
| Other Table 2 rows: time trend, TB incidence, education, Black or brown population | Results text | +0.48%, +2.13%, −3.18%, +1.43% | +0.48%, +2.13%, −3.19%, +1.43% (consistent within rounding) |
| Crowding coefficient in the Table S3 sensitivity models | Supplement, Table S3 | 0.0040 / 0.0344 / 0.0381 | +0.40% / +3.50% / +3.88%; none is +3.25% |
| Age 60+ coefficient in the Table S3 sensitivity models | Supplement, Table S3 | 0.0357 / 0.0313 / 0.0259 / 0.0592 | +3.63% / +3.18% / +2.62% / +6.10%; none is +5.92% after conversion |
| PHC coefficient in the Table S3 sensitivity models | Supplement, Table S3 | −0.0025 / −0.0037 / −0.0024 / −0.0033 | −0.25% / −0.37% / −0.24% / −0.33%; none is −0.30% |
Within the body of the paper the numbers agree with each other. Table 2's coefficients, its exponentiated column and the Results text all match, as do the four other covariates in the table. The abstract is the only place where the three values differ. Each abstract figure needs a coefficient roughly 20–50% larger in absolute value than the one printed, which is far outside any rounding range.
Figure
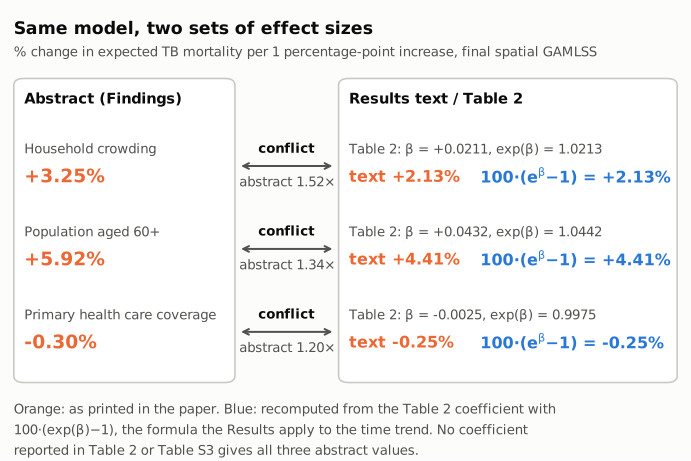
Figure 1. The left panel shows the three per-percentage-point effects in the abstract's Findings. The right panel shows, for the same covariates of the same model, the Table 2 coefficient and its printed exponential, the percentage given in the Results text, and 100·(exp(β)−1) recomputed from the coefficient. Orange marks values as printed in the paper; blue marks values recomputed in recompute.py.txt. Each connector gives the ratio of the abstract value to the recomputed value. The Results text and the recomputation agree to two decimals in all three rows. The abstract does not agree with either in any row.
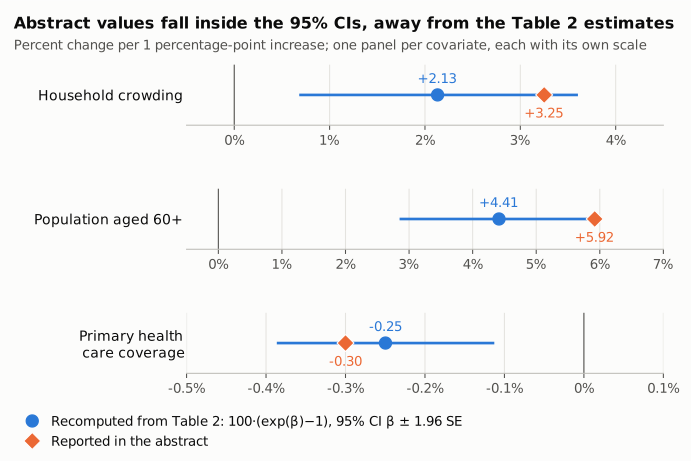
Figure 2. This figure adds the uncertainty. For each covariate, the blue dot is 100·(exp(β)−1) from Table 2 and the blue line is the 95% interval from β ± 1.96·SE. The paper reports the SEs but not the intervals. The orange diamond is the value in the abstract, and the thin vertical line marks no change (0%). Each panel has its own horizontal scale because the effects differ by more than tenfold. All three abstract values lie inside the interval, so sampling uncertainty does not separate them from the estimate. Even so, none of them is the estimate the paper reports. The age 60+ value (+5.92%) sits near the upper limit (+6.00%), and the crowding value (+3.25%) sits in the upper quarter of its interval.
Why it matters
The abstract is where most readers, and most citing papers, get a study's effect sizes. Here every number in the abstract's Findings is overstated relative to the model the abstract names. Crowding is 1.52 times the Table 2 value, age 60+ is 1.34 times and PHC coverage is 1.20 times. The overstatement grows when the effects are applied to realistic differences between municipalities. Over a 10-percentage-point difference in crowding, Table 2 implies +23.5% expected TB deaths (100·(exp(10·0.0211)−1)), while the abstract's per-point figure compounds to +37.7%. For the population aged 60+ the corresponding values are +54.0% and +77.7%. The PHC effect is small either way: −2.5% versus −3.0% per 10 points. The abstract's Interpretation ends by calling to "strengthen primary health care", and that recommendation rests on this association.
The qualitative findings are not affected. Every association keeps its direction and its significance, and each abstract value lies inside the confidence interval implied by Table 2. The Interpretation, Discussion and conclusions describe the associations without these numbers, so they stand. The error is one of reported magnitude, confined to the abstract.
Explanations considered
- A different model. The abstract names "the final spatial GAMLSS model", and the Results identify Table 2 as that model. The supplement has four more models in Table S3, each dropping one covariate. None of them gives the abstract's three values. Crowding there converts to +0.40%, +3.50% or +3.88%, and PHC coverage to −0.25%, −0.37%, −0.24% or −0.33%. One figure matches by coincidence of digits: the age 60+ coefficient in the model without the Municipal Development Index is 0.0592, which equals the abstract's 5.92 only if the coefficient is read as a percentage without exponentiating. Exponentiated, it is +6.10%. That model's other two coefficients give +3.88% and −0.33% (or 3.81 and −0.33 as 100·β), not +3.25% and −0.30%. So no single reported model, under either conversion, accounts for the three abstract figures. The supplement's R script also contains a commented-out stepwise (stepGAIC) specification with a different covariate set. No coefficients from it are published, so it cannot be checked.
- A different conversion. Under the log link, the paper's stated conversion is 100·(exp(β)−1). Reading the coefficients directly as 100·β gives +2.11%, +4.32% and −0.25%, which are also not the abstract values. Converting the abstract figures back gives coefficients of 0.0320, 0.0575 and −0.0030, none of which appears in Table 2.
- Rounding. Before rounding to four decimals, the Table 2 coefficients could range only over +2.127 to +2.138%, +4.409 to +4.420% and −0.255 to −0.245%. The abstract values are far outside these ranges. The 4.41% versus 4.42% difference between the text and the rounded exp(β) in Table 2 is rounding, and it is unrelated to 5.92%.
- A different unit or scaling. All three covariates are percentages, and both the abstract and the Results express the effect "for each one percentage-point increase". No rescaling (per SD, per 10 points) is mentioned, and none gives the abstract values. Per 10 points, for example, the Table 2 crowding effect is +23.5%.
- Text conversion or archiving artifact. The abstract numbers are plain prose. The same strings appear in the live PMC page, the Europe PMC full-text XML and the local PMC archive. The Table 2 cells line up with their rows, the minus sign on −0.0025 is intact, and the cells agree with the Results text. An artifact would not account for three different numbers.
- A deliberate rounding or summary in the abstract. The abstract gives two-decimal values, just as the Results do. They are not rounded versions of the Results values: rounding 2.13 does not give 3.25.
No explanation considered accounts for the abstract's three figures. The values in the body of the paper are internally consistent and reproduce from the printed coefficients.
Status
- Version of record. The publisher pages could not be read: doi.org redirects to linkinghub.elsevier.com, which returned only a redirect stub; thelancet.com and ScienceDirect returned HTTP 403; the Elsevier text-mining API returned 429 and then 400. The publisher-supplied text was therefore checked in two archived copies. Both the live PMC page (https://pmc.ncbi.nlm.nih.gov/articles/PMC13382474/, re-fetched 2026-10-23) and the Europe PMC full-text XML contain the abstract string with "3.25% and 5.92% increases" and "a 0.30% decrease". The PMC page also has the Results values "2.13%" and "0.25%".
- Supplement. Supplementary file mmc1.pdf (14 pages, via Europe PMC) was read in full. It contains Tables S1–S3 and the R GAMLSS script. Table S3's final-model column repeats Table 2 (0.0211, 0.0432, −0.0025).
- Corrections and retractions. None were found in Crossref update metadata, PMC notices or Europe PMC (
src/known.py, 2026-10-23). - PubPeer. The PubPeer API requires browser verification and returned no results to the automated query. Web searches for the title together with "PubPeer", "erratum" or "correction" found no thread or notice. No PubPeer discussion was found as of 2026-10-23, but the search could not be done directly on PubPeer.
As of 2026-10-23.
Suggested correction
In the abstract's Findings, replace the three effect sizes with the values the paper reports in its Results and Table 2. Adding the confidence intervals would also help:
In the final spatial GAMLSS model, proportions of household crowding (>2 residents/bedroom) and elderly population (>59 years) were associated with 2.13% and 4.41% increases in expected TB mortality for each one percentage-point increase, respectively. In contrast, each one percentage-point increase in primary health care coverage was associated with a 0.25% decrease in expected TB mortality.
If the authors meant the abstract to report a different model, the abstract should name that model and its coefficients should be published. As shown above, though, none of the reported models gives all three current figures. The other numbers in the Results that we checked need no change.