← Back to the plain-language case
The abstract reports a positive temperature association with H7 spread; the paper's own coefficients are negative
Nat Commun (2026) · doi:10.1038/s41467-026-72718-9 · PMC13351079
Summary
The abstract states that "temperature and poultry density show positive association" with the spread of H7 influenza viruses. The paper's Bayesian phylogeographic GLM reports the opposite sign for temperature: β = −0.484 (95% HPD −0.900 to −0.237) at origin and β = −0.227 (95% HPD −0.499 to −0.047) at destination. These are the estimates of the model without sample size (Fig. 9A). Both intervals lie entirely below zero, so by the paper's own rule both effects are significant and negative, and the Results and Discussion describe them that way ("a negative and supportive predictor"; "the negative correlation between temperature and transmission risk"). In the alternative models that add sample size as a predictor (Fig. 9B; Supplementary Fig. 24B), temperature is rarely included (activation rates of 2.7% or less) and its intervals span zero, so no model in the paper gives a supported positive temperature effect. The poultry-density half of the sentence agrees with the reported chicken-stock coefficient (+0.461); only the temperature direction is reversed. The error sits in the most-read part of the paper and concerns one of the named drivers of spread, but the underlying estimates and the body text are consistent with each other.
What the paper reports
In the abstract:
Geographic distance is negatively associated with the spread of the H7 virus, while temperature and poultry density show positive association.
— Abstract
The editor's summary printed with the abstract names temperature as a driver without giving a direction:
Authors show that spread of H7 avian influenza viruses is driven by geographic distance and temperature.
— Abstract (editor's summary)
In the Results, the GLM estimates are given as posterior mean and 95% HPD:
Geographic distance was strongly negatively associated with viral spread (coefficient = −0.873, 95% HPD: −0.995 to −0.753), with decisive support for its inclusion in the model (activation rate = 1) (Fig. 9A).
Chicken stock origin, defined as the number of annual chicken inventory at the source country, was consistently positively associated with virus spread (0.461, 0.111 to 0.845), while temperature origin (−0.484, −0.900 to −0.237) and temperature destination (−0.227, −0.499 to −0.047) was also considered as a negative and supportive predictor.
— Results, "Mechanisms of virus spatial spread"
In the Discussion:
Chicken stock origin consistently made a positive contribution to the spread of the virus, while temperature origin was considered as a supportively negative predictor.
Influenza viruses degrade more quickly in warm or dry conditions56, so high temperature may reduce viral persistence in the environment, which explains the negative correlation between temperature and transmission risk.
— Discussion, paragraph on the GLM
The concluding paragraph lists temperature without a direction:
Our findings highlight how geographic distance, temperature, GDP, and poultry density collectively shape viral dispersal across regions.
— Discussion, concluding paragraph
The Methods define the model and the significance rule:
This GLM approach was extended from the discrete diffusion model, which characterizes the logarithm of the transition rates within the CTMC matrix as a log-linear function dependent on multiple potential indicators of viral spread.
All predictors were log-transformed and standardized except bird migration before inclusion in the matrices.
HPD intervals (Highest Posterior Density intervals) from the posterior distribution were examined for each coefficient: if the HPD interval does not contain zero, the effect is considered significant; if it contains zero, the effect is uncertain.
— Methods, "Phylogeographic inference with epidemiological predictors"
Each quotation was checked against the article as archived in PubMed Central (src/show.py PMC13351079) and occurs exactly once; recompute.py.txt reruns that check. The archived PMC text renders minus signs as ASCII hyphens; the publisher's HTML uses the Unicode minus sign (U+2212), which is what is shown above. Footnote numerals (e.g. "56") are reproduced as they appear in the archived text.
What the paper's own numbers show
Method. The claim concerns direction only, so the check uses the paper's own estimates and its own decision rule. Under the stated model, log Λij = Σp βpδpxij,p, a negative β means that a higher (log-transformed, standardized) predictor value is associated with a lower transition rate, conditional on the predictor's inclusion. For each coefficient reported in the Results text, the sign of the 95% HPD interval was classified (entirely above zero: positive; entirely below: negative; straddling zero: uncertain) and compared with the direction the abstract states. As a descriptive aid, exp(β) gives the multiplicative change in the transition rate per one standard deviation of the predictor; its interval is the one-to-one transform of the reported HPD endpoints, which is not necessarily an HPD on that scale. No posterior samples or Fig. 9 source data are published, so the model itself cannot be re-fitted; the check is confined to the numbers the paper prints. recompute.py.txt prints every value below.
| Quantity | Location | Reported | Recomputed from the paper's own numbers |
|---|---|---|---|
| Direction of temperature association | Abstract | "positive association" | Contradicted by both temperature coefficients (rows below) |
| Temperature (origin), β and 95% HPD | Results, "Mechanisms of virus spatial spread" | −0.484 (−0.900 to −0.237); "a negative and supportive predictor" | HPD entirely below 0 (upper bound −0.237): negative, significant by the paper's rule; exp(β) = 0.616 (0.407 to 0.789), about 38% lower rate per SD |
| Temperature (destination), β and 95% HPD | Same paragraph | −0.227 (−0.499 to −0.047); same wording | HPD entirely below 0 (upper bound −0.047): negative; exp(β) = 0.797 (0.607 to 0.954), about 20% lower rate per SD |
| Direction of temperature association | Discussion | "supportively negative predictor"; "negative correlation between temperature and transmission risk" | Agrees with the coefficients |
| Chicken stock (origin), the abstract's "poultry density" | Results | +0.461 (0.111 to 0.845); abstract: positive | HPD entirely above 0: positive; exp(β) = 1.586 (1.117 to 2.328). Abstract agrees |
| Geographic distance | Results | −0.873 (−0.995 to −0.753); abstract: negative | HPD entirely below 0: negative; exp(β) = 0.418 (0.370 to 0.471). Abstract agrees |
| Abstract direction statements checked against the reported HPDs | Abstract vs Results | 4 directions (distance, poultry density, and temperature at origin and destination) | 2 of 4 agree (distance, poultry density); 2 of 4 contradicted (both temperature terms) |
Both temperature estimates printed in the text are negative, with intervals that exclude zero, and the paper's own text describes and explains a negative relationship. The abstract's "positive" cannot be derived from these numbers.
Figure
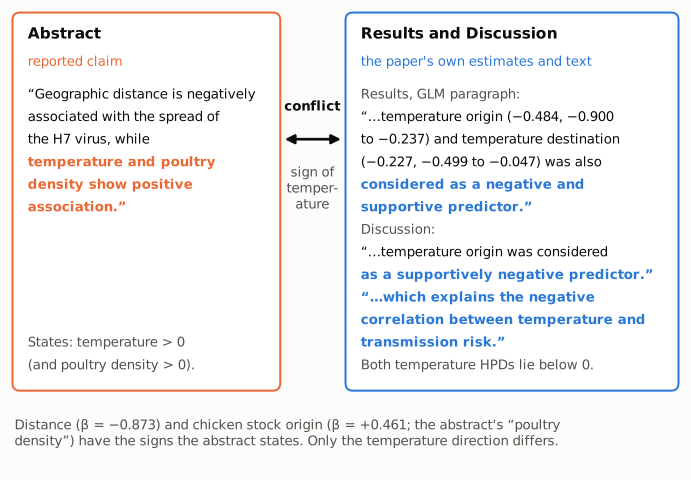
Figure 1. The conflicting statements, side by side. Left (orange): the abstract sentence, with the clause that assigns a positive association to temperature and poultry density highlighted. Right (blue): the Results sentence that reports both temperature coefficients with their 95% HPD intervals and calls temperature "a negative and supportive predictor," and the two Discussion sentences that call it "a supportively negative predictor" and explain "the negative correlation between temperature and transmission risk." The footer notes that the abstract's directions for distance and poultry density (chicken stock origin) agree with the reported coefficients; only the temperature direction conflicts.
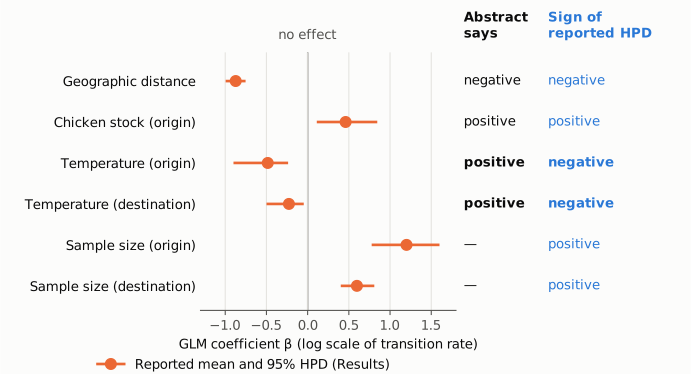
Figure 2. Reported GLM coefficients and the direction each implies. Orange dots and lines are the posterior means and 95% HPD intervals as printed in the Results text (log scale of the transition rate; the vertical line at 0 marks no effect). At right, "Abstract says" gives the direction stated in the abstract (a dash where it states none), and the blue "Sign of reported HPD" column gives the direction implied by each interval under the paper's rule. The two temperature rows, in bold, are the only ones where the two columns disagree; both intervals lie entirely to the left of zero. The sample-size coefficients are shown for context only; according to the Fig. 9 legend they come from the model that includes sample size (Fig. 9B). The other four are from the Fig. 9A model (the distance value is cited to Fig. 9A in the text; the others match the Fig. 9A plot).
Why it matters
- The abstract reverses the direction of a named driver. Temperature is one of only two drivers named in the editor's summary ("driven by geographic distance and temperature"). A reader who sees only the abstract, as in indexing and alerting services, is told that warmer conditions go with more H7 spread, when the paper's estimates say warmer conditions go with less (about 38% lower transition rate per SD of log-transformed origin temperature, conditional on inclusion).
- The stated direction matters for the paper's own recommendations. The Discussion proposes "[I]ntegrating real-time environmental variables such as temperature monitoring into early warning systems" and explains the negative effect through faster viral degradation in warm conditions. Read with the abstract's positive sign, that mechanism would be contradicted and the direction of a temperature-based alert would be reversed.
- The main conclusions are unaffected. The coefficients themselves, the Results and the Discussion agree with one another. Nothing else in the paper depends on the abstract's sign: not the distance effect, the host-specific spread velocities, the roles of Anseriformes and Galliformes, Asia as an epicentre, or the One Health recommendations. The error is confined to one clause of one abstract sentence.
Explanations considered
- A different model reports a positive temperature effect. No model gives a supported positive effect. The paper fits a model without sample size (Fig. 9A) and one with it (Fig. 9B), and repeats both with GDP per capita added (Supplementary Fig. 24A and B, described as "similar"). In the two models without sample size, both temperature terms are negative: the text gives −0.484 and −0.227 for Fig. 9A, and Supplementary Fig. 24A plots means of about −0.45 and −0.2 with posterior draws below zero (activation rate 56.7% for Temperature (o)). In the two models with sample size, temperature has almost no inclusion support and intervals that span zero. In Fig. 9B the plotted means are about −0.33 (origin) and −0.02 (destination), with activation rates of 1.9% and 0.1%. In Supplementary Fig. 24B the Temperature (o) mean is plotted slightly above zero (about +0.15), but its median is about −0.35, its 95% HPD runs from roughly −0.8 to +2.4, and its activation rate is 2.7%; Temperature (d) sits near zero at 0.1%. Under the paper's rule, these are "uncertain" effects, not positive ones. The values for Fig. 9B and Supplementary Fig. 24 are read by eye from the publisher's figure images, as no source data are published for them. The model the text reports and the abstract summarizes is the one with significant negative temperature terms.
- "Positive association" means "supported for inclusion," not direction. This does not fit the sentence. The same sentence uses "negatively associated" for distance, which can only be a direction, and the Results keep the two ideas separate by calling temperature "a negative and supportive predictor." Even under this reading, the destination term would not qualify: the activation rate printed for Temperature (d) in Fig. 9A is 0.7%, which falls in the band the Methods describe as "<5% suggests potential unimportance." (Temperature (o) is printed at 68.0%.)
- Sign convention or transformation. The Methods specify a log-linear model of the transition rates with log-transformed, standardized predictors. Under that parameterization a negative β is a negative association, and the Discussion reads it that way. The transformation of the temperature variable does not change the sign of its association with spread.
- Confusion with a correlated predictor. The Results report a Spearman correlation of r = −0.65 between GDP per capita and temperature, and GDP was dropped from the final model for that reason. That is a correlation between two predictors, not the association of temperature with spread, and adding GDP does not produce a supported positive temperature effect (item 1): in Supplementary Fig. 24A both temperature terms remain negative, and in Supplementary Fig. 24B the origin term is included in 2.7% of samples with an interval spanning zero.
- "Poultry density" carries the positive sign and temperature was listed alongside it. The sentence does not allow that reading. "temperature and poultry density show positive association" makes the two nouns the joint subject of one plural verb, so as printed it assigns a positive direction to both. It also contrasts them ("while") with distance, which is "negatively associated". A reader cannot recover the negative temperature effect from the abstract.
- Rounding, a typo in the coefficients, or a text-conversion error. None applies. The sign is carried by the words "negative" and "positive" as well as by the minus signs, and the minus signs in the Results text agree with the Fig. 9A plot, where both temperature distributions lie below the zero line. The publisher's HTML and the PMC archive give the same abstract wording.
Limitations
- The check uses only the numbers the paper prints. No posterior samples, log files or Fig. 9 source data are published (the Source Data file covers Figs 1 and 8), so the GLM was not refitted and the HPD intervals were not recomputed.
- The values for Fig. 9B and Supplementary Fig. 24A and B are not given in the text and were read by eye from the publisher's figure images. They are approximate, but the finding does not depend on their exact values: none of them is a supported positive effect.
- exp(β) is shown only as a descriptive aid. It is conditional on the predictor's inclusion, and its interval is a transform of the reported HPD endpoints, not an HPD on that scale.
Status
As of 2026-10-23:
- Quotations. The 13 passages quoted in this write-up (listed in
recompute.py.txt) were each found exactly once in the PMC-archived text (src/show.py PMC13351079 --full);recompute.py.txtreruns that check, treating the PMC text's ASCII hyphens as the publisher's minus signs. - Numbers. Every number in the table and in Figure 2 is re-derived by
recompute.py.txtfrom the coefficients printed in the Results text. - Figures in the paper. Fig. 9 (publisher's image) and Supplementary Fig. 24 (supplementary PDF, p. 22) were inspected by eye; no values were extracted from them beyond the approximate readings in item 1.
- Refit. Not possible: no posterior samples or GLM source data are available.
- Corrections.
src/known.py(run 2026-10-23) returned empty lists: no Crossref updates and no PMC or Europe PMC correction or retraction notices.
Sources: PMC13351079 (PubMed Central archive, read with src/show.py); https://doi.org/10.1038/s41467-026-72718-9 (publisher's article page and Fig. 9 image); Supplementary Information PDF (41467_2026_72718_MOESM1_ESM.pdf), p. 22.
Suggested correction
In the Abstract, replace "while temperature and poultry density show positive association" with "while poultry density shows a positive association and temperature a negative association", so that the abstract matches the coefficients in the Results (temperature origin −0.484, 95% HPD −0.900 to −0.237; temperature destination −0.227, −0.499 to −0.047) and the Discussion. The authors could also state in the Results that, in the model that includes sample size (Fig. 9B), temperature has low inclusion support (activation rates 1.9% and 0.1%) and intervals that span zero.