← Back to the plain-language case
GHF-ACL F1 scores in Tables 5, 6 and 9 exceed what their precision and recall allow
PLoS Comput Biol (2026) · doi:10.1371/journal.pcbi.1014461 · PMC13327522
Summary
The paper proposes GHF-ACL, a graph contrastive learning model for herb–disease association prediction, and reports precision, recall and F1 for it and for baseline models under five-fold cross-validation. On the Ethnobotany dataset (Table 6) it reports precision 0.7217, recall 0.9955 and F1 0.9885. F1 is the harmonic mean of precision and recall, so these inputs give 0.8368, and no averaging of folds can lift the mean F1 above that. The same check finds a second large gap on Cdata (Table 5: reported 0.9241, at most 0.7625) and smaller ones on LRSSL and in two ablation rows, while all 28 baseline rows match to within 0.0006 on the high side. With values consistent with the paper's own precision and recall, GHF-ACL does not have the best F1 on Ethnobotany or Cdata, so the claim of F1 superiority across all datasets (Abstract, Introduction, Results, Conclusion) is not supported. The AUPR results, the paper's stated primary metric, are not affected.
What the paper reports
Table 6 (Ethnobotany), header and two of its four rows:
DataSet | Model | AUPR | Precision | Recall | F1 Score | AUC Ethnobotany | HGHDA | 0.9033 | 0.8196 | 0.8618 | 0.8400 | 0.9028 | GHF-ACL | 0.9324 | 0.7217 | 0.9955 | 0.9885 | 0.9296
Table 5 (LRSSL, Ldata, Cdata), header and, for each dataset, the best-F1 baseline (DD-HGNN+) and the GHF-ACL row. Rows are excerpted. In the paper the dataset label appears only on each block's first row (LAGCN), so the dataset cells here are blank, as in the original, and each pair is introduced by its dataset name.
DataSet | Model | AUPR | Accuracy | Precision | Recall | F1 Score | AUC
LRSSL:
| DD-HGNN+ | 0.7460 | 0.9996 | 0.9082 | 0.7624 | 0.8289 | 0.9991 | GHF-ACL | 0.7821 | 0.9988 | 0.7247 | 0.9922 | 0.8510 | 0.9347
Ldata:
| DD-HGNN+ | 0.6886 | 0.9820 | 0.6527 | 0.6128 | 0.6325 | 0.9780 | GHF-ACL | 0.6979 | 0.8140 | 0.6719 | 0.8865 | 0.5809 | 0.9273
Cdata:
| DD-HGNN+ | 0.8954 | 0.9995 | 0.8356 | 0.9336 | 0.8819 | 0.9996 | GHF-ACL | 0.9295 | 0.9996 | 0.6355 | 0.9528 | 0.9241 | 0.8157
Table 9 (ablation on LRSSL), header and two of its five rows:
Model Variant | Loss | Accuracy | Precision | Recall | F1 Score | AUC w/o Structural Interaction Alignment | 0.84918 | 0.37407 | 0.2855 | 0.9329 | 0.5456 | 0.8847 w/o Cluster-level Contrastive Loss | 0.82725 | 0.46601 | 0.3781 | 0.9453 | 0.5901 | 0.8867
Abstract:
Extensive experiments on five datasets demonstrate that GHF-ACL achieves superior or competitive performance over six state-of-the-art models across most metrics, with significant improvements over the best-performing baseline model in AUPR (+4.8% on LRSSL, + 3.81% on Cdata), F1 score, and Recall.
Introduction, list of contributions:
Performance Superiority: Extensive experiments on five datasets demonstrate that GHF-ACL consistently outperforms baselines across AUPR, Recall, and F1 metrics, exhibiting remarkable robustness particularly in imbalanced prediction scenarios.
Section 3.1, Experimental setup (how the table values were obtained):
We employed a five-fold cross-validation strategy to ensure robustness and assess generalization capabilities. The dataset was randomly partitioned into five equal subsets; in each iteration, one subset served as the test set while the remaining four constituted the training set. This procedure was repeated five times, and the results were averaged to mitigate randomness and enhance statistical reliability.
Given the highly imbalanced nature of the herb–disease association prediction task, AUPR is adopted as the primary evaluation metric, as it emphasizes the model’s ability to correctly identify positive associations.
Section 3.2, Experimental and comparative results:
The results in Tables 5 and 6 present a comparative analysis of various methods under five-fold cross-validation. GHF-ACL consistently outperforms the other models in AUPR, Recall, and F1 Score across all evaluated datasets, while AUC performance varies across datasets due to differences in class imbalance severity.
Additionally, the model attained a Recall of 0.9922 and an F1 Score of 0.8510, indicating high sensitivity to true positives while maintaining a balanced performance.
While GHF-ACL did not consistently yield the highest Accuracy or Precision, it exhibited stable overall performance. Notably, it secured particularly strong results in AUPR and F1 Score, which are considered more reliable indicators of model efficacy in imbalanced scenarios.
Additionally, the slightly lower precision observed on the Cdata dataset can be attributed to its extreme sparsity. In such cases, GHF-ACL tends to emphasize higher recall to ensure broader coverage of potential associations.
Conclusion:
Extensive experiments demonstrate that GHF-ACL achieves superior performance in AUPR, Recall, and F1 Score on both herbal and cross-domain datasets, demonstrating particular strength in identifying true positive associations under class-imbalanced conditions.
What the paper's own numbers show
Method. For one set of thresholded predictions, F1 = 2PR/(P+R), the harmonic mean of precision P and recall R. It can never exceed the arithmetic mean (P+R)/2. With P = 0.7217 it cannot exceed 2P/(1+P) = 0.8384 even at perfect recall. The paper's metrics are averages over five folds. The harmonic mean is concave and increasing in both arguments, so by Jensen's inequality the mean of the fold F1 values cannot exceed the harmonic mean of the mean precision and mean recall: mean(F1ᵢ) ≤ 2·P̄·R̄/(P̄+R̄). That makes 2PR/(P+R) of the reported values the ceiling for a reported mean F1. A mean F1 below the ceiling is possible when folds differ. I checked the ceiling three ways. A constrained optimisation over five folds reaches exactly the ceiling and never more. A random search over 200,000 five-fold sets never exceeds it. A third variant computes F1 once on predictions pooled over folds while P and R stay fold means. Assuming folds of equal size, as the paper describes (Section 3.1: "randomly partitioned into five equal subsets"), this raises the ceiling by at most 0.0020. Every one of the 37 F1 values in Tables 5, 6, 7 and 9 was tested, allowing ±0.00005 for four-decimal rounding of each input. All numbers below are printed by recompute.py.txt.
| Quantity | Location | Reported | Recomputed from the paper's numbers |
|---|---|---|---|
| GHF-ACL F1, Ethnobotany | Table 6 | 0.9885 (P 0.7217, R 0.9955) | ceiling 2PR/(P+R) = 0.8368; (P+R)/2 = 0.8586 |
| Rounding margin, Ethnobotany | Table 6 | F1 ≥ 0.98845 | ceiling ≤ 0.83682 over the rounding range of P and R |
| Highest five-fold mean F1, Ethnobotany | Table 6 | 0.9885 | 0.8368 (numerical optimum); 0.8368 if F1 is pooled over folds |
| Precision needed for F1 0.9885 at R 0.9955 | Table 6 | P 0.7217 | 0.9816 |
| F1 at P 0.7217 with recall 1.0 | Table 6 | 0.9885 | 0.8384 |
| GHF-ACL F1, Cdata | Table 5 | 0.9241 (P 0.6355, R 0.9528) | ceiling 0.7625; (P+R)/2 = 0.7941; pooled-F1 ceiling 0.7637 |
| Precision needed for F1 0.9241 at R 0.9528 | Table 5 | P 0.6355 | 0.8971 |
| GHF-ACL F1, LRSSL | Table 5; Table 9 (Full Model); Results text | 0.8510 (P 0.7247, R 0.9922) | ceiling 0.8376 (pooled-F1 ceiling 0.8376) |
| Ablation w/o Structural Interaction Alignment, F1 | Table 9 | 0.5456 (P 0.2855, R 0.9329) | ceiling 0.4372 (pooled 0.4392) |
| Ablation w/o Cluster-level Contrastive Loss, F1 | Table 9 | 0.5901 (P 0.3781, R 0.9453) | ceiling 0.5402 (pooled 0.5416) |
| GHF-ACL F1, Ldata | Table 5 | 0.5809 (P 0.6719, R 0.8865) | 0.7644; reported value is below the ceiling, which is possible if folds differed widely |
| GHF-ACL F1, Hdata cold start | Table 7 | 0.8572 (P 0.8281, R 0.8880) | 0.8570; consistent |
| Ablation w/o High-order / w/o Hierarchical CL, F1 | Table 9 | 0.4345 / 0.2459 | 0.4345 / 0.3158 (the second is below the ceiling, possible) |
| All 28 baseline rows | Tables 5, 6, 7 | e.g. HGHDA 0.8400; DD-HGNN+ Cdata 0.8819 | e.g. 0.8402; 0.8819. Largest excess over the ceiling +0.0006; largest shortfall −0.0112 |
| Macro (two-class) F1 ceiling, Ethnobotany / Cdata | Tables 6, 5 | 0.9885 / 0.9241 | (ceiling + 1)/2 = 0.9184 / 0.8812 |
| Cdata F1 under other averaging conventions | Table 5 (accuracy 0.9996) | 0.9241 | prevalence implied by accuracy, P and R 0.00067; macro 0.8811, weighted 0.9996, micro = accuracy 0.9996 |
| Best F1 with consistent values, Ethnobotany | Table 6 | GHF-ACL 0.9885 (first) | GHF-ACL ≤ 0.8368 < HGHDA 0.8400 |
| Best F1 with consistent values, Cdata | Table 5 | GHF-ACL 0.9241 (first) | GHF-ACL ≤ 0.7625 < DD-HGNN+ 0.8819 |
| Best F1, LRSSL | Table 5 | GHF-ACL 0.8510 (first) | GHF-ACL ≤ 0.8376, still above DD-HGNN+ 0.8289 |
| Best F1, Ldata | Table 5 | GHF-ACL 0.5809 | already below DD-HGNN+ 0.6325 as reported |
The baseline rows show that the method fits these tables. Their F1 values sit on the ceiling or just below it, which is what fold averaging produces. The GHF-ACL rows on Ethnobotany and Cdata sit 0.15 and 0.16 above it (0.1517 and 0.1616). Each excess is larger than the margin by which the reported GHF-ACL F1 leads the best baseline (0.1485 over HGHDA on Ethnobotany, 0.0422 over DD-HGNN+ on Cdata). The LRSSL row is 0.0134 above its ceiling, and the two ablation rows are 0.05 and 0.11 above theirs. Neither rounding nor any of the averaging schemes above closes these gaps.
Figure
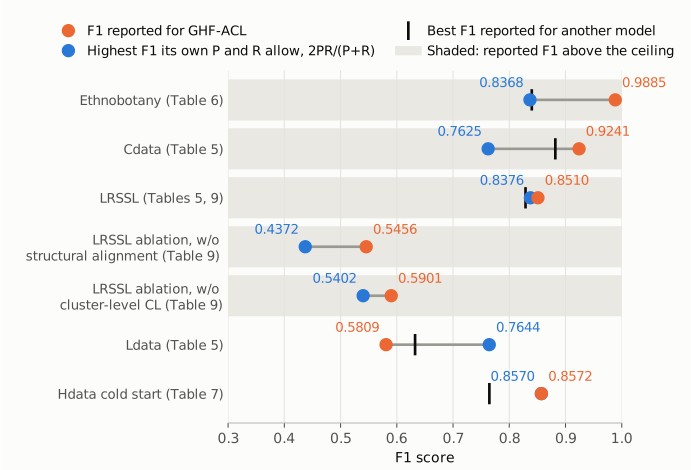
Figure 1. One row per GHF-ACL result. Orange dots are the F1 values reported in the paper. Blue dots are 2PR/(P+R) computed from the precision and recall in the same row, which is the highest F1 that a five-fold mean can reach given those mean precision and recall values. Black ticks mark the best F1 reported for any other model on the same dataset; the ablation rows have no comparator. Shaded rows have a reported F1 above the ceiling. On Ethnobotany and Cdata the reported F1 ranks GHF-ACL first, while the ceiling ranks it below HGHDA (0.8400) and DD-HGNN+ (0.8819). On Ldata the reported F1 is below the ceiling, which is possible. On Hdata (Table 7) the two values agree.
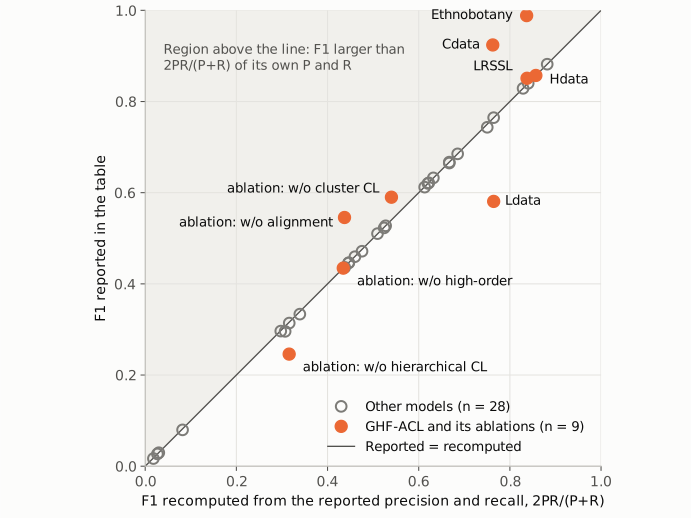
Figure 2. Every F1 value in Tables 5, 6, 7 and 9 (the Table 9 full model duplicates the LRSSL row of Table 5 and is drawn once), plotted against 2PR/(P+R) of the precision and recall in the same row. The line marks reported = recomputed. Points above it are F1 values larger than their own precision and recall allow. All 28 baseline rows (open gray circles) lie on or just below the line. The points far above it are GHF-ACL rows: Ethnobotany, Cdata and two ablation variants, with LRSSL just above. This indicates that the problem is specific to these rows rather than a convention applied to the whole table.
Why it matters
F1 is one of the three metrics on which the Abstract claims "significant improvements over the best-performing baseline model", along with AUPR and recall. The contributions list, the Results ("consistently outperforms the other models in AUPR, Recall, and F1 Score across all evaluated datasets") and the Conclusion repeat the claim. The Results also give F1 as one of two metrics on which GHF-ACL "secured particularly strong results". With F1 values consistent with the paper's own precision and recall, GHF-ACL would not rank first on Ethnobotany (at most 0.8368 against HGHDA's 0.8400) or on Cdata (at most 0.7625 against DD-HGNN+'s 0.8819); because these are upper bounds, it would at best rank second on each. On Ldata the paper's own reported F1 (0.5809) is already below DD-HGNN+ (0.6325). That leaves LRSSL among the Table 5 and 6 datasets, plus the cold-start Hdata comparison in Table 7, as the settings where an F1 lead for GHF-ACL remains possible. The statement that GHF-ACL leads on F1 across all evaluated datasets is therefore not supported by the paper's tables.
The ablation conclusions drawn from F1 in Table 9 are also less secure, because two of the four ablation F1 values exceed their own ceilings. For example, the F1 drop from removing structural alignment is 0.3054 as reported but 0.4004 if the ceilings of both rows are used. The direction of the ablation effects does not change.
The AUPR values, which the paper names as its primary metric, and the headline AUPR gains (+4.8% on LRSSL, +3.81% on Cdata) do not depend on these F1 values. The conclusion that GHF-ACL performs better than or as well as the baselines on AUPR stands. The error concerns a key secondary result and the claims built on it, not the paper's main conclusion.
Explanations considered
- Rounding. This does not account for the numbers. Over the full rounding range of the four-decimal inputs, the Ethnobotany ceiling is at most 0.83682, while the smallest value that rounds to 0.9885 is 0.98845. The LRSSL gap (0.0134) is also more than a hundred times the rounding margin.
- Averaging over folds or repeated runs. This does not account for the numbers. If P, R and F1 are each averaged over the same folds, the mean F1 cannot exceed 2P̄R̄/(P̄+R̄), and the numerical optimum reaches exactly that value. Computing F1 once on predictions pooled over folds, while P and R are fold means, raises the ceiling by at most 0.0020 (Cdata 0.7637, against a reported 0.9241), assuming the five folds are of equal size as Section 3.1 states. Averaging can explain an F1 below the ceiling, as on Ldata, but not one above it.
- Choosing the best epoch or threshold for each metric separately. For P, R and F1 that all come from one fold's predictions, this cannot raise the reported F1 above the ceiling. F1 at any evaluation point is at most the harmonic mean of that point's P and R, and the harmonic mean only grows when P or R grows. The ceiling can be exceeded only if the reported precision and recall were taken from a different evaluation than the F1: another epoch, threshold or run. The paper describes no such procedure. The released code does not settle the question (see Status). If this is the explanation, the GHF-ACL rows combine metrics from different evaluations, and the F1 comparison with the baselines, whose rows are internally consistent, is not like-for-like.
- A different F1 convention (macro, weighted or micro averaging over classes). This does not account for Cdata. Using the accuracy, precision and recall in the same row, positives make up about 0.067% of evaluated pairs. That gives macro F1 0.8811, weighted F1 0.9996 and micro F1 0.9996, and none of them is 0.9241. For Ethnobotany, macro F1 could be at most 0.9184. A support-weighted F1 would equal 0.9885 only if positives were 3.21% of the evaluated pairs, which the paper does not report. That convention would also differ from the one used for every baseline row and for the other GHF-ACL rows, all of which match the positive-class formula. The released code computes the positive-class F1, 2PR/(P+R).
- A typing error in precision rather than in F1. This is possible for Ethnobotany, where the reported F1 would fit a precision of 0.9816. That would make GHF-ACL also best on precision there, which conflicts with the Results statement that it "did not consistently yield the highest Accuracy or Precision". For Cdata, F1 0.9241 would need a precision of 0.8971, above DD-HGNN+'s 0.8356. The Results, however, specifically discuss "the slightly lower precision observed on the Cdata dataset", which fits the printed 0.6355 and not 0.8971. Either way, at least one value in each of these rows is wrong.
- Conversion or typesetting error in the archived text. This is excluded. The values are the same in the PMC text, the Europe PMC XML, the publisher's table images and the publisher's PDF, and in both publisher versions (see Status).
- A disclosed alternative in a supplement. This is excluded. The article has no data supplement. Its only supplementary files are the two response-to-reviewers letters (see Status).
Status
- Version of record. The publisher's page (journals.plos.org/ploscompbiol, reached via doi.org) presents Tables 5 and 6 as images. The full-size image of Table 6 shows the Ethnobotany GHF-ACL row as 0.9324 | 0.7217 | 0.9955 | 0.9885 | 0.9296 under AUPR | Precision | Recall | F1 Score | AUC, with the cells aligned under their headers. The publisher's 28-page PDF (Table 6 on p. 18) gives the same text. The Cdata GHF-ACL row of Table 5 reads the same in the PDF and in the Europe PMC full-text XML. The publisher lists two versions, an uncorrected proof (rev=1) and the current version (rev=2). Crossref records the new version on 2026-07-02. The table image files are byte-identical across the two versions, and the text differences between them are limited to affiliation names and whitespace, with no changed numbers. Every passage quoted above was confirmed verbatim against the PMC-archived text with
src/show.py. - Code. The Data Availability statement points to a public GitHub repository (the repository "TCM"; checked at its 2025-12-02 state). Its
main2.pycomputes precision and recall with Keras metrics on predictions thresholded at 0.5, and F1 as2 * precision_value * recall_value / (precision_value + recall_value)from those two values. That is the standard positive-class F1, which is subject to the ceiling used here. In the released script this function is applied to the training matrix during training. The cross-validation loop does not compute or aggregate test-set metrics: its metric array is initialised and never filled. The repository holds no per-fold results, so it shows neither how the reported table values were produced nor what the correct F1 values are. - Supplements and peer review. The only supplementary files are two response-to-reviewers letters (pcbi.1014461.s002.docx and s003.docx). Both letters and the published peer-review history were read. Neither the reviewers nor the authors raise the inconsistency between F1, precision and recall.
- Corrections and comments. As of 2026-10-24 there is no correction, erratum, expression of concern or retraction. Crossref lists only the 2026-07-02 new-version record, and PMC and Europe PMC list no notices. A web search found no PubPeer thread or other published comment. PubPeer's own search refused automated access (HTTP 403, human verification required), so PubPeer could not be checked directly.
- Sources. PMC article PMC13327522; Europe PMC full-text XML; the publisher's article page, table images, PDF and peer-review history at journals.plos.org; Crossref metadata for doi:10.1371/journal.pcbi.1014461; the GitHub code repository named in the Data Availability statement.
Suggested correction
- Recompute the GHF-ACL F1 scores for Ethnobotany (Table 6), Cdata, LRSSL (Table 5) and the two Table 9 ablation rows above their ceilings (w/o Structural Interaction Alignment and w/o Cluster-level Contrastive Loss) from the same fold-level predictions as the reported precision and recall, or correct the precision and recall if those are the wrong values. Report the per-fold precision, recall and F1 in a supplement so that readers can check the averages.
- Apply the same check to the remaining GHF-ACL and ablation rows (Ldata in Table 5; w/o Hierarchical Contrastive Loss and w/o High-order Heterogeneous Structure in Table 9), and state how the fold averages were formed. The reported F1 for Ldata and for w/o Hierarchical Contrastive Loss is well below the ceiling (0.5809 against 0.7644; 0.2459 against 0.3158), which fold averaging allows only when folds differ widely.
- Revise the F1 claims in the Abstract ("significant improvements … F1 score"), the contributions list, Section 3.2 ("consistently outperforms the other models in AUPR, Recall, and F1 Score across all evaluated datasets"; "particularly strong results in AUPR and F1 Score") and the Conclusion so that they match the corrected values. On values consistent with the paper's own precision and recall, GHF-ACL does not have the highest F1 on Ethnobotany or Cdata, and on Ldata its reported F1 (0.5809) is already below DD-HGNN+ (0.6325).
- Update the released code so that it includes the test-set evaluation and fold aggregation that produced Tables 5–9.