← Back to the plain-language case
Table 3's Z statistics imply p-values of 0.16 to 0.60, not 0.001 to 0.15
PLoS Med (2026) · doi:10.1371/journal.pmed.1005132 · PMC13313369
Summary
Table 3 reports Wilcoxon Z statistics and p-values for three patient-journey intervals of a pre-post training programme, and the Results repeat the p-values as evidence that patient delay (p = 0.02) and diagnostic delay (p < 0.001) fell. Under the stated Wilcoxon test, whose Z has a standard-normal reference, the printed Z values (0.53, 1.41, −0.55) give two-sided p-values of 0.60, 0.16 and 0.58, while the printed p-values (0.02, 0.001, 0.15) would need |Z| of about 2.33, 3.29 and 1.44. The other 11 Z/p pairs in the paper's S1 Table follow the normal relation, so only these three rows are inconsistent, and no rounding, one-sided, exact or adjusted test reconciles them. If the Z values are correct, neither the headline 54% drop in diagnostic delay nor the 9% drop in patient delay is statistically significant, which removes the stated statistical support for the abstract's "reduced diagnostic delays"; the published information does not show which column is wrong.
What the paper reports
All quotations were checked verbatim against the PMC-archived text with src/show.py. The table rows were also checked against the publisher's XML and PDF (see Status).
Table 3, "Main indicators change of intervention" (columns: interval; pre-intervention median (IQR); post-intervention median (IQR); % change; Z; P-value):
Symptom onset → first medical contact (Patient Delay) | 27 (IQR = 49) | 24.5 (IQR = 44.5) | -9.3% | 0.53 | 0.02
Symptom onset → diagnosis at first medical contact (Diagnostic Delay) | 56.5 (IQR = 87.5) | 25.8 (IQR = 40.3) | -54.2% | 1.41 | 0.001
Diagnosis at oncology center → treatment initiation (Treatment Delay)a | 69 (IQR = 91.5) | 15.9 (IQR = 21.1) | -76.9%a | -0.55 | 0.15
The only footnote (a) concerns the definition of treatment delay.
Methods, Analysis:
Stata 17 was used for quantitative data analysis. Descriptive statistics (medians, interquartile ranges) characterized delays and KAP distributions. The Wilcoxon signed-rank test compared pre- and post-training KAP scores and interval changes.
Methods, Study of the intervention:
Patient-journey intervals (symptom onset to first contact; first contact to confirmed diagnosis; diagnosis to treatment) were extracted from 100 pediatric oncology charts at baseline and 6 months post-implementation, which are all available charts during the study period.
Results, Process measures and outcomes:
Six months post-intervention, patient delay decreased by 9.3% (to 24.5 days, p = 0.02), the diagnostic interval decreased by 54.3% (to 25.8 days, p < 0.001), and the interval from diagnosis to treatment initiation increased by 11.9% (to 15.9 days, p = 0.15). Treatment initiation at the oncology center accelerated from a median of 69.0 to 15.9 days (-76.9%) (Tables 3 and S1).
Abstract, Methods and findings:
and the time from first contact to confirmed diagnosis decreased by 54.2%. Treatment initiation interval increased by 11.9%, reflecting ongoing infrastructural constraints.
Abstract, Conclusions:
A context-tailored, multilevel training and mentorship model was associated with improved provider capacity and reduced diagnostic delays in Northwest Ethiopia.
Author summary:
The median interval from symptom onset to diagnosis decreased by 54.2%, and patient delay decreased by 10.3%.
Discussion:
Compared with similar efforts in Tanzania and Uganda, which achieved 30%–40% reductions in diagnostic delays through clinician workshops alone, our 54% decrease likely reflects the added impact of engaging community health workers and formalizing referral protocols [16,23–25].
The intervention’s success is driven by concurrent gains in provider capacity, shortened diagnostic timelines, and strengthened interdisciplinary collaboration, which collectively demonstrate the model’s operational viability.
S1 Table (supporting file .s005, "Mean difference between stages of cancer and types of interventions"), column headed "Wilcoxon ranked-sum test Groups of intervention (pre & post)", gives the same three pairs (Patient delay 0.53 / 0.02; Diagnostic Delay 1.41 / 0.001; Treatment Delay −0.55 / 0.15) and 11 further Z / Sig. pairs for other intervals.
What the paper's own numbers show
Method. Stata's signrank and ranksum commands, like the Wilcoxon tests in other packages, report a standardized statistic Z and the two-sided p-value p = 2[1 − Φ(|Z|)], where Φ is the standard normal distribution function. I applied this relation to each printed Z, and inverted it to find the |Z| each printed p requires. To test robustness, I allowed for rounding of Z (±0.005) and of p, replaced the normal reference with t distributions (df 5 to 99), computed exact (permutation) Wilcoxon p-values for signed-rank samples of 20, 50 and 100 and rank-sum samples of 10 + 10 and 50 + 50, and applied the same relation to the other 11 pairs in S1 Table as a control. Every number below is printed by recompute.py.txt.
| Quantity | Location | Reported | Recomputed from the paper's own numbers |
|---|---|---|---|
| Patient delay: p for Z = 0.53 | Table 3, row 1; S1 Table; Results | 0.02 | 0.596 two-sided (0.593 to 0.600 over Z rounding); one-sided 0.298 |
| Diagnostic delay: p for Z = 1.41 | Table 3, row 2; S1 Table; Results ("p < 0.001") | 0.001 | 0.159 two-sided (0.157 to 0.160); one-sided 0.079 |
| Treatment delay: p for Z = −0.55 | Table 3, row 3; S1 Table; Results | 0.15 | 0.582 two-sided (0.579 to 0.586); one-sided 0.291 |
| |Z| needed for the printed p | — | 0.02; 0.001; 0.15 | 2.33 (2.24 to 2.43 over rounding of p); 3.29 (3.17 to 3.48; "p < 0.001" needs > 3.29); 1.44 (1.42 to 1.46) |
| Ratio, recomputed / printed p | — | — | 29.8; 158.5; 3.9 |
| p with a t reference, df = 5, 30, 99 | — | — | 0.619, 0.600, 0.597; 0.218, 0.169, 0.162; 0.606, 0.586, 0.584 |
| Exact Wilcoxon p, signed-rank n = 20, 50, 100 | — | — | 0.596, 0.598, 0.597; 0.165, 0.160, 0.159; 0.596, 0.585, 0.585 |
| Exact Wilcoxon p, rank-sum 10 + 10 and 50 + 50 | — | — | 0.579, 0.599; 0.165, 0.159; 0.579, 0.585 |
| Bonferroni over the three rows | — | — | 1.0; 0.476; 1.0 |
| Other 11 Z / Sig. pairs in S1 Table | S1 Table | e.g. 1.24 / 0.22; 2.64 / 0.01; −0.77 / 0.44; −0.98 / 0.33; −0.40 / 0.69; −0.13 / 0.90; five with |Z| 6.47 to 12.10 / < 0.001 | 0.215; 0.008; 0.441; 0.327; 0.689; 0.897; all < 10−10: all 11 consistent |
| Patient delay % change, 27 → 24.5 | Table 3; Results; Author summary and Discussion | −9.3%; "10.3%" | −9.26% |
| Diagnostic delay % change, 56.5 → 25.8 | Table 3; Results | −54.2%; "54.3%" | −54.34% |
| Treatment delay % change, 69 → 15.9 | Table 3; Results; Abstract | −76.9%; "increased by 11.9%" | −76.96% |
The medians and percentage changes in Table 3 reproduce to rounding (with a 0.1-point discrepancy between −54.2% in the table and 54.3% in the text). The inferential columns do not: all three Z/p pairs fall far off the normal relation that the paper's other 11 Wilcoxon pairs follow. For the diagnostic-delay row the printed p is 159 times smaller than the p implied by its Z. The paper gives no patient-level interval data (S4 File holds only clinician knowledge, attitude and practice scores), so the Wilcoxon tests cannot be re-run, and the correct Z or p cannot be recovered.
Figure
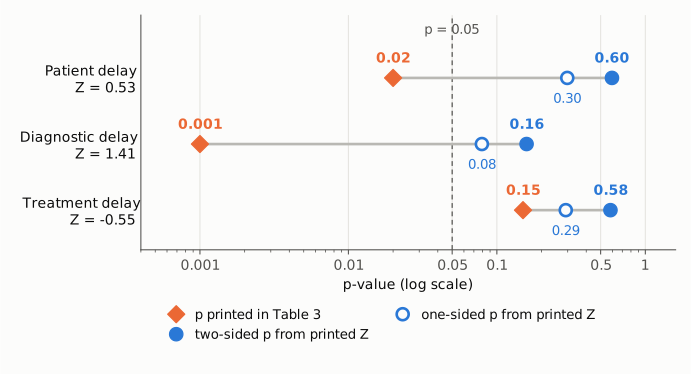
Figure 1. For each Table 3 row, the p-value printed in the table (orange diamonds) and the p-value implied by the printed Z under the stated Wilcoxon test with its standard-normal reference (blue: filled circle two-sided, open circle one-sided), on one log-scale axis. The thin dashed line marks p = 0.05. The printed values are 0.02, 0.001 and 0.15; the two-sided values implied by Z = 0.53, 1.41 and −0.55 are 0.60, 0.16 and 0.58, and the one-sided values 0.30, 0.08 and 0.29. Rounding of Z to two decimals moves the two-sided values by at most 0.004, less than a marker width. Patient delay and diagnostic delay lie on opposite sides of the 0.05 line depending on which column is believed.
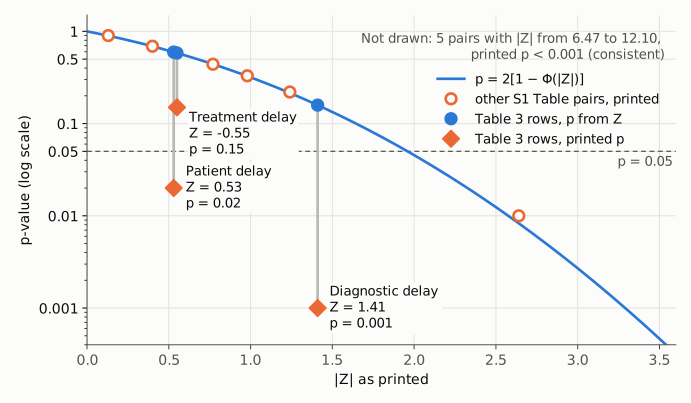
Figure 2. All Wilcoxon Z / p pairs printed in the paper's S1 Table, plotted against the relation p = 2[1 − Φ(|Z|)] (blue curve); p on a log scale. Open orange circles are the six printed pairs with |Z| below 3.6 outside Table 3; each lies on the curve to within rounding. Five further pairs with |Z| from 6.47 to 12.10 are printed as p < 0.001, also consistent, and are not drawn. The three Table 3 pairs (orange diamonds, with the p their Z implies in blue) are the only ones off the curve, by factors of 3.9 to 159. The thin dashed line marks p = 0.05.
Why it matters
- It is the paper's only test of the patient-journey outcomes. Table 3 carries the sole significance tests for the intervals from symptom onset to first contact, to diagnosis and to treatment. The Methods list these intervals as secondary outcomes (the primary outcomes are provider knowledge, attitude and practice scores), but the 54% reduction in diagnostic delay is reported in the abstract, the author summary, the Results and the Discussion.
- The conclusions on diagnostic delay depend on which column is right. If the Z values are correct, the diagnostic-delay reduction has p = 0.16 and the patient-delay reduction p = 0.60, and neither is significant at the 5% level. That would leave the abstract conclusion that the model "was associated with ... reduced diagnostic delays", the title's "accelerate early childhood cancer diagnosis", the Discussion comparison in which "our 54% decrease" exceeds the 30–40% reductions reported in Tanzania and Uganda, and the concluding statement that success is "driven by ... shortened diagnostic timelines" without statistical support from the paper. If instead the p-values are correct, the Z column is wrong and the reported significance may stand. A reader cannot tell which from the published material.
- What it does not affect. The medians, IQRs and percentage changes are not in question, and the provider knowledge and practice results, the other half of the main conclusion, rest on separate analyses. The study is a single-arm pre-post design, which the paper itself notes limits causal inference; this issue concerns only the reported statistical evidence for the change.
- The same outcomes carry further, separate inconsistencies. The Abstract and Results say the diagnosis-to-treatment interval "increased by 11.9%", while Table 3 and the next sentence of the Results report a fall from 69.0 to 15.9 days (−76.9%); the baseline 69.0 (IQR 91.5) is also the value the Results give for the "median total delay". The Author summary and Discussion give the patient-delay reduction as 10.3%, against 9.3% in Table 3, the Abstract and the Results. These do not bear on the Z/p mismatch but show that the reporting of these outcomes needs checking as a whole.
Explanations considered
- Rounding. Does not account for it. Allowing for rounding of Z to two decimals, the two-sided p-values range only over 0.593 to 0.600, 0.157 to 0.160 and 0.579 to 0.586. Allowing for rounding of the printed p, the required |Z| ranges are 2.24 to 2.43, 3.17 to 3.48 and 1.42 to 1.46, none of which contains the printed 0.53, 1.41 or 0.55.
- A one-sided test. Does not account for it. The one-sided p-values (0.298, 0.079, 0.291) are also far from 0.02, 0.001 and 0.15, and the paper does not state a one-sided test.
- A t or other heavier-tailed reference distribution. Makes the discrepancy larger: with any df from 5 to 99 the p-values rise (for example 0.162 to 0.218 for Z = 1.41).
- An exact (permutation) Wilcoxon test or a small sample. Does not account for it. With about 100 charts the normal approximation is close to exact; even at n = 20 pairs or 10 + 10 patients, the exact p for Z = 1.41 is 0.165 and for Z = 0.53 at least 0.579. Ties are already absorbed in the standardized Z that Stata reports.
- Signed-rank versus rank-sum. The Methods name the signed-rank test, while S1 Table heads the column "Wilcoxon ranked-sum test", and a reviewer in the published peer-review history asked which was used. Both tests report a standard-normal Z, so the label does not change the mapping from Z to p (the exact checks above cover both).
- A multiplicity adjustment. None is stated, and any such adjustment (for example Bonferroni: 1.0, 0.476, 1.0) would make the p-values larger, not smaller.
- The "Z" column is an effect size r = Z/√N. Not possible: 1.41 exceeds the maximum of 1 for r, and the reported p-values would imply N of about 19, 5 and 7, not about 100 charts.
- Row or column misalignment. Not supported. No Z anywhere in S1 Table is near 2.33 or 3.29, the values the printed 0.02 and 0.001 require, and the Table 3 and S1 Table values are identical, so the pairs are not shifted from neighbouring rows.
- A typesetting or conversion artifact. Ruled out. The PLOS JATS XML, the PLOS PDF, Europe PMC and PMC all carry the same values, and S1 Table, a separate Word file, repeats them. The Results text repeats the p-values.
- The software uses a different p convention. Not supported by the paper itself. The 11 other Wilcoxon pairs reported in the same column of S1 Table follow p = 2[1 − Φ(|Z|)] to rounding.
- Direction of the Z signs. Not an explanation but a further oddity: all three medians fell, yet two Z values are positive and one negative. The sign does not affect a two-sided p.
Status
- Version of record. Checked. The PLOS JATS XML (article/file?type=manuscript), the PLOS printable PDF (page 9, Table 3, doi:10.1371/journal.pmed.1005132.t003), the Europe PMC full-text XML and the PMC archive (via
src/show.py) all give the Table 3 values quoted above, and the PDF Results text repeats "p = 0.02", "p < 0.001" and "p = 0.15". Published 29 June 2026 (Crossref). - Supplements. Five supporting files are listed. S1 Table (.s005, DOCX) was opened and its 14 Wilcoxon pairs are analysed above; it repeats the three Table 3 pairs. As a side check, its Kruskal–Wallis column (χ², df = 5) mostly matches, but three of the four entries printed "< 0.001" (χ² 18.82, 18.04 and 17.16) recompute to 0.002 to 0.004; none crosses 0.05. S4 File (.s004, XLS) holds only clinician pre/post scores. S1 File (protocol), S2 File (COREQ checklist) and S3 File (assessment tool) were listed but not opened; none is described as containing patient-level interval data. The supplements do not resolve the discrepancy.
- Peer review. The published peer-review history asks why a rank-sum test was used for paired interval data, and notes that the "increased by 11.9 percent" sentence differs from Table 3. No reviewer or editor comment mentions the Z statistics or their p-values.
- Corrections and comments. As of 2026-10-24, no correction, erratum, expression of concern or retraction was found:
src/known.pyreturns no Crossref updates and no PMC or Europe PMC notices; the Crossref work record has no update-to, updated-by or relation entries. The PubPeer API returned no record (HTTP 404) for the DOI, and a web search for the title with "PubPeer" found no thread. - Sources. PMC13313369 (via
src/show.py); https://doi.org/10.1371/journal.pmed.1005132 (article, PDF, supporting files .s004 and .s005, peer-review history); Europe PMC; Crossref; PubPeer.
Suggested correction
The authors may wish to re-run the interval comparisons in Table 3 and S1 Table and report, for each row, the test actually used (signed-rank for paired data, or rank-sum if baseline and follow-up charts are from different patients, with the Methods amended to match), the Z statistic and the p-value that the software gives for it. If the printed Z values are correct, Table 3 would read approximately: patient delay Z = 0.53, p = 0.60; diagnostic delay Z = 1.41, p = 0.16; treatment delay Z = −0.55, p = 0.58. The Results sentence would then need its p-values changed, and the Abstract conclusion, Author summary, Discussion and concluding paragraph would need to describe the reductions in patient and diagnostic delay as not statistically significant. If instead the p-values are correct, the Z column should be corrected so that each Z matches its p. In either case, the authors may also wish to reconcile the treatment-delay direction ("increased by 11.9%" in the Abstract and Results against −76.9% in Table 3) and the patient-delay figure (10.3% in the Author summary and Discussion against 9.3% elsewhere), and to report the number of charts in each period.