← Back to the plain-language case
Abstract reports all headache-free subgroups at p < 0.001; Results report p = 0.126 and 0.090
Neurology (2026) · doi:10.1212/WNL.0000000000218152 · PMC13312941
Summary
This registry study of 588 participants with migraine and 147 matched healthy controls (HCs) states in its Abstract that a sensitivity analysis restricted to headache-free participants showed lower plasma CGRP than controls "across all migraine subgroups" (all p < 0.001). The paper's own Results say that, in the same analysis, controls "did not differ significantly" from migraine with aura (p = 0.126) or chronic migraine (p = 0.090). These values are about 100 times the Abstract's bound and above 0.05, and undoing the Bonferroni correction still leaves 0.042 and 0.030. The main matched-sample finding (125 vs 151 pmol/L, p < 0.001) stands, but the Results do not support the robustness claim that the Abstract and Discussion build on this analysis.
What the paper reports
Abstract, Results:
Sensitivity analyses restricted to headache-free participants confirmed the principal findings, demonstrating lower plasma CGRP concentrations across all migraine subgroups compared with controls (all p < 0.001).
Results, "Plasma CGRP Concentrations", second paragraph:
Sensitivity analyses restricted to headache-free participants produced results largely consistent with the main analysis (Figure 2). Median plasma CGRP concentrations in HCs did not differ significantly from those in participants with migraine with aura (151 [118–199] vs 143 [86–179] pmol/L; p = 0.126) or chronic migraine (151 [118–199] vs 142 [90–178] pmol/L; p = 0.090).
Results, "Plasma CGRP Concentrations", first paragraph (the main, unrestricted analysis):
Notably, all migraine subgroups exhibited significantly lower CGRP levels compared with HCs (all p ≤ 0.001).
Discussion, first paragraph:
Furthermore, preventive treatment use, including onabotulinumtoxinA specifically, was unrelated to plasma CGRP concentrations, and sensitivity analyses restricted to headache-free participants confirmed robustness of the findings.
Methods, "Statistical Analysis":
CGRP levels were compared between participants with migraine and HCs in the matched sample using the Mann-Whitney U test. As a sensitivity analysis, group comparisons were repeated in the subgroup of participants who were headache-free at the time of blood sampling.
Significance was set at a 2-sided p value of 0.05. The Bonferroni method was applied to correct for p value multiple pairwise comparisons within each subgroup analysis for the primary and secondary outcome analyses, while exploratory analyses were corrected using the Benjamini-Hochberg procedure.
Table 2, footnote a:
Mann-Whitney U tests, with p value corrected for multiple testing using the Bonferroni procedure.
Table 2 rows used below (matched sample): Healthy controls, n = 147, median 151 (118–199); Migraine with aura, n = 172, 125 (65–180); Chronic migraine, n = 380, 128 (66–179); Headache-free (interictal), n = 210, 133 (81–177), with "Interictal vs HCs" p = 0.001. The sizes of the headache-free migraine-with-aura and chronic-migraine subgroups are not reported.
Figure 2 legend (headache-free participants):
Statistically significant differences after Bonferroni correction were assessed using the Mann-Whitney U test; **p < 0.01 and ***p < 0.001.
What the paper's own numbers show
Method. First, I compared the p values that the Results give for the headache-free analysis directly with the Abstract's bound (p < 0.001) and with the paper's significance level (two-sided 0.05). Second, Table 2 lays out three pairwise comparisons per subgroup analysis (for example MA vs MO, MA vs HCs, MO vs HCs), and footnote a says the p values are Bonferroni-corrected. So I divided each reported p by 3 (and by 2 as an alternative) to get the uncorrected value, and halved it again for a one-sided test. Third, as an approximate order-of-magnitude check only, I built a deterministic pseudo-sample for each group whose quantiles match the reported median and IQR (split-normal quantile function). I then ran a two-sided Mann-Whitney U test and applied the ×3 correction. I calibrated this model on the Table 2 comparisons whose p values are printed. The headache-free subgroup sizes are not reported, so I estimated them from each subtype's share of the matched sample (MA 172/588, CM 380/588) applied to the 210 headache-free participants. I varied the estimate from 0.7× to 1.3×, and also tried the extreme n = 210, as if every headache-free participant were in the subgroup. Every number below is printed by recompute.py.txt.
| Quantity | Location | Reported | Recomputed from the paper's numbers |
|---|---|---|---|
| Headache-free sensitivity analysis, all migraine subgroups vs HC | Abstract, Results | all p < 0.001 | contradicted by the paper's own Results: p = 0.126 (MA) and 0.090 (CM) |
| Headache-free MA vs HC | Results, Plasma CGRP Concentrations ¶2 | 143 [86–179] vs 151 [118–199]; p = 0.126 | median difference −8 pmol/L; 0.126 is 126 × 0.001 and > 0.05 |
| Headache-free CM vs HC | Results, Plasma CGRP Concentrations ¶2 | 142 [90–178] vs 151 [118–199]; p = 0.090 | median difference −9 pmol/L; 0.090 is 90 × 0.001 and > 0.05 |
| Uncorrected p, headache-free MA | derived (Table 2 footnote a) | 0.126 (corrected) | 0.042 (÷3), 0.063 (÷2); one-sided 0.021; none < 0.001 |
| Uncorrected p, headache-free CM | derived (Table 2 footnote a) | 0.090 (corrected) | 0.030 (÷3), 0.045 (÷2); one-sided 0.015; none < 0.001 |
| Headache-free (all) vs HC | Table 2, "Interictal vs HCs" | p = 0.001 | does not meet "p < 0.001" either (minor) |
| Model calibration: all migraine vs HC | Table 2 | p < 0.001 | model p = 1.5 × 10⁻⁷ |
| Model calibration: MA, CM, EM, MO, ictal vs HC | Table 2 | each p < 0.001 | model p = 1.4 × 10⁻⁴, 1.1 × 10⁻⁵, 4.0 × 10⁻⁷, 2.6 × 10⁻⁷, 4.3 × 10⁻⁹ |
| Model calibration: headache-free (interictal) vs HC | Table 2 | p = 0.001 | model p = 0.0004 (the model, if anything, overstates significance) |
| Model: headache-free MA vs HC | approx., n not reported | p = 0.126 | n = 43–79: p = 0.045–0.149; n = 210: p = 0.005; smallest over n = 10–210: 0.0047 |
| Model: headache-free CM vs HC | approx., n not reported | p = 0.090 | n = 95–177: p = 0.008–0.031; n = 210: p = 0.005; smallest over n = 10–210: 0.0052 |
The contradiction does not depend on the model. It comes from the two numbers the paper prints, 0.126 and 0.090, set against the abstract's "all p < 0.001". The model only shows that the reported medians and IQRs could not have given p < 0.001 for these two comparisons at any subgroup size up to the full 210 headache-free participants. It also shows that the Results values are of the order the summary statistics imply. For chronic migraine the model gives somewhat smaller p values than reported at the expected subgroup size (0.014 at n = 136 vs 0.090). That is within what a quantile-matched approximation can resolve, and it does not bear on the 0.001 bound.
Figure
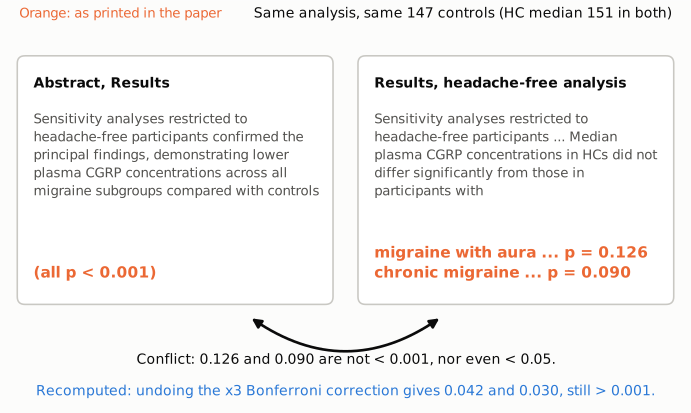
Figure 1. Short excerpts from the Abstract (left) and from the Results paragraph on the headache-free sensitivity analysis (right), with the conflicting values in orange as printed. Both passages describe the same analysis against the same 147 controls, whose median (151 pmol/L, IQR 118–199) is identical in both. The Abstract gives "all p < 0.001" for every migraine subgroup. The Results give p = 0.126 for migraine with aura and p = 0.090 for chronic migraine and say these did not differ significantly from controls. The blue line gives the values recomputed by undoing the ×3 Bonferroni correction, 0.042 and 0.030, both still above 0.001.
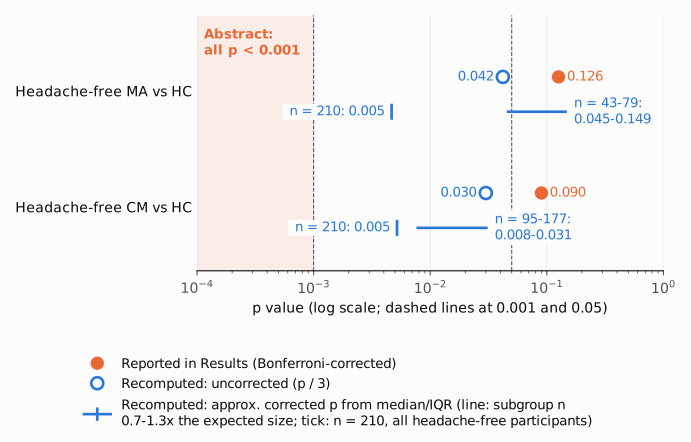
Figure 2. p values for headache-free migraine with aura (MA) and chronic migraine (CM) vs healthy controls, on a log axis with dashed reference lines at 0.001 and 0.05. The shaded band is the region the Abstract claims (p < 0.001). Orange dots are the Bonferroni-corrected p values reported in the Results. Open blue circles are the uncorrected values implied by a ×3 correction. Blue lines are approximate corrected p values recomputed from the reported medians and IQRs for subgroup sizes 0.7–1.3 times the expected size. The blue tick is the extreme case in which all 210 headache-free participants are in the subgroup. No reported or recomputed value enters the region the Abstract describes.
Why it matters
The Abstract uses the headache-free analysis to say the main result holds "across all migraine subgroups" at p < 0.001. The first Discussion paragraph repeats it as having "confirmed robustness of the findings". That claim addresses an obvious concern about the main result: participants sampled during a headache might have different CGRP levels from those sampled between attacks. The Results show that, once restricted to headache-free participants, two of the four migraine subgroups (with aura and chronic) were not significantly different from controls. A reader of the Abstract alone would conclude the opposite.
The error does not overturn the paper's headline finding. In the full matched sample, migraine was lower than controls (125 [68–173] vs 151 [118–199] pmol/L, p < 0.001), and every subgroup was lower than controls at p ≤ 0.001 (Table 2). The between-subtype comparisons (all p > 0.05) and the conclusion that plasma CGRP is not elevated in migraine are also unaffected. The headache-free subgroups were smaller, so the non-significant results for MA and CM may reflect lower power, as the Discussion itself acknowledges ("Some subgroup comparisons could still have lacked statistical power"). The medians still point in the same direction. Either way, the Abstract's "all p < 0.001" is not what the paper found. The claim that subgroup-level results are robust to excluding participants with headache at sampling holds only in part.
Explanations considered
- The Abstract and Results describe different analyses. This does not account for the numbers. Both passages say "restricted to headache-free participants", and the Methods describe a single such sensitivity analysis. Both use the same controls (median 151 [118–199] in each).
- The Abstract carried over the main-analysis result. This is a plausible origin, but it does not resolve the conflict. In the unrestricted analysis the Results do say "all p ≤ 0.001" (Table 2). The Abstract sentence explicitly attributes "all p < 0.001" to the headache-free analysis, and even in the main analysis one comparison (interictal vs HCs) is p = 0.001, not < 0.001.
- Corrected vs uncorrected p values. This does not account for the numbers. Footnote a says the p values are Bonferroni-corrected. Undoing a ×3 correction gives 0.042 and 0.030, and undoing a ×2 correction gives 0.063 and 0.045, all far above 0.001.
- One-sided testing. This does not account for the numbers. The Methods specify two-sided tests. Even a one-sided uncorrected p would be 0.021 and 0.015.
- Typesetting or conversion error in the Results p values. This is excluded. The Results values are plain decimals in running text, and the prose itself says the groups "did not differ significantly". The same values appear in the PMC page, in Europe PMC's publisher XML and in PubMed (see Status).
- The Results p values are the misprint, and the Abstract is right. This is unlikely. The approximate reconstruction from the reported medians and IQRs cannot produce p < 0.001 for either comparison at any subgroup size up to 210. The same model reproduces all seven Table 2 comparisons that are significant. The Results paragraph calls the sensitivity findings only "largely consistent", and the Figure 2 legend defines a "**p < 0.01" tier. Both fit some headache-free comparisons not reaching p < 0.001, although the Figure 2 legend is worded the same as Figure 1's, so it is weak evidence.
- A correction notice or supplement resolves it. No correction was found, and the supplement could not be opened (see Status). By the paper's own description, eTables 4 and 5 cover the outlier-inclusion sensitivity analysis, not the headache-free one.
Status
- Version of record. The publisher pages at neurology.org (article HTML and PDF) returned HTTP 403 to automated access, so the publisher's own rendering could not be read. Four other copies carry identical wording and values: the live PMC article page; the Europe PMC full-text XML, where the Abstract encodes the bound as "(all
p < 0.001)" and the Results as "p = 0.126" and "p = 0.090"; the PubMed record (PMID 42284536); and the institutional research-portal abstract (research.regionh.dk). Every quotation above was confirmed verbatim against the PMC-archived text withsrc/show.py. - Supplements. The article cites eTables 1–7 in an online supplement. The JATS XML has no supplementary-material links, the Europe PMC supplementary-files endpoint returned 404, and the publisher supplement URL returned 403. The Figure 2 image (headache-free comparisons with significance stars) could not be downloaded. The Data Availability statement says data are available from the corresponding author on reasonable request, so no public data allow the tests to be rerun.
- Corrections and comments. As of 2026-10-24 I found no correction, erratum, expression of concern or retraction. Crossref lists no update relations for the DOI (published 2026-07-14), and PMC and Europe PMC list no notices. A web search for corrections or comments on the article found none. The PubPeer search API returned HTTP 403, so PubPeer could not be checked directly.
- Sources. PMC article PMC13312941; Europe PMC full-text XML for PMC13312941; PubMed 42284536; research.regionh.dk publication page; Crossref metadata for 10.1212/WNL.0000000000218152.
Suggested correction
- Revise the Abstract's sensitivity-analysis sentence to match the Results. For example: "Sensitivity analyses restricted to headache-free participants showed lower median plasma CGRP in all migraine subgroups than in controls; the differences were not statistically significant for migraine with aura (p = 0.126) or chronic migraine (p = 0.090)." Give the p values for the other headache-free comparisons as computed.
- Revise the Discussion's statement that the headache-free analysis "confirmed robustness of the findings" so that it notes the two non-significant subgroup comparisons.
- Report the sizes of the headache-free subgroups (MA, MO, CM, EM) and all headache-free p values, in the text or in a supplementary table, so that Figure 2 can be read alongside them.
- Minor: the main-analysis interictal vs HCs comparison is p = 0.001 (Table 2), so any summary of the main analysis should read "all p ≤ 0.001", as the Results already do, not "p < 0.001".