← Back to the plain-language case
Abstract reports 27% of neurons frequency-tuned; the paper's own counts give 27 of 357 (8%)
PLoS Biol (2026) · doi:10.1371/journal.pbio.3003818 · PMC13289887
Summary
The abstract states that 27% of the 357 recorded human single neurons showed frequency tuning. The Results give the same finding as "8% of all neurons (n = 27/357)", and every breakdown in the paper adds up to 27 tuned neurons: by region (7 + 8 + 7 + 3 + 2), by modulation pattern (18 + 4 + 5) and by amplitude regime (16 + 6 + 5). 27/357 is 7.56%. A 27% share would need about 96 neurons, and no count or denominator in the paper gives 27%, so the abstract appears to have printed the count of tuned neurons as their percentage. The abstract gives no other prevalence figure, and this one is about 3.6 times too high. It also reverses the paper's own comparison: in the Results and Discussion, phase tuning (54/357, 15%) is about twice as common as frequency tuning. The existence of frequency tuning above chance is not affected.
What the paper reports
Abstract:
We analyzed 357 single units recorded simultaneously with local field potentials in 19 neurosurgical patients during awake resting.
We found 27% of neurons exhibited increased or decreased firing within specific frequencies, most commonly within the low-frequency range (<10 Hz).
Results, "A different subset of human single neurons displays frequency tuning", paragraph 1:
Our analysis revealed that 8% of all neurons (n = 27/357) exhibited significant frequency-tuning (binomial test, chance level = 0.01, p < 0.0001).
Same section, paragraph 3 (modulation patterns, Fig 5):
The most common pattern was a bidirectional modulation observed in 18 neurons (67% of the neurons displaying frequency tuning), characterized by increased firing within a specific frequency range and decreased firing in another. Less commonly, frequency-tuned neurons exhibited either a selective enhancement (4 neurons, 15%) or selective suppression (5 neurons, 18%) of firing within a frequency range, without a statistically significant opposing effect.
Same section (amplitude stratification):
Of the 27 neurons previously identified as frequency tuned, 16 remained significant in both amplitude regimes, six showed significant tuning in only one regime, and five were not significant after stratification
Same section (regional breakdown; Table 1 lists 147, 70, 100, 17 and 23 single units for these regions, 357 in total):
we identified neurons modulated by frequency across all recorded regions: 5% in Hipp (n = 7/147), 11% in EC (n = 8/70), 7% in ACC (n = 7/100), 17% in PCC (n = 3/17), and 8% in OFC (n = 2/23).
Results, "A subset of human single neurons displays phase tuning", paragraph 1:
Our phase tuning analyses revealed that 15% of neurons (n = 54/357) displayed significant phase tuning (binomial test, chance level = 0.01, p < 0.0001).
Results, "Phase and frequency tuning are independent phenomena":
Only 1% of neurons (3/357) were significantly modulated by both the instantaneous frequency and phase of the local LFP
Discussion, "A subset of human single neurons displays frequency-tuning to slow oscillations independent of the phase of oscillation":
Frequency tuning, like phase tuning, was observed across multiple brain regions and phase tuning was twice as prevalent.
What the paper's own numbers show
Method. All inputs are counts printed in the article (Abstract, Results and Table 1). I recomputed each printed share from its numerator and denominator, added up every breakdown of the tuned neurons, and computed the share for every other count or denominator in the paper that could plausibly have produced "27%". I also repeated the paper's binomial test against its 1% chance level. No raw data are needed. Every number below is printed by recompute.py.txt.
| Quantity | Location | Reported | Recomputed from the paper's numbers |
|---|---|---|---|
| Frequency-tuned share of all units | Abstract | 27% | 27/357 = 7.56% |
| Frequency-tuned share of all units | Results, frequency-tuning section, para 1 | 8% (n = 27/357) | 7.56%, rounds to 8% |
| Neurons needed for a 27% share | — | — | 0.27 × 357 = 96.4; any count from 95 to 98 rounds to 27% |
| Abstract value ÷ recomputed value | — | — | 27 / 7.56 = 3.57 (about 1 in 3.7 neurons vs 1 in 13.2) |
| Regional tuned counts, summed | Results, regional paragraph; Table 1 | 7/147, 8/70, 7/100, 3/17, 2/23 | 27 tuned of 357 units = 7.56% |
| Modulation patterns, summed | Results, Fig 5 paragraph | 18 + 4 + 5 | 27 |
| Amplitude strata, summed | Results, amplitude paragraph | 16 + 6 + 5 | 27 |
| Phase-tuned share | Results, phase-tuning section | 15% (54/357) | 15.13% |
| Phase ÷ frequency prevalence | Discussion | "twice as prevalent" | 54/27 = 2.00; with the Abstract's 27%, the ratio would be 15.13/27 = 0.56 |
| Tuned to both | Results, independence section | 1% (3/357) | 0.84% |
| Phase- or frequency-tuned | derived | — | (54 + 27 − 3)/357 = 78/357 = 21.85% |
| Frequency-tuned only | derived | — | 24/357 = 6.72% |
| Tuned neurons per macroelectrode | derived (84 macroelectrodes, Results para 1) | — | 27/84 = 32.14% |
| One-direction patterns among the tuned | derived | — | (4 + 5)/27 = 33.33% |
| Pattern shares of the 27 | Results, Fig 5 paragraph | 67%, 15%, 18% | 66.7%, 14.8%, 18.5% |
| Binomial test, 27/357 vs chance 0.01 | Results | p < 0.0001 | one-sided p = 1.15 × 10⁻¹⁵ |
| Binomial test, 54/357 vs chance 0.01 | Results | p < 0.0001 | one-sided p = 2.23 × 10⁻⁴⁵ |
Smaller points, separate from the main finding. (i) Three printed shares are truncated rather than rounded: PCC 3/17 = 17.65% (printed 17%), OFC 2/23 = 8.70% (printed 8%) and suppression-only 5/27 = 18.5% (printed 18%). (ii) The regional phase-tuned counts in the Results (17 + 17 + 14 + 1 + 4) sum to 53, not the 54 given as the total. (iii) The frequency chi-square across Hipp, EC and ACC reproduces from the printed counts as X² = 3.26 with 2 degrees of freedom, p = 0.196, which matches the printed p = 0.19; the printed "[3]" degrees of freedom would give p = 0.353. The same test on the printed phase counts gives X² = 6.12, df = 2, p = 0.047, not the printed X² = 5.49, p = 0.06. The phase test may have used counts that the text does not show, so I have not looked into this further. None of these points touches the abstract's 27%.
Figure
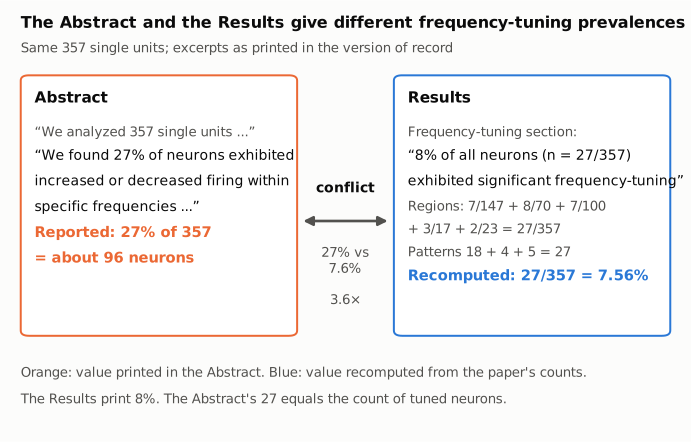
Figure 1. The left panel holds the Abstract's sentence on frequency tuning and the number of neurons it implies (orange, as printed). The right panel holds the Results sentence and the paper's breakdowns of the tuned neurons by region and by modulation pattern, all of which add up to 27 of the same 357 units. The blue value is the share recomputed from those counts, 27/357 = 7.56%. The connector marks the conflict: the Abstract's figure is 3.6 times the recomputed share and equals the count of tuned neurons.
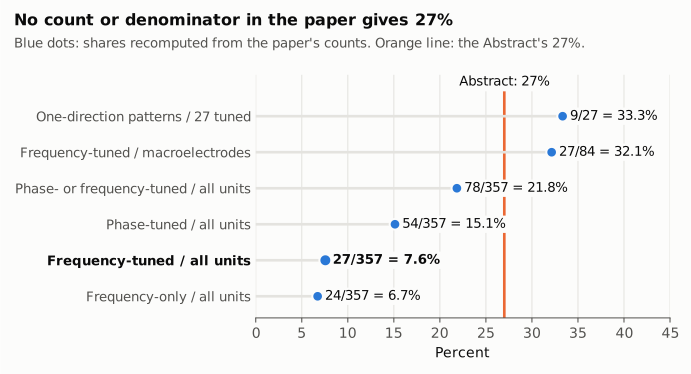
Figure 2. Each blue dot is a share recomputed from counts printed in the paper. The orange vertical line is the Abstract's 27%. The axis starts at zero. The frequency-tuned share of all units (bold) is 7.6%. The other rows test denominators and subsets that might explain the Abstract's figure. None of them comes to 27%: neurons tuned to phase or frequency come to 21.8%, and the two shares above 27% (tuned neurons per macroelectrode, and one-direction patterns among the 27 tuned) are not shares of neurons in the sense of the Abstract's sentence.
Why it matters
- This is the only prevalence the abstract gives, and it is too high by a factor of about 3.6. Single-unit prevalences are often compared across studies and cited from abstracts. A reader of the abstract alone would conclude that about 1 neuron in 4 is frequency-tuned. The paper's data show about 1 in 13, a minority that the paper's own section headings call "a subset".
- The comparison with phase tuning is reversed. The abstract does not give the phase-tuning prevalence (15%, 54/357). With the abstract's 27%, frequency tuning would look almost twice as common as phase tuning. The Results ("The proportion of phase-tuned neurons was approximately twice that of frequency-tuned neurons in all regions, except for the posterior cingulate cortex") and the Discussion ("phase tuning was twice as prevalent") say the opposite, which matches 54/27 = 2.00.
- The translational framing rests on how widespread the effect is. The abstract ends by proposing frequency tuning as "an additional mechanism for information processing in the human brain, opening new avenues for frequency-targeted neural stimulation". A 27% prevalence makes that look like a broad property of human neurons. The data show it in 8%.
- What does not change. At 27/357 the tuned fraction is still far above the 1% chance level (one-sided binomial p ≈ 10⁻¹⁵). The paper also reports frequency tuning in 13 of 19 patients and in all five regions. So the existence of frequency tuning, and its significance, stand; only its stated size in the abstract is wrong. The Results and Discussion are consistent with 8%, so the error is confined to the abstract.
Explanations considered
- A different denominator. The sentence before it in the abstract names the denominator as the 357 single units. Table 1 gives 357 units across the five regions, and the Results state "n = 27/357". There are 84 macroelectrodes, and 27/84 = 32.1%, but that is neither 27% nor a share of neurons. Does not account for it.
- A different subset of neurons. Neurons tuned to phase or frequency: 78/357 = 21.8%. Frequency-only: 24/357 = 6.7%. Phase-tuned: 15.1%. The pattern shares of the 27 tuned neurons: 66.7%, 14.8%, 18.5%, and 33.3% for the two one-direction patterns together. Neurons surviving the ISI-preserving shuffle: 19/27 = 70.4% of the tuned, or 19/357 of all units. None of these is 27%. Does not account for it.
- A different analysis or time point. The Results report a single frequency-tuning prevalence. The control analyses (ISI shuffle, split halves, amplitude stratification) each start from the same 27 neurons and keep fewer, not more. Does not account for it.
- A rounding or typesetting artifact. A share of 7.56% cannot round to 27%. The version-of-record HTML on the publisher's site, the PMC copy and the Europe PMC full-text XML all carry the same "27%" word for word, so this is not a conversion artifact. Does not account for it.
- A change between preprint and publication. The bioRxiv preprint (Europe PMC PMC12424639, full-text XML retrieved 2026-10-24) has the same mismatch. Its abstract says "We found 27% neurons exhibited increased or decreased firing within specific frequencies", and its Results say "8% of all neurons (n = 27/357)". The mismatch therefore survived revision; no corrected version exists. Does not account for it.
- Supplementary material or source data giving 27%. According to the version-of-record check, S2 Table sums to 27 frequency-tuned units across 13 subjects, 54 phase-tuned units, and 3 units tuned to both. S3 Table lists 22 neurons with increased firing and 5 with suppression only (22 + 5 = 27). In the Zenodo source data (doi:10.5281/zenodo.19860065), I checked two files myself.
frequency_tuned_frequencies.matholds 27 entries.count_result_per_region.mat, decoded from its stored doubles, gives TotalNeurons 100/70/147/23/17 (= 357) and N_Frequency 7/8/7/2/3 (= 27) for ACC/EC/Hipp/OFC/PCC, with Pct_Frequency 7.0/11.43/4.76/8.70/17.65. Its N_Phase is 14/17/17/4/1 (= 53, matching the text's regional counts), and N_Either is 21/23/24/6/4 (= 78). Pooled, none of these is 27%. Does not account for it; the source data support about 8%.
What remains is that the abstract's "27%" matches the number of frequency-tuned neurons, 27. That fits a count printed in place of a percentage, but the paper does not say how the figure arose.
Status
As of 2026-10-24:
- Version of record checked. The publisher's page (journals.plos.org, reached from doi.org), the PMC page and the Europe PMC full-text XML all carry the abstract's "27% of neurons" and the Results' "8% of all neurons (n = 27/357)". Every quote above was checked word for word against the PMC archive copy.
- Supplements and data. S2 and S3 Tables (as summarized in the version-of-record check) and the Zenodo source data (doi:10.5281/zenodo.19860065; regional count table and frequency-tuned list re-read for this write-up) all give 27 frequency-tuned units of 357. None of them resolves the abstract figure.
- Corrections. None found. Crossref shows no
update-to/updated-byrelation, and a Crossrefupdates:filter search returned 0 results. PMC and Europe PMC list no notices. The Crossref/Retraction Watch record shows no updates. The PLOS article page shows no notice, and its reader comments number 0. The linked PLOS Biology commentary (doi:10.1371/journal.pbio.3003846, PMC13293611) gives no percentage. The published peer-review history quotes the 54/357 vs 27/357 comparison but does not mention the abstract's 27%. - PubPeer. A web search found no PubPeer thread or other public discussion. PubPeer itself could not be queried directly (blocked by a 403 / Cloudflare challenge), and the Europe PMC search endpoint returned 503 errors, so these two checks are incomplete.
- Preprint. bioRxiv preprint (PMC12424639): same discrepancy.
Suggested correction
In the Abstract, replace
We found 27% of neurons exhibited increased or decreased firing within specific frequencies, most commonly within the low-frequency range (<10 Hz).
with
We found 8% of neurons (27/357) exhibited increased or decreased firing within specific frequencies, most commonly within the low-frequency range (<10 Hz).
If the authors want the abstract to reflect the paper's comparison with phase tuning, they could add that 15% of neurons (54/357) showed phase tuning. Separately, they may wish to check the truncated regional percentages (PCC 17.6%, OFC 8.7%), the regional phase-tuned counts (which sum to 53 against a total of 54), and the degrees of freedom and phase statistic in the regional chi-square tests.