← Back to the plain-language case
Reported p<0.001 for mouse leak frequencies cannot be reproduced; the paper's counts give p=0.11–0.36
Lancet Neurology (2026) · doi:10.1016/S1474-4422(26)00140-7 · PMC13275636
Summary
The Results report that CSF leaks were significantly more frequent in all three Fbn2 mutant mouse strains than in wild-type mice: relative risks (RR) of 1.38, 1.33 and 1.27, 95% confidence intervals that exclude 1, and "all comparisons p<0·001". The legend of Figure 4A goes further, marking p<0.0001 for two of the strains. The paper names the χ² test for this comparison. Applied to the paper's own counts (15/19, 22/29 and 8/11 against 20/35 in wild-type), that test gives p = 0.109, 0.117 and 0.356. Fisher's exact test gives 0.14, 0.19 and 0.49, and the 95% CIs for the RRs are 0.96–2.00, 0.93–1.89 and 0.80–2.02, so all three include 1. The reported CIs are reproduced to two decimals only if each percentage is treated as a count out of 100 mice per group. The comparison is the main in-vivo support for the abstract's statement that the mutant mice "showed a predisposition for dural rupture". The paper's genetic burden results do not depend on it.
What the paper reports
Results, in-vivo paragraph (Marfan comparison, then Fbn2 strains):
There was no significant increase in CSF leak frequency in Marfan syndrome mice compared with wild-type mice (seven [54%] of 13 vs 20 [57%] of 35, respectively, p>0·05, relative risk [RR]=0·94, 95% CI 0·74–1·22, figure 4A). Contrastingly, these frequencies were significantly higher for Fbn2A1052T/+ mice (15 [79%] of 19), RR 1·38, 95% CI 1·14–1·69), for Fbn2D1581V/+ mice (22 [76%] of 29], RR 1·33, 95% CI 1·09–1·63), and for Fbn2M2387T/+ mice (eight [73%] of 11], RR 1·27, 95% CI 1·04–1·58), with all comparisons p<0·001 (figure 4A).
(The unmatched brackets are in the published text.)
Methods, Statistical analysis:
Proportions of mice with leaks were compared between mutant and wild-type mice by use of χ2 tests. p<0·05 was used as significance threshold.
Figure 4 legend:
(A) Proportion of CSF leak occurrence in mouse strains following intrathecal infusion.
*p<0·001. †p<0·0001.
The earlier check of the figure image (gr4.jpg from the publisher's supplementary package) found † on the A1052T and D1581V bars and * on the M2387T bar. The bar heights (about 57%, 54%, 79%, 76% and 73%) match the counts in the text.
Abstract, Findings:
Mice carrying variants equivalent to the three FBN2 variants in TB domains found in individuals with type 1b spontaneous spinal CSF leak (Fbn2A1052T/+, Fbn2D1581V/+, and Fbn2M2387T/+) showed a predisposition for dural rupture on controlled leak induction.
Research in context, Added value of this study:
Functional in-vitro studies and animal model data are supportive of a causal effect of the identified variants in FBN2.
Discussion, first paragraph:
We also showed increased CSF leak susceptibility and severity in fibrillin-2 mutant mice, and increased dural compliance in Marfan syndrome mice.
Discussion, mouse paragraph:
Our findings revealed that type 1b spontaneous spinal CSF leak-associated variants in the TB3, TB4, and TB7 domains of fibrillin-2 led to increased CSF leak frequency and severity in mice, a characteristic not attributable to increased pressure or volume at the time of leak.
Marfan syndrome mice also showed increased meningeal compliance without increased leak frequency or severity.
All quotes were checked verbatim against the PMC-archived text. Superscripts on the allele names (A1052T/+ etc.) are lost in plain text.
What the paper's own numbers show
Method. Each strain was compared with the wild-type group (20 of 35 mice with leaks) in a 2 × 2 table built from the counts printed in the Results. For each comparison I calculated the RR with its usual log-scale (Katz) 95% CI and the Pearson χ² test without continuity correction, which is the test named in the Methods. As checks I also ran the Yates-corrected χ², Fisher's exact test (two-sided and one-sided), Barnard's exact test, a pooled comparison of all Fbn2 mice, and a comparison against pooled controls (wild-type plus Marfan). To find where the reported intervals come from, I repeated the calculation with each printed percentage used as a count out of 100. All of this is in recompute.py.txt.
| Quantity | Location | Reported | Recomputed from the paper's counts |
|---|---|---|---|
| Leak frequencies | Results; Fig 4A | 79%, 76%, 73%, 54% vs 57% | 15/19 = 78.9%, 22/29 = 75.9%, 8/11 = 72.7%, 7/13 = 53.8%, 20/35 = 57.1% (consistent) |
| Fbn2 A1052T/+ vs WT, p | Results; Fig 4A (†) | p<0.001 (text); p<0.0001 (figure) | χ² p = 0.109 (Yates 0.192; Fisher 0.142; Barnard 0.123) |
| Fbn2 A1052T/+ RR (95% CI) | Results | 1.38 (1.14–1.69) | 1.38 (0.96–2.00) |
| Fbn2 D1581V/+ vs WT, p | Results; Fig 4A (†) | p<0.001 (text); p<0.0001 (figure) | χ² p = 0.117 (Yates 0.192; Fisher 0.186; Barnard 0.133) |
| Fbn2 D1581V/+ RR (95% CI) | Results | 1.33 (1.09–1.63) | 1.33 (0.93–1.89) |
| Fbn2 M2387T/+ vs WT, p | Results; Fig 4A (*) | p<0.001 | χ² p = 0.356 (Yates 0.569; Fisher 0.486; Barnard 0.449) |
| Fbn2 M2387T/+ RR (95% CI) | Results | 1.27 (1.04–1.58) | 1.27 (0.80–2.02) |
| Fbn1 C1039G/+ (Marfan) RR (95% CI), p | Results | 0.94 (0.74–1.22), p>0.05 | 0.94 (0.53–1.68), χ² p = 0.838. The conclusion (not significant) holds; the CI is too narrow |
| One-sided Fisher (mutant > WT) | check | n/a | 0.095, 0.095, 0.289 |
| SE(log RR): from the reported CI vs from the counts | check | 0.100, 0.103, 0.107, 0.128 | 0.188, 0.180, 0.236, 0.296 (1.75–2.32 times wider) |
| RR CI with percentages used as counts out of 100 | diagnostic | 1.14–1.69 / 1.09–1.63 / 1.04–1.58 / 0.74–1.22 | 79/100, 76/100, 73/100, 54/100 vs 57/100: 1.14–1.69 / 1.09–1.63 / 1.04–1.58 / 0.74–1.21 |
| χ² p with percentages used as counts out of 100 | diagnostic | p<0.001 (all three) | 0.0009 / 0.0044 / 0.018. Even this does not give p<0.001 for all three |
| All Fbn2 mice pooled (45/59) vs WT 20/35 | sensitivity | n/a | RR 1.33 (0.97–1.84); χ² p = 0.052; Fisher p = 0.066 |
| Each Fbn2 strain vs pooled controls (WT + Marfan, 27/48) | sensitivity | n/a | χ² p = 0.083, 0.083, 0.316 |
| Global 2 × 5 χ² across all five strains | sensitivity | n/a | χ² = 4.99, df = 4, p = 0.288 |
| Leaks needed for χ² p<0.001 vs WT 20/35 | sensitivity | observed 15/19, 22/29, 8/11 | ≥19/19, ≥28/29; not reachable with 11 mice (11/11 gives p = 0.008) |
Every printed percentage matches its count, so the counts are internally consistent. No standard test of these counts gives p<0.05 for any single strain, let alone p<0.001. For the M2387T group, p<0.001 cannot be reached against 20/35 even if all 11 mice had leaked.
Figure
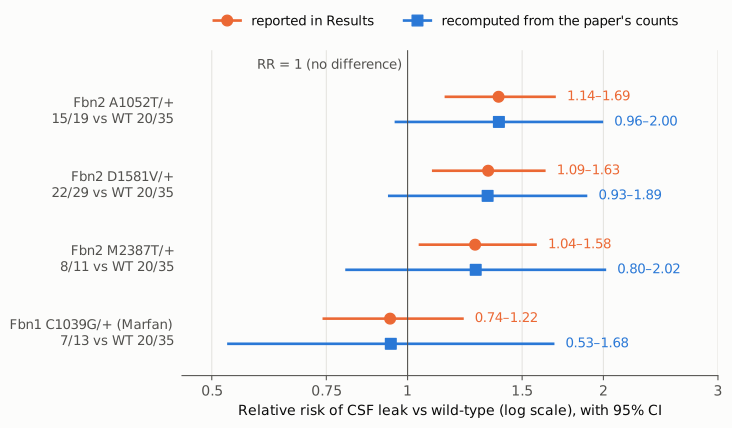
Figure 1. Relative risk of CSF leak in each mutant strain compared with wild-type mice (20/35), on a log scale. Orange circles and bars are the RRs and 95% CIs printed in the Results. Blue squares and bars are the RRs and log-scale 95% CIs recomputed from the counts printed alongside them (shown under each strain name). The thin vertical line marks RR = 1. The point estimates agree. The recomputed intervals are 1.75 to 2.3 times wider on the log scale, and for all three Fbn2 strains they cross 1, whereas the reported intervals do not. The Marfan interval is also too narrow as printed, although both versions include 1.
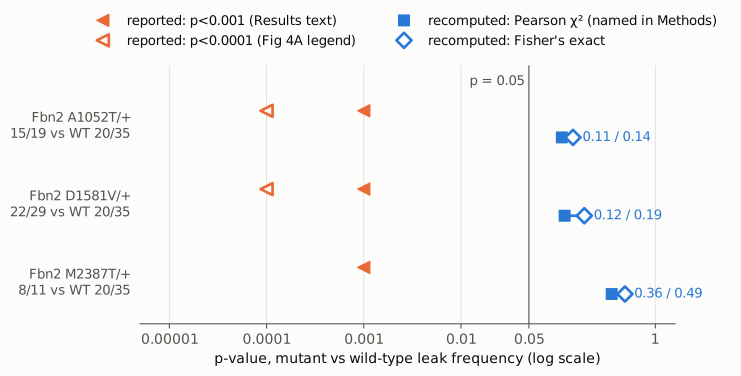
Figure 2. p-values for each Fbn2 strain against wild-type, on a log scale. Orange triangles show the reported thresholds: filled for "p<0·001" in the Results text, open for the "p<0·0001" marker (†) in the Figure 4 legend. Each triangle marks an upper bound. Blue markers show the values recomputed from the paper's counts: filled squares for the Pearson χ² test named in the Methods, open diamonds for Fisher's exact test. The thin vertical line marks the paper's significance threshold, p = 0.05. The recomputed values lie two to three orders of magnitude above the reported bounds, and all lie above 0.05.
Why it matters
The in-vivo leak experiment is the paper's test of whether the FBN2 variants found in patients impair dural integrity in a living animal. The leak-frequency comparison is the only in-vivo measure the paper reports as showing a difference in leak occurrence between Fbn2 mice and wild-type mice. The abstract ("showed a predisposition for dural rupture on controlled leak induction"), the Research in context panel ("animal model data are supportive of a causal effect") and the Discussion ("led to increased CSF leak frequency") all rely on it. The contrast the Discussion draws with Marfan mice, which showed increased compliance "without increased leak frequency", also relies on it. Recomputed from the paper's own counts, none of the three strain-level differences is statistically significant at the paper's own threshold of 0.05. The pooled Fbn2 group is borderline (p = 0.052). The direction of effect is unchanged: every Fbn2 strain leaked more often than wild-type (73–79% vs 57%). With 11 to 29 mice per group, the data are compatible both with no difference and with a doubling of risk.
Several results are unaffected. The exome burden enrichment (p = 0.041, 0.004 and 0.0003 in the three control cohorts) rests on human data, and so do the domain-distribution and fibroblast-binding results. The separately reported larger pressure drop at leak onset in Fbn2 mice (Figure 4E–F) and the Marfan compliance result (Figure 4D) are different measurements; they could not be checked here because no per-mouse data are published. The genetic conclusion therefore still stands. What changes is that the leak-frequency data do not, by themselves, provide statistically significant in-vivo evidence for it.
Explanations considered
- A different test from the one named. The Methods name χ² tests. Pearson χ² (0.109, 0.117, 0.356), Yates-corrected χ², Fisher's exact (two-sided or one-sided), and Barnard's exact test all give p>0.09 for every strain. This does not account for the reported values.
- A different comparator or a global test. Comparing against pooled controls (wild-type plus Marfan) gives p = 0.083–0.316. A global 2 × 5 χ² gives p = 0.288. Pooling all Fbn2 mice gives p = 0.052. This does not account for the reported values.
- Different units (infusion trials rather than mice). The Figure 4A axis refers to trial outcome, but the Results report the counts as mice ("15 [79%] of 19"), the Methods describe the analysis as "Proportions of mice with leaks", and the bar heights match the mouse counts. The paper describes no repeated trials per mouse. If there were repeated trials per mouse, the mouse would remain the experimental unit, and treating trials as independent would understate the uncertainty rather than justify it. This does not account for the reported values on the evidence available.
- Percentages used as counts out of 100. Treating 79%, 76%, 73% and 54% as counts out of 100 per group (against 57/100) reproduces all four printed CIs to within 0.01. This is the only calculation found that does so. Even this calculation gives χ² p = 0.0009, 0.0044 and 0.018, so it does not reproduce "all comparisons p<0·001" or the p<0.0001 markers. The source of the p-values remains unidentified. The point estimates are unaffected, since an RR does not depend on the denominator.
- Correction for multiple comparisons. Any correction would make the p-values larger, not smaller.
- Rounding or typesetting. The discrepancies are a factor of 100 or more in p and roughly a factor of two in CI width. They appear in the text and in the figure markers, and they affect all three strains. A typesetting or rounding cause is not plausible.
- Text-conversion artifact in PMC. The same text appears in the publisher-supplied JATS in Europe PMC and on the live PMC page, and the figure markers come from the publisher's image. This does not account for the discrepancy.
- Data not in the paper. No per-mouse data or source data file is deposited, and the supplementary appendix has no contingency tables. If the printed counts were wrong, the recomputed values would change. However, the counts agree with the printed percentages and with the bar heights in Figure 4A, so they are what the paper presents as its data.
Status
As of 2026-10-23:
- Version of record. The publisher pages could not be opened from this machine: doi.org redirects to linkinghub.elsevier.com, which returned only a redirect stub, and thelancet.com and sciencedirect.com both returned HTTP 403. The text was checked in two archived copies, the publisher-supplied JATS full text served by Europe PMC and the PMC page (pmc.ncbi.nlm.nih.gov/articles/PMC13275636/). Both carry the Results passage, the Methods sentence and the Figure 4 legend quoted above.
- Supplements. The Europe PMC supplementary package was read in the earlier check. It holds mmc1.pdf (appendix: structural modelling, binding methods, co-IP blots, CRISPR sequences, uncropped blots) and the figure images gr1–gr4. It has no per-mouse leak data, no contingency tables and no further description of the leak-proportion test. It does not resolve the discrepancy. A re-download attempted for this write-up timed out.
- Corrections. None was found. Crossref update metadata (
src/known.py): none. PMC notices: none. Europe PMC (PMID 42309087) lists no comment or correction. The Crossref record has no update-to or relation entries. - PubPeer. The PubPeer search API returned a human-verification challenge, and the PubPeer search page returned HTTP 403, so PubPeer could not be queried. A web search could not be run for this write-up because the session's search budget was exhausted. No PubPeer discussion is known, but its absence is not confirmed.
Suggested correction
In the Results, in-vivo paragraph, the RR confidence intervals and p-values should be recomputed from the mouse-level counts. If the counts printed are correct, the passage would read approximately:
There was no significant increase in CSF leak frequency in Marfan syndrome mice compared with wild-type mice (seven [54%] of 13 vs 20 [57%] of 35, respectively, p=0·84, relative risk [RR]=0·94, 95% CI 0·53–1·68, figure 4A). Leak frequencies were numerically higher for Fbn2A1052T/+ mice (15 [79%] of 19; RR 1·38, 95% CI 0·96–2·00; p=0·11), for Fbn2D1581V/+ mice (22 [76%] of 29; RR 1·33, 95% CI 0·93–1·89; p=0·12), and for Fbn2M2387T/+ mice (eight [73%] of 11; RR 1·27, 95% CI 0·80–2·02; p=0·36), but none of these differences was statistically significant (χ² tests).
The significance markers on Figure 4A for the three Fbn2 strains would need to be removed or replaced with "NS". The Abstract ("showed a predisposition for dural rupture"), the Research in context panel and the two Discussion passages describing increased leak frequency should be revised to match. For example, they could state that leak frequency was higher in all three Fbn2 strains but not significantly so, and rest any in-vivo claim on the pressure-drop results, if those are confirmed. Depositing per-mouse leak data would let readers verify the corrected analysis.