← Back to the plain-language case
Title says the 2025–2030 guidelines raise water use; the paper's own results show lower water use
Proc Natl Acad Sci U S A (2026) · doi:10.1073/pnas.2604814123 · PMC13273247
Summary
This PNAS brief report compares diets that follow the 2025–2030 Dietary Guidelines for Americans (no ultraprocessed foods, protein raised to 1.2–1.6 g/kg) with the current Mean American Diet (MAD) on greenhouse gas (GHG) emissions, freshwater use, land use and nitrogen fertilizer use. Its title says the guidelines are "associated with higher land, water and nitrogen use, and greenhouse gas emissions", but its abstract, Results and Discussion all report that water use is "lower by 7 to 19% than the MAD". The paper's own Dataset S1 gives −6.6% to −19.5% for those scenarios (the text's range, to the nearest percent) and lower water use than the MAD in every scenario modelled, while the other three outcomes rise by up to 31.8%. The title thus states the wrong direction for one of the four outcomes it names, and a reader who sees only the title, as indexes, citations and news coverage present it, gets the water result backwards.
What the paper reports
Title:
The 2025–2030 Dietary Guidelines for Americans are associated with higher land, water and nitrogen use, and greenhouse gas emissions
Abstract, which states the comparator and the water result:
Here, we quantified the greenhouse gas (GHG) emissions, freshwater use, land use, and nitrogen fertilizer use of adherence to these new guidelines in comparison to the current Mean American Diet (MAD).
We find that although eliminating ultraprocessed foods from the MAD could yield substantial environmental benefits—given their large share of total intake and animal-based makeup—the recommended increase in animal-based proteins, will more than offset this environmental dividend in GHG, land use, and nitrogen fertilizer use by as much as 32%, but not in water use (i.e., water use is lower by 7 to 19% than the MAD).
Overall, adherence to the 2025–2030 Dietary Guidelines for Americans would confer net environmental harm across most key metrics relative to the prevailing U.S. diet.
Introduction, last paragraph:
We then quantified greenhouse gas (GHG) emissions, freshwater use, land use, and nitrogen fertilizer use for each diet and compared them against the MAD.
Results, second paragraph:
Our results indicate that GHG, land use, and nitrogen fertilizer dividends of eliminating UPFs from the MAD are outweighed by the impacts associated with increased protein intake (1.2 to 1.6 g/kg) by as much as 32%. In contrast, eliminating UPF and increasing protein levels to 2025–2030 DGAs reduced the water footprint compared to MAD by 7 to 19%.
Discussion, first paragraph:
For land use, GHG emissions, and nitrogen fertilizer use the net effects are adverse. For water use, the net effect is beneficial, but would be even more so were the avoidance of UPFs combined with a lower protein threshold, and the sourcing of protein preferentially from plants.
The paper has no tables. Fig. 1 panel B ("freshwater use (panel B)") plots the water results. All quotes above were checked verbatim against the PMC-archived article text.
What the paper's own numbers show
Method. Dataset S1 (pnas.2604814123.sd01.xlsx) has a "summary" sheet. Its rows 5–11 give annual per-capita GHG (kg CO2e), water (litres), land (m²·yr) and nitrogen fertilizer (g Nr), plus daily kcal and protein, for the MAD, the ultraprocessed-food (UPF) component of the MAD, and five UPF-free scenarios: 0.8, 1.2 and 1.6 g/kg, and 1.6 g/kg weighted toward plant or animal sources. I took the cached cell values and computed each scenario's percentage change against the MAD. I then compared the results with the ranges stated in the text. The sheet is identical to the one in the data file that the paper links under Data Availability. The sheet's own "Range" cells (K15:L15) pool GHG, land and nitrogen for the 1.2, 1.6 and 1.6 g/kg animal scenarios, and leave water out. All calculations are in recompute.py.txt.
| Quantity | Location | Reported | Recomputed |
|---|---|---|---|
| Direction of water use, guideline diets vs MAD | Title | "higher … water … use" | Lower in all 5 scenarios (−6.6% to −27.7%) |
| Water, 1.2 g/kg vs MAD | Abstract; Results ¶2; Fig. 1B | "lower by 7 to 19%" (upper end) | −19.45% |
| Water, 1.6 g/kg vs MAD | Abstract; Results ¶2; Fig. 1B | "lower by 7 to 19%" (lower end) | −6.58% |
| Water, 1.6 g/kg animal vs MAD | Fig. 1B | within 7–19% lower | −13.14% |
| Water, 1.6 g/kg plant vs MAD | Fig. 1B | lower (not quantified) | −24.92% |
| Water, 0.8 g/kg vs MAD | Fig. 1B | lower (not quantified) | −27.73% |
| Net water effect | Discussion ¶1 | "beneficial" | Consistent: every scenario is below the MAD |
| GHG, land, N fertilizer vs MAD, 1.2–1.6 g/kg scenarios | Abstract; Results ¶2 | "by as much as 32%" | −2.5% (GHG, 1.2 g/kg) to +31.8% (land, 1.6 g/kg) |
| 1.6 g/kg vs MAD: GHG / land / N | Fig. 1A, C, D | higher | +21.5% / +31.8% / +7.7% |
| UPF share of MAD impacts (GHG, water, land, N) | Results ¶2 | "40 to 58%" | 46.1%, 52.4%, 40.3%, 57.6% |
| Protein, 0.8 / 1.2 / 1.6 g/kg × 84 kg | Results ¶1; Methods | 67 / – / 134 g per day | 67.2 / 100.8 / 134.4 g (modelled 67.3 / 100.8 / 134.3) |
Every number in the abstract, Results and Discussion reproduces from Dataset S1. The title is the only statement that disagrees with the data, and it disagrees only on the direction of water use.
Figure
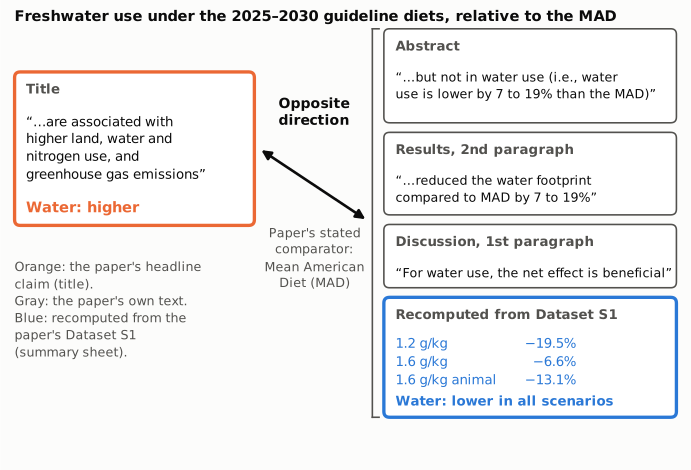
Figure 1. The title clause (left, orange) lists water among the outcomes that are "higher" under the 2025–2030 guidelines. On the right are the three places where the text reports the water result, each against the Mean American Diet (MAD) (gray): the abstract ("lower by 7 to 19% than the MAD"), the second paragraph of Results ("reduced the water footprint compared to MAD by 7 to 19%") and the first paragraph of Discussion ("the net effect is beneficial"). Below them (blue) are the water changes recomputed from the summary sheet of Dataset S1 for the three scenarios in the guidelines' protein range that the text's 7–19% covers. The 1.6 g/kg plant scenario (−24.9%) and the 0.8 g/kg scenario (−27.7%) are also below the MAD and are not shown in this panel.
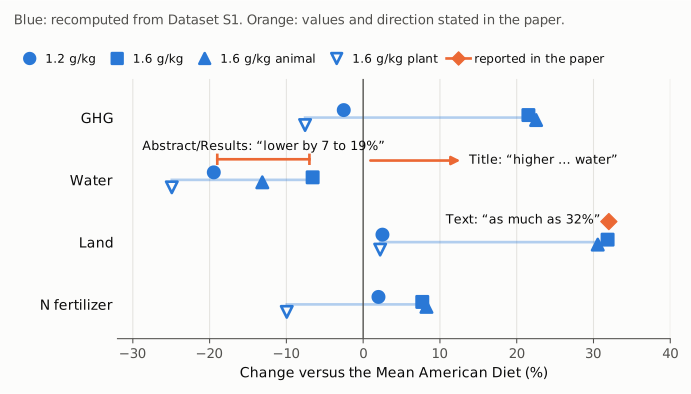
Figure 2. Change against the MAD for each of the four outcomes named in the title, in the four UPF-free scenarios at 1.2–1.6 g/kg protein (blue markers, recomputed from Dataset S1; the hollow marker is the plant-weighted 1.6 g/kg diet). The thin vertical line marks no change. Orange marks show what the paper states: the "lower by 7 to 19%" interval for water, the "as much as 32%" maximum for GHG, land and nitrogen (reached for land), and the direction that the title gives for water (arrow pointing to higher values). Land, GHG and nitrogen fertilizer rise in the 1.6 g/kg scenarios. Every water value is below zero, so none matches the direction the title gives.
Why it matters
The title is the paper's headline claim. It names four outcomes and says all four are higher under the guidelines. Against the comparator the paper states throughout (the Mean American Diet), one of those four, freshwater use, goes the other way in every scenario the paper models: it falls by 6.6–19.5% at the guidelines' protein levels and by up to 27.7% overall. The body of the paper reports this correctly and calls the net water effect "beneficial". The abstract's closing sentence is qualified accordingly ("net environmental harm across most key metrics").
The title is what bibliographic databases index, what citing papers and reference lists reproduce, and what headlines and social media posts pick up. A reader who relies on the title, which is the usual case for a widely covered policy paper, comes away with the water result reversed. One news item that links to this PMC record says the guidelines are linked to "16 percent more water consumption", alongside 33% higher emissions and 28% greater land use, and gives no comparator (Species Unite). In Dataset S1 those three figures coincide with the 1.6 g/kg animal versus 1.6 g/kg plant contrast (+32.6% GHG, +27.7% land, +15.7% water). That is a comparison between two guideline-range diets, not between the guidelines and the current diet.
The following results are not affected: the GHG, land-use and nitrogen-fertilizer increases (up to +31.8% against the MAD), the finding that plant-sourced protein does better than animal-sourced protein on every metric, the UPF shares, and the paper's main conclusion of net environmental harm on most metrics. The paper reports scenario point estimates without inferential statistics, so no test or interval changes.
Explanations considered
- A different comparator. The title names no comparator. Within the UPF-free scenarios, water use does rise with protein: the 1.2 g/kg and 1.6 g/kg diets use 11.4% and 29.3% more water than the 0.8 g/kg diet. Read against a UPF-free 0.8 g/kg diet, "higher water" would be true. The paper, however, states its comparator explicitly in the abstract ("in comparison to the current Mean American Diet (MAD)"), the Introduction ("compared them against the MAD") and the abstract's conclusion ("relative to the prevailing U.S. diet"). In the title, "higher" applies to land, nitrogen and GHG on the MAD comparison. The abstract singles water out as the exception to that comparison ("but not in water use"). This does not account for the title.
- The marginal effect of the added protein. The Discussion notes that water use would be lower still "were the avoidance of UPFs combined with a lower protein threshold". This describes the protein increase as eating into a water saving, not as producing higher water use than the current diet. The same paragraph calls the net effect "beneficial". This does not account for the title.
- Animal-weighted versus plant-weighted sourcing. The 1.6 g/kg animal diet uses 15.7% more water than the 1.6 g/kg plant diet. That is a comparison between two guideline-range diets. The title describes the guidelines as a whole, and even the animal-weighted diet uses 13.1% less water than the MAD. This does not account for the title.
- A scenario with higher water use. None exists. All five modelled scenarios are below the MAD on water (−6.6% to −27.7%). This does not account for the title.
- Normalisation. All diets are isocaloric (about 2,500 kcal/day), so water per 1,000 kcal has the same sign as the totals. Per gram of protein, every guideline-range diet is also lower than the MAD (−15.4% to −40.8%). This does not account for the title.
- Uncertainty. The paper gives no intervals, so it cannot be judged whether the smallest reduction (−6.6%) is distinguishable from zero. The paper itself, though, states the direction as lower in three places and never as higher or as uncertain. This does not account for the title.
- Text-conversion artifact. The conflict is between words ("higher" against "lower", "reduced", "beneficial"). It does not depend on a sign, symbol or table cell. The same title is in the Crossref metadata deposited by the publisher, the Europe PMC record and the live PMC page. An archiving artifact is ruled out.
Status
As of 2026-10-23:
- Version of record. The publisher's site (pnas.org, the DOI target) returned HTTP 403 from this machine, so its HTML and PDF could not be read. The copies checked were the PMC-archived text (via
src/show.py), the live PMC page, the Europe PMC full-text XML and record (PMID 42224503), and the Crossref metadata title. All carry the same title and the same abstract, Results and Discussion sentences. - Supplements. Dataset S1 (pnas.2604814123.sd01.xlsx, downloaded via Europe PMC) was read. Its "summary" sheet gives the scenario totals used above, and the same sheet appears unchanged in the authors' linked data file. It confirms the text's 7–19% water reduction and shows no scenario with higher water use. The supplement supports the body text and does not resolve the conflict with the title.
- Corrections. No correction, erratum, expression of concern or retraction was found.
src/known.py: no Crossref updates, no PMC notices, no Europe PMC notices. In the Crossref REST record, update-to and updated-by are absent. The Crossreffilter=updates:query returned 0 items in an earlier check today, and a repeat query was rate-limited (HTTP 429). Europe PMC lists one linked item, a "Comment in" PNAS commentary (PMID 42475589, doi:10.1073/pnas.2617208123). It is not a correction, and only its metadata was available. - PubPeer. The PubPeer search API returned HTTP 403. A web search for the title together with "PubPeer", "correction" or "erratum" found no PubPeer thread and no correction, only news coverage.
Suggested correction
Change the title to give the direction that the paper's results report for water, for example:
The 2025–2030 Dietary Guidelines for Americans are associated with higher land and nitrogen use and greenhouse gas emissions, but lower water use
or, if the title should keep to the adverse outcomes only:
The 2025–2030 Dietary Guidelines for Americans are associated with higher land and nitrogen use, and greenhouse gas emissions
Either wording matches the abstract ("but not in water use (i.e., water use is lower by 7 to 19% than the MAD)"), the Results and the Discussion. No numbers, figures or conclusions in the body need to change.