← Back to the plain-language case
Abstract's subgroup gains in contraceptive use disagree with the paper's own Table 2
BMJ Glob Health (2026) · doi:10.1136/bmjgh-2024-018775 · PMC13250227
Summary
The abstract reports 2008–2019 gains in modern contraceptive prevalence (mCPR) for four subgroups: +12.6 and +10.0 percentage points for married women aged 15–24 and 25–49, and +19.5 and +16.9 for unmarried, sexually active women of the same ages. It states that among married women the gains "were larger in those aged 15–24 years". The paper's Table 2, the main text's only table of mCPR by age and marital status, gives +13.5 and +14.2 for the married groups and +31.5 and +21.0 for the unmarried groups. On those figures, older married women gained slightly more, the reverse of the abstract's ranking. The headline gain for all women (+15.7) and the married total both match Table 2. The paper's conclusions about drivers of the increase do not depend on these subgroup figures, but they are the only subgroup results in the abstract.
What the paper reports
All quotations are verbatim from the article as archived in PMC.
Abstract, Results:
Between 2008 and 2019, modern contraceptive prevalence among women aged 15–49 rose from 8.2% to 23.9% (+15.7 percentage points). Among married women, gains were larger in those aged 15–24 years (+12.6) than in women aged 25–49 years (+10.0). Unmarried women maintained substantially higher use, with gains of +19.5 and +16.9 points, respectively.
Table 2, "Modern contraceptive prevalence rate (mCPR, %) by age group and marital status, Sierra Leone, Demographic Health Survey (DHS) 2008–2019", excerpt (columns: population group | 2008 mCPR | N2008 | 2013 mCPR | N2013 | 2019 mCPR | N2019):
All women (15–49 years) | 8.2 | 7374 | 20.9 | 16 658 | 23.9 | 15 574
Married/in-union (15–49 years) | 6.7 | 5525 | 15.6 | 10 903 | 20.9 | 9715
Married/in-union, age 15–24 | 3.7 | 1171 | 11.8 | 2299 | 17.2 | 1842
Married/in-union, age 25–49 | 7.6 | 4353 | 16.6 | 8603 | 21.8 | 7873
Unmarried/sexually active, age 15–24† | 26.6 | 343 | 57.5 | 1472 | 58.1 | 1309
Unmarried/sexually active, age 25–49† | 21.1 | 208 | 53.3 | 586 | 42.1 | 678
Table 2 footer, excerpt:
All prevalence rates and denominators are from DHS 2008 (Table 5.4), DHS 2013 (Table 7.2) and DHS 2019 (Table 7.3), or computed as described in Methods.
Calculated values for age subgroups represent weighted averages of individual 5-year cohorts; see Methods for details.
Results, "Modern contraceptive prevalence and demand satisfied", first paragraph:
Between 2008 and 2019, Sierra Leone’s mCPR increased, from 8.2% to 23.9% among all women and from 6.7% to 20.9% among married or in-union women (DHS table 2).
Gains were observed across both married and unmarried women, with mCPR among sexually active unmarried women aged 15–24 reaching 57.5% by 2013 and remaining high in 2019 (58.1%).
Table 2 presents mCPR by marital status and age, with subgroup N calculated from original DHS reports or as weighted averages of DHS age and marital groups.
Methods, "Trend analysis":
These data sources were used to describe national and subnational trends in mCPR, with results presented as simple proportions over time.
Methods, "Decomposition analysis" (the sample of the separate decomposition model):
Analysis included women aged 15–49 who had sexual intercourse in the previous 12 months, were not pregnant or menopausal and did not self-report as infecund, regardless of parity.
The figures +12.6, +10.0, +19.5 and +16.9 do not appear as mCPR values or gains anywhere in the main text outside the abstract.
What the paper's own numbers show
Method. For each subgroup named in the abstract I subtracted the Table 2 mCPR for 2008 from the value for 2019, giving the absolute change in percentage points (pp). That is the measure the abstract uses for the all-women figure, where its "+15.7 percentage points" equals 23.9 − 8.2. I then checked whether other readings of Table 2 could produce the abstract values: the 2008–2013 and 2013–2019 windows, relative change, rounding of each table cell (±0.05), and every ordered pair of cells in the table. I also checked that Table 2 is internally consistent: each 15–49 row should equal the N-weighted average of its two age rows. Finally, I compared the abstract values with the only other subgroup mCPR figures in the paper, the descriptive tables of online supplemental file 4. Every number below is printed by recompute.py.txt.
| Quantity | Location | Reported | Recomputed from the paper's own numbers |
|---|---|---|---|
| Gain, all women 15–49, 2008→2019 | Abstract vs Table 2 row 1 | +15.7 (8.2% → 23.9%) | 23.9 − 8.2 = +15.7 (matches) |
| Gain, married 15–49, 2008→2019 | Results text vs Table 2 | 6.7% → 20.9% (no gain stated) | 20.9 − 6.7 = +14.2 (levels match) |
| Gain, married 15–24, 2008→2019 | Abstract vs Table 2 | +12.6 | 17.2 − 3.7 = +13.5 |
| Gain, married 25–49, 2008→2019 | Abstract vs Table 2 | +10.0 | 21.8 − 7.6 = +14.2 |
| Younger minus older married gain | Abstract ("gains were larger in those aged 15–24 years") | +2.6 pp (15–24 larger) | −0.7 pp (25–49 larger) |
| Gain, unmarried sexually active 15–24 | Abstract vs Table 2 | +19.5 | 58.1 − 26.6 = +31.5 |
| Gain, unmarried sexually active 25–49 | Abstract vs Table 2 | +16.9 | 42.1 − 21.1 = +21.0 |
| Range of each gain if every cell is rounded to ±0.05 | Table 2 | — | married 13.4–13.6 and 14.1–14.3; unmarried 31.4–31.6 and 20.9–21.1 |
| Married gains, other windows (15–24; 25–49) | Table 2 | — | 2008→2013: +8.1, +9.0; 2013→2019: +5.4, +5.2 |
| Relative change 2008→2019, married (15–24; 25–49) | Table 2 | — | +364.9%, +186.8% |
| N-weighted average of age rows, married, 2008/2013/2019 | Table 2 internal check | 6.7 / 15.6 / 20.9 | 6.8 / 15.6 / 20.9 (table self-consistent; all-women and unmarried rows also agree within 0.1) |
| Gain, decomposition sample, partnered 15–24; 25–49 | Supplemental file 4, descriptive table 2 | 5.7 → 28.5; 9.5 → 30 | +22.8; +20.5 |
| Gain, decomposition sample, all women 15–49 | Supplemental file 4, descriptive table 1 | 11.7 → 36 | +24.3 |
Table 2 is internally coherent: each 15–49 row equals, within 0.1 pp, the N-weighted average of its 15–24 and 25–49 rows, and the Ns add up within one woman. The abstract's all-women gain is read off this table exactly. The four subgroup gains in the next two sentences of the abstract are not. Rounding moves each table gain by at most 0.1 pp, so it cannot account for differences of 0.9, 4.2, 12.0 and 4.1 pp. Searching all ordered pairs of Table 2 cells turns up only scattered coincidences that mix unrelated rows, years or populations. For example, 10.0 equals the married 25–49 value in 2019 minus the married 15–24 value in 2013. No pair at all gives 19.5.
Figure
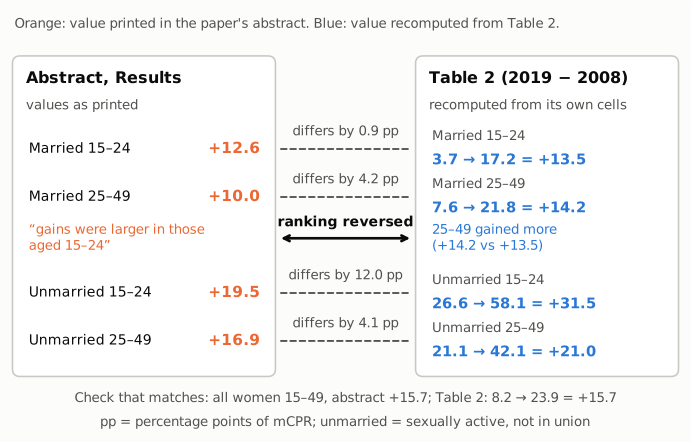
Figure 1. Left panel: the four subgroup gains in mCPR, 2008→2019, and the ranking statement as printed in the abstract (orange). Right panel: the same quantities computed from the 2008 and 2019 cells of Table 2 (blue). The dashed connectors give the size of each discrepancy in percentage points. The double-headed connector marks the married-women comparison: the abstract has the 15–24 group gaining more, Table 2 the 25–49 group (+14.2 vs +13.5). The line under the panels shows the one gain in the same abstract passage that does match Table 2, for all women aged 15–49.
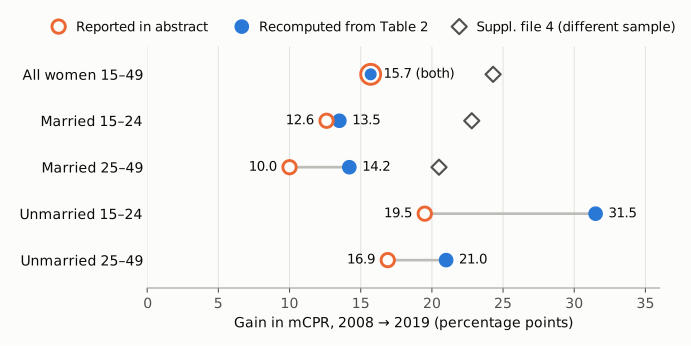
Figure 2. The 2008→2019 gain in mCPR, in percentage points, for each group named in the abstract. Open orange circles are the abstract values. Filled blue circles are recomputed from Table 2. Open grey diamonds are the gains in the decomposition sample of online supplemental file 4 (sexually active, not pregnant, not menopausal and fecund women; no unmarried-only group is reported there). The axis starts at zero. For all women aged 15–49, the abstract and Table 2 values coincide at 15.7 (the blue dot is drawn inside the orange ring). For every subgroup, the abstract value matches neither Table 2 nor the supplement.
Why it matters
- The abstract's only subgroup finding is not supported by the table it summarises. The comparison "gains were larger in those aged 15–24 years (+12.6) than in women aged 25–49 years (+10.0)" is the abstract's sole statement about age differences. Measured the way the abstract measures them, in percentage points, Table 2 gives +13.5 and +14.2: the older group gained slightly more. The 0.7 pp difference is small, and the paper reports no confidence intervals for these subgroups (the Table 2 footer says they cannot be computed from published DHS tables). The table therefore does not support a ranking in either direction with any stated precision. It does not support the abstract's 2.6 pp lead for the younger group.
- The size of the gains among unmarried women is understated. The abstract's +19.5 and +16.9 compare with +31.5 and +21.0 in Table 2. The gains among unmarried women came almost entirely between 2008 and 2013 (+30.9 and +32.2); between 2013 and 2019 the 15–24 group rose only 0.6 pp and the 25–49 group fell 11.2 pp, from 53.3% to 42.1%.
- In relative terms the younger married group did gain more. mCPR among married women aged 15–24 rose 4.65-fold (3.7% to 17.2%), against 2.87-fold for those aged 25–49. A reader could reach the abstract's qualitative conclusion that way, but not with the absolute figures the abstract prints.
- The main conclusions are not affected. The headline rise from 8.2% to 23.9% (+15.7 pp), the married total of 6.7% to 20.9%, the Oaxaca–Blinder decomposition (supplemental file 4), the qualitative findings and the policy conclusions do not use the four abstract subgroup values. The main text cites the overall and married totals and the unmarried 15–24 levels (57.5% in 2013, 58.1% in 2019); all of these match Table 2.
- The abstract is the most widely read part of the paper. Readers and indexing services that rely on it will carry forward subgroup gains that the paper's own table contradicts.
Explanations considered
- A different time window. Not supported. The abstract frames all figures as "Between 2008 and 2019", and the all-women figure in the same passage is the 2008→2019 difference. The 2008→2013 gains (married +8.1 and +9.0; unmarried +30.9 and +32.2) and the 2013→2019 gains (married +5.4 and +5.2; unmarried +0.6 and −11.2) do not reproduce the abstract values either.
- Relative rather than absolute change. Not supported. The abstract prints the values with a "+" and as "points", like the all-women "+15.7 percentage points". The relative changes are +364.9%, +186.8%, +118.4% and +99.5%, none of which resembles the printed values.
- Rounding. Ruled out. With each Table 2 cell uncertain by ±0.05, each recomputed gain is fixed to within ±0.1 pp, much less than the 0.9 to 12.0 pp discrepancies.
- A different population or sample, such as the decomposition sample. Not able to explain it. Supplemental file 4 reports mCPR for the decomposition sample (sexually active in the past 12 months, not pregnant, not menopausal, fecund). Its gains are +22.8 (partnered 15–24), +20.5 (partnered 25–49) and +24.3 (all women 15–49), and the supplement has no unmarried-only group. In that sample the younger partnered group does gain more, which agrees with the abstract's direction but not with its numbers. The abstract does not name this sample. Its all-women figure in the same passage comes from Table 2, not from the supplement.
- Annualised gains. Not supported. Per-year gains over the 11 years are 1.23, 1.29, 2.86 and 1.91 pp.
- A mix-up of rows or cells in Table 2. Not supported as a single consistent error. An exhaustive search over pairs of Table 2 cells finds matches for 12.6, 10.0 and 16.9 only by combining unrelated rows or years, and no pair gives 19.5.
- An error in Table 2 rather than the abstract. Not supported by the paper's internal checks. Table 2's age rows reproduce its 15–49 rows as N-weighted averages to within 0.1 pp. The 15–49 rows are the figures the Results text and the abstract's own all-women sentence cite. Without the DHS source tables, an independent check of each subgroup cell is outside the scope of this note. Whichever is correct, the abstract and Table 2 cannot both be.
- Values taken from an external source. Not determinable from the paper. The Methods also mention UN Population Division estimates, but the paper reports none by age and marital status, and the abstract does not cite a source for the subgroup gains. Nothing in the paper or its supplements yields the four values.
- A text-conversion artifact. Ruled out. The PMC HTML, the Europe PMC full-text XML (parsed cell by cell) and a secondary copy of the abstract all carry the same values. Table 2 has no stray superscripts, signs or misaligned cells.
Status
- Version of record. The publisher's pages (gh.bmj.com, through doi.org, the article page and the PDF) returned HTTP 403 to automated access. I checked the publisher-deposited full text in two places, the PMC HTML page and the Europe PMC full-text XML. A secondary copy of the abstract (an institutional repository record) has the same wording and values. Every quotation above was checked verbatim against the PMC-archived text with
src/show.py. - Supplements. All seven supplementary files were downloaded as one bundle from Europe PMC: a PRISMA figure, search strategies, operationalisation of variables, a grey-literature table, the decomposition analysis (file 4, PDF), interview guides and a policy mapping. Only file 4 contains subgroup mCPR; its values are given above and do not match the abstract.
- Corrections and comments. As of 2026-10-24 I found no correction, erratum, retraction or expression of concern.
src/known.pyreturns no Crossref update relations, no PMC notices and no Europe PMC notices, and the Crossref record has no update-to or updated-by fields. The PubPeer API returned no record (HTTP 404) for the DOI, and a web search for the title together with "PubPeer" found no thread. - Sources. PMC article PMC13250227; Europe PMC full-text XML and supplementary files for PMC13250227; Crossref; PubPeer; https://doi.org/10.1136/bmjgh-2024-018775.
Suggested correction
If Table 2 is correct, the abstract's Results sentences
Among married women, gains were larger in those aged 15–24 years (+12.6) than in women aged 25–49 years (+10.0). Unmarried women maintained substantially higher use, with gains of +19.5 and +16.9 points, respectively.
could read
Among married women, gains were similar in those aged 15–24 years (+13.5) and 25–49 years (+14.2), although prevalence among the younger group rose more in relative terms (from 3.7% to 17.2%). Unmarried, sexually active women maintained substantially higher use, with gains of +31.5 and +21.0 points, respectively.
If the abstract values were instead drawn from a different source or sample, the authors could name that source in the abstract and explain why its subgroup gains differ from Table 2. Either way, the abstract's comparison of married age groups should be stated so that it agrees with the reported data.