← Back to the plain-language case
Abstract reports 6-month BMI difference versus prednisone as 12-month result, and reuses it for height
Neurology (2026) · doi:10.1212/WNL.0000000000214756 · PMC13225239
Summary
The abstract gives the 12-month least-squares-mean (LSM) difference in BMI Z-score between vamorolone 6 mg/kg/d and prednisone as 0.57 [95% CI 0.24–0.90]. In the paper's Table 3, those three numbers are the 6-month value. The 12-month value is 0.24 (−0.04 to 0.52; p = 0.09), and its confidence interval includes zero. The abstract then gives the same triple, 0.57 [0.24–0.90], as the 12-month height Z-score difference versus prednisone, where Table 3 reports 0.44 (0.25 to 0.64). The deflazacort values in the same two sentences match Table 3 exactly, and the Results text and the Discussion agree with Table 3. So the error is confined to the two prednisone figures in the abstract. Those figures make the 12-month BMI excess on vamorolone look 2.4 times larger than the paper's own estimate, and statistically significant when it is not.
What the paper reports
Abstract, Results (BMI):
Body mass index (BMI) Z-scores increased in all groups, greatest with vamorolone (12-month LSM difference [95% CI]: vamorolone vs prednisone 0.57 [0.24–0.90]; vamorolone vs deflazacort 0.29 [0.03–0.56])
Abstract, Results (height), same sentence:
(12-month LSM difference in height Z-scores [95% CI]: vamorolone vs prednisone 0.57 [0.24–0.90]; vamorolone vs deflazacort 0.72 [0.53–0.91])
Table 3, "Comparisons of LSM Changes From Baseline Between Treatments at 6 and 12 Months for Anthropometric Outcomes Performed Using Weighted Data". Columns: n; LSM difference; 95% CI; p, at 6 mo and then at 12 mo:
BMI Z-score | Vam 6/Pred | 26/48 | 0.57; 0.24, 0.90 | 0.009 | 26/48 | 0.24; -0.04, 0.52 | 0.09
BMI Z-score | Vam 6/DFZ | 26/54 | 0.32; 0.00, 0.64 | 0.05 | 26/51 | 0.29; 0.03, 0.56 | 0.03
Height Z-score | Vam 6/Pred | 26/48 | 0.25; 0.14, 0.36 | <0.0001 | 26/48 | 0.44; 0.25, 0.64 | <0.0001
Height Z-score | Vam 6/DFZ | 26/51 | 0.50; 0.39, 0.61 | <0.0001 | 26/51 | 0.72; 0.53, 0.91 | <0.0001
Results, "Anthropometric Analyses" (labels 0.57 as the 6-month value):
LSM estimates of BMI Z-scores increased in all treatment groups at 12 months, with a decrease in BMI observed for prednisone at 6 months (prednisone vs vamorolone 6 mg/kg/d at 6 months, BMI Z-score LSM difference 0.57; 95% CI 0.24–0.90; p = 0.009) and a smaller increase for deflazacort compared with vamorolone at 12 months (LSM difference 0.29; 95% CI 0.03–0.56; p = 0.03) (Table 3; Figure 3A).
Discussion, paragraph 4:
To this end, we found that the increase in the BMI Z-score from baseline was greater on vamorolone than prednisone at 6 but not at 12 months.
What the paper's own numbers show
Method: each abstract triple (estimate, lower, upper) was compared for exact equality with all 12 cells of Table 3. Each cell was then checked for internal consistency. The standard error was recovered from the CI width as (upper − lower) / (2 × 1.96), and the two-sided p was recomputed from z = estimate / SE under a normal approximation. This is a check only: the paper's mixed model uses Kenward-Roger degrees of freedom, which give slightly larger p values. All calculations are in recompute.py.txt.
| Quantity | Location | Reported | Recomputed from the paper's own numbers |
|---|---|---|---|
| BMI Z-score, vamorolone 6 vs prednisone, "12-month" | Abstract | 0.57 [0.24–0.90] | Table 3 at 12 mo: 0.24 (−0.04, 0.52). The triple equals only the 6-mo BMI cell |
| BMI Z-score, vamorolone 6 vs prednisone, 12 mo | Table 3 | 0.24; −0.04, 0.52; p = 0.09 | SE 0.143, z 1.68, p = 0.093 (consistent); CI includes 0 |
| BMI Z-score, vamorolone 6 vs prednisone, 6 mo | Table 3; Results text | 0.57; 0.24, 0.90; p = 0.009 | SE 0.168, z 3.39, p ≈ 0.0007 (see note) |
| Abstract minus Table 3, BMI vs prednisone, 12 mo | Abstract vs Table 3 | 0.57 vs 0.24 | Difference 0.33; ratio 2.38 |
| Height Z-score, vamorolone 6 vs prednisone, "12-month" | Abstract | 0.57 [0.24–0.90] | Table 3 at 12 mo: 0.44 (0.25, 0.64), and at 6 mo: 0.25. The triple equals the 6-mo BMI cell |
| Height Z-score, vamorolone 6 vs prednisone, 12 mo | Table 3 | 0.44; 0.25, 0.64; p < 0.0001 | SE 0.099, z 4.42, p ≈ 1e−5 (consistent); abstract overstates by 0.13 |
| BMI Z-score, vamorolone 6 vs deflazacort, 12 mo | Abstract; Table 3 | 0.29 [0.03–0.56]; p = 0.03 | Abstract equals Table 3 12-mo cell; p = 0.032 (consistent) |
| Height Z-score, vamorolone 6 vs deflazacort, 12 mo | Abstract; Table 3 | 0.72 [0.53–0.91]; p < 0.0001 | Abstract equals Table 3 12-mo cell; p ≈ 1e−13 (consistent) |
Every Table 3 CI midpoint equals its point estimate to rounding (for example 0.240 for 0.24, and 0.445 for 0.44). The table's columns are therefore not misaligned. Of the four comparisons the abstract labels "12-month", the two deflazacort ones match their 12-month cells and the two prednisone ones match neither 12-month cell.
Note on a separate, minor point: for the 6-month BMI cell, the CI 0.24–0.90 implies p ≈ 0.0007 under a normal approximation. With a t reference distribution, it implies p ≤ 0.003 for any df of 10 or more. The reported p = 0.009 would need about 4 degrees of freedom. This affects only the precision of a p value whose result is significant either way, and it is not the subject of this write-up.
Figure
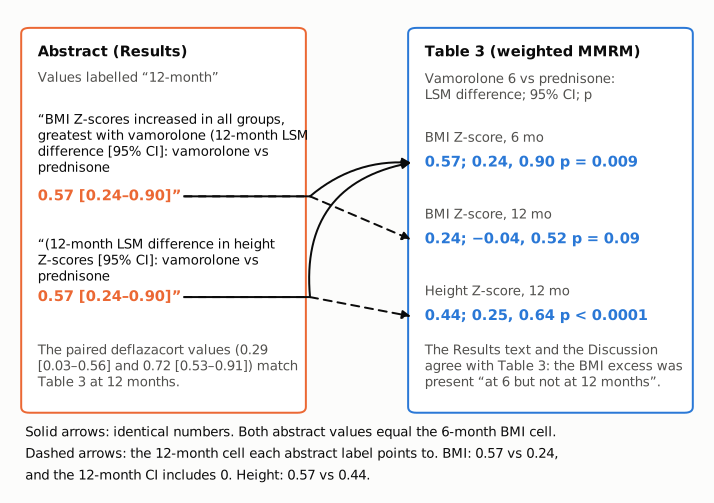
Figure 1. The two abstract values labelled "12-month" for vamorolone 6 mg/kg/d versus prednisone (left, orange) set against Table 3 of the same paper (right, blue). Solid arrows join identical numbers: both abstract values (BMI and height) equal the 6-month BMI cell, 0.57; 0.24, 0.90. Dashed arrows lead to the 12-month cells the abstract label refers to: BMI 0.24 (−0.04 to 0.52, p = 0.09) and height 0.44 (0.25 to 0.64). All numbers are quoted from the article.
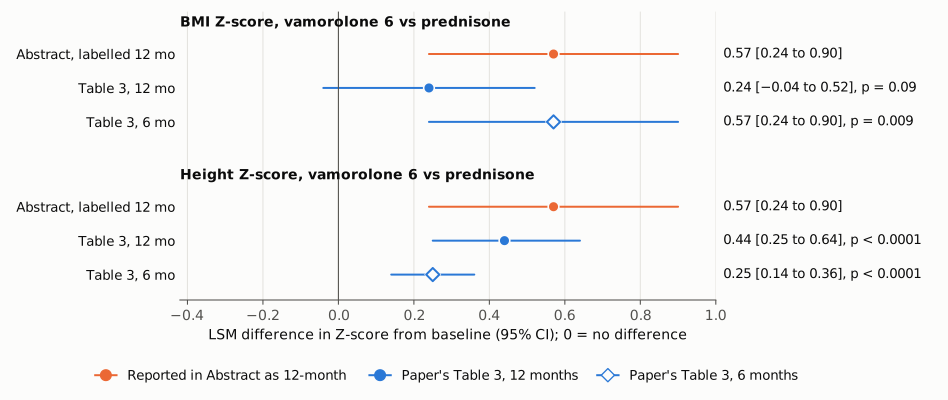
Figure 2. The same contrasts drawn on one LSM-difference axis, with a reference line at 0 (no difference). For BMI, the abstract's "12-month" interval (orange) lies exactly on the Table 3 6-month interval (blue diamond). The Table 3 12-month interval (blue dot) is shifted left and crosses 0. For height, the abstract interval is wider than and offset from both Table 3 height intervals. Values are from the paper; recomputed p values are given in the table above.
Why it matters
Steroid-related weight gain is a main safety concern in Duchenne muscular dystrophy, and comparing weight status with prednisone is one of the paper's key anthropometric results. Read alone, the abstract implies that at 12 months vamorolone raised BMI Z-score clearly more than prednisone did (0.57, CI excluding 0). The paper's own 12-month estimate is less than half that size (0.24) and is not statistically significant (CI −0.04 to 0.52, p = 0.09). That matches the Discussion's statement that the excess was present "at 6 but not at 12 months". Many readers see only the abstract, and abstract values are what get indexed and carried into reviews and meta-analyses, so the overstatement can spread.
The height error leaves the direction and significance of the growth finding intact: Table 3 gives 0.44 (0.25 to 0.64), p < 0.0001. Only its size is overstated, by 0.13 Z-score units. The paper's headline conclusions are unaffected: similar motor efficacy, growth protection with vamorolone, and BMI increases on all three treatments. Vamorolone's 12-month BMI excess over deflazacort (0.29, 0.03 to 0.56) is correctly reported.
Explanations considered
- A different model, population or weighting in the abstract. This does not account for the numbers. The abstract describes the same entropy-balanced, weighted mixed model for repeated measures as Table 3, and its two deflazacort values in the same sentences match the Table 3 12-month cells exactly. Only the prednisone values differ, and they equal another cell of the same table.
- Unweighted data (Figure 3B). This does not account for the numbers. Figure 3B shows unweighted arithmetic mean changes per group with t-based CIs, not between-treatment LSM differences, so it cannot be the source of a 0.57 [0.24–0.90] contrast. That triple is reproduced exactly by one Table 3 cell.
- Misaligned or mislabelled Table 3 columns. Ruled out. Each Table 3 CI is centred on its estimate, each cell's p value matches its CI apart from the 6-month BMI cell (see note above), and the Results text labels 0.57 (0.24–0.90; p = 0.009) explicitly as the 6-month BMI comparison. The Discussion's "at 6 but not at 12 months" fits the table's 12-month value of 0.24 with p = 0.09.
- Different time points across the two trials (weeks 24/48 vs months 6/12). This does not account for the numbers. The paper aligns these visits as 6 and 12 months for all comparisons, and the deflazacort contrasts, built the same way, match.
- PMC conversion artefact. Ruled out. The publisher's typeset PDF (Neurology 2026;107:e214756) has the same abstract and Table 3 values, and the Europe PMC JATS XML shows proper minus signs in "0.24; −0.04, 0.52".
- A height value that is genuinely 0.57. Not supported. Table 3 gives the vamorolone-vs-prednisone height Z-score difference as 0.25 at 6 months and 0.44 at 12 months. The abstract's height triple is identical, digit for digit, to the 6-month BMI cell.
Status
As of 2026-10-23:
- Version of record: checked. The publisher's typeset PDF (14 pp., CC BY 4.0) was obtained through the Newcastle University ePrints repository, record 312342, because neurology.org returned 403. Its abstract and Table 3 match the PMC text quoted above. The PMC archive copy was read with the project's
show.py. - Supplement: the PMC/Europe PMC archive includes no supplementary files. According to the text, eTable 1 and eFigures 1–4 cover cohort balancing and the vamorolone 2 mg/kg/d vs intermittent prednisone comparison, not these contrasts. The supplement could not be opened (neurology.org returned 403). It is not needed, because Table 3 of the main text holds the values in question.
- Corrections: a publisher correction exists for this article: doi:10.1212/WNL.0000000000218498, Neurology 2026;107(5):e218498, online 2026-07-30 (Crossref "update-to" this article; PubMed type "Published Erratum", PMID 42531535; PMC records a correction-forward link). Its text could not be retrieved: neurology.org returned 403, PubMed and Europe PMC list no abstract, and the notice is not in PMC. It is therefore unverified whether this correction addresses the abstract values described here. The PMC copy of the article still shows the values quoted above.
- PubPeer: a search for the DOI was attempted, but pubpeer.com required human verification and returned no results to this check. A web search found no PubPeer thread or other public comment on these values.
- Sources: PMC13225239 (PubMed Central JATS); Europe PMC JATS XML; publisher PDF via eprints.ncl.ac.uk/312342; Crossref metadata for 10.1212/WNL.0000000000214756 and 10.1212/WNL.0000000000218498.
Suggested correction
Unless the existing correction (e218498) already covers it, the abstract's Results sentence could be amended to the 12-month values in Table 3:
Body mass index (BMI) Z-scores increased in all groups, greatest with vamorolone (12-month LSM difference [95% CI]: vamorolone vs prednisone 0.24 [−0.04 to 0.52]; vamorolone vs deflazacort 0.29 [0.03–0.56]), whereas growth slowdown occurred in prednisone- and deflazacort-treated boys but not vamorolone (12-month LSM difference in height Z-scores [95% CI]: vamorolone vs prednisone 0.44 [0.25–0.64]; vamorolone vs deflazacort 0.72 [0.53–0.91]).
Because the 12-month BMI difference versus prednisone is not statistically significant, the phrase "greatest with vamorolone" could also be qualified, for example "greater with vamorolone than deflazacort at 12 months, and than prednisone at 6 months". That wording would match the paper's own Discussion. Separately, the authors could check the 6-month BMI p value (0.009) in Table 3 and the Results text against its CI (0.24–0.90).