← Back to the plain-language case
Abstract swaps the insured and uninsured labels on the key outpatient odds ratios
PLoS Med (2026) · doi:10.1371/journal.pmed.1005087 · PMC13160435
Summary
For people with physical-psychological-cognitive multimorbidity, the Abstract reports an outpatient odds ratio of 6.22 (95% CI 5.33 to 7.25) among insured individuals and 3.40 (3.03 to 3.82) among uninsured individuals. The Results report the same two estimates and intervals with the groups reversed: 6.22 without insurance and 3.40 with insurance. Fig 5's source data (S1 Data) and the interaction model in S1 Appendix agree with the Results. The Abstract's labels also contradict the Abstract's own preceding sentence, which says the association was "attenuated" among the insured. As printed, the only number the Abstract gives for the insurance analysis points the opposite way from the paper's finding: the association with outpatient use looks 0.55 times as strong among the uninsured, when the Results give 1.83 times as strong.
What the paper reports
Abstract, Methods and findings:
Among individuals with health insurance coverage, the association between multimorbidity and outpatient care utilisation was generally attenuated. This was especially evident for those with physical-psychological-cognitive multimorbidity: insured individuals had an OR of 6.22 (95% CI [5.33, 7.25]; p < 0.001), compared with 3.40 (95% CI [3.03, 3.82]; p < 0.001) among uninsured individuals.
Results, subsection "The role of health insurance", first paragraph:
Specifically, among individuals with health insurance coverage, the association between multimorbidity and outpatient care use was generally weaker. This was particularly evident for those with physical-psychological-cognitive multimorbidity (without insurance: OR 6.22, 95% CI [5.33, 7.25]; p < 0.001; with insurance: OR 3.40, 95% CI [3.03, 3.82]; p < 0.001), physical-psychological multimorbidity (without insurance: OR 8.32, 95% CI [7.76, 8.93]; p < 0.001; with insurance: OR 3.01, 95% CI [2.76, 3.29]; p < 0.001), and single physical conditions (without insurance: OR 5.67, 95% CI [5.39, 5.97]; p < 0.001; with insurance: OR 3.53, 95% CI [3.23, 3.85]; p < 0.001).
Discussion, fifth paragraph:
In this study, the association between multimorbidity and healthcare use was less pronounced among insured individuals than among those without coverage, especially regarding outpatient services.
Author summary:
Health insurance appeared to buffer the association between multimorbidity and healthcare utilisation.
Methods, "Health insurance":
we treated health insurance at the individual level as a binary variable (covered versus not covered), encompassing public, private, or any other form of coverage.
What the paper's own numbers show
Method. I compared the Abstract's estimates with those in the Results sentence, checked each OR against its own confidence interval (the geometric midpoint of a symmetric log-scale interval should equal the point estimate), and compared both with the unrounded source data for Fig 5 in S1 Data (sheet "Figure_5"). To express the direction of the insurance difference as a single number, I computed the ratio OR(uninsured) / OR(insured) for each multimorbidity pattern. A value above 1 means the association is weaker among the insured. Its 95% CI uses the standard errors implied by the printed intervals, treating the two strata as independent; they are disjoint groups of participants, so this is a reasonable approximation. Every number below is printed by recompute.py.txt.
| Quantity | Location | Reported | Recomputed from the paper's numbers |
|---|---|---|---|
| OR, outpatient, phy-psy-cog, insured | Abstract | 6.22 [5.33, 7.25] | 3.40 [3.03, 3.82] per Results and S1 Data (3.4033) |
| OR, outpatient, phy-psy-cog, uninsured | Abstract | 3.40 [3.03, 3.82] | 6.22 [5.33, 7.25] per Results and S1 Data (6.2227) |
| OR, outpatient, phy-psy-cog, without / with insurance | Results, "The role of health insurance" | 6.22 [5.33, 7.25] / 3.40 [3.03, 3.82] | geometric CI midpoints 6.22 / 3.40 (internally consistent) |
| Abstract vs Results estimates | Abstract; Results | same two estimates and CIs | identical to two decimals, with the group labels exchanged |
| S1 Data, outpatient, no / yes insurance | S1 Data, sheet Figure_5 | phy-psy-cog 6.2227 / 3.4033; phy-psy 8.3225 / 3.0145; single physical 5.6723 / 3.5259 | round to the Results values 6.22 / 3.40, 8.32 / 3.01, 5.67 / 3.53 |
| OR(uninsured) / OR(insured), phy-psy-cog | derived from Results | "generally weaker" among insured | 1.83 [1.51, 2.22], z = 6.1 |
| Same ratio, using the Abstract's labels | derived from Abstract | "generally attenuated" among insured | 0.55 [0.45, 0.66]: stronger among insured, contradicting the Abstract's own sentence |
| OR(uninsured) / OR(insured), phy-psy | derived from Results | 8.32 vs 3.01 | 2.76 [2.47, 3.09] (same direction as the Results) |
| OR(uninsured) / OR(insured), single physical | derived from Results | 5.67 vs 3.53 | 1.61 [1.45, 1.78] (same direction as the Results) |
| Multimorbidity × insurance interaction, phy-psy-cog, outpatient | S1 Appendix, Table N | OR 0.66, p < 0.001 | below 1, so weaker among the insured (agrees with the Results); stratified ratio insured / uninsured = 3.4033 / 6.2227 = 0.547 |
A minor side note that is not part of the finding: the S1 Data bounds for the uninsured phy-psy-cog estimate, 5.3362 and 7.2565, round to [5.34, 7.26]. The paper prints [5.33, 7.25] in both the Abstract and the Results, which looks like truncation rather than rounding. This does not affect any conclusion.
Figure
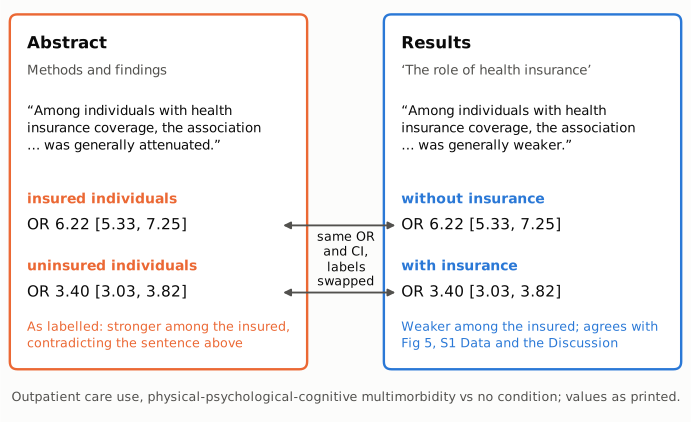
Figure 1. The two passages that report the insurance-stratified outpatient odds ratios for physical-psychological-cognitive multimorbidity, reduced to their key words and numbers as printed. Left (orange border): the Abstract, which says the association was "attenuated" among the insured and then gives the insured group the larger OR (6.22) and the uninsured group the smaller one (3.40). Right (blue border): the Results subsection "The role of health insurance", which gives the same estimates and CIs to two decimals with the groups the other way round: 6.22 without insurance and 3.40 with insurance. The connectors join identical estimates. Only the Results assignment fits the attenuation sentence that both passages contain, and it is the one that matches Fig 5's source data (S1 Data), the interaction model (S1 Appendix Table N) and the Discussion.
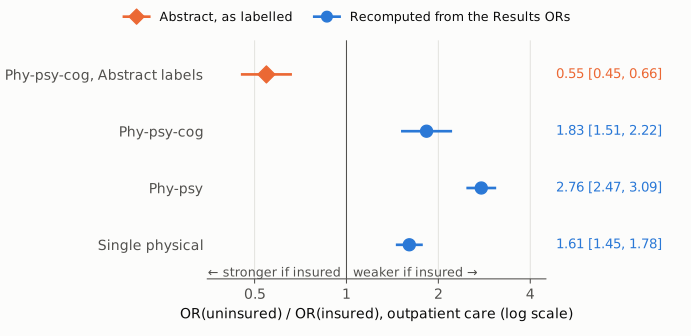
Figure 2. Ratio of the outpatient odds ratio among the uninsured to that among the insured, on a log scale. The thin vertical line at 1 marks no difference by insurance status; values to the right mean the association is weaker among the insured. Blue circles are recomputed from the ORs and CIs in the Results for the three patterns the paper reports. All three lie to the right of 1 (1.83, 2.76 and 1.61). The orange diamond takes the Abstract's labels at face value for physical-psychological-cognitive multimorbidity and gives 0.55 [0.45, 0.66], the mirror image of the blue estimate for the same pattern. The Abstract's labelling is the only one of the four that would mean a stronger association among the insured. Intervals assume independent strata.
Why it matters
The Abstract contains a single numerical result for the insurance analysis, and the Abstract's conclusion rests on it: "Our study highlights the potential role of health insurance in reducing socioeconomic disparities in healthcare utilisation associated with multimorbidity". As printed, those numbers say that the association between the most complex multimorbidity pattern and outpatient use was stronger, by a factor of about 1.8, among people with insurance. That is the opposite of the buffering finding the paper reports. Readers who see only the Abstract, along with indexing services, evidence summaries and systematic reviews that extract numbers from abstracts, would record the effect in the wrong direction, or would see a sentence that contradicts its own numbers and be unable to tell from the Abstract which one is right.
The paper's main conclusion is not affected. The Results, the Fig 5 source data, the interaction model in S1 Appendix, the Discussion and the Author summary all use the correct labels, and the two other patterns reported in the Results (physical-psychological, single physical) show the same direction. The error is in labelling, not in the analysis. The title, Table 1 and the Conclusions do not repeat the swapped numbers.
Explanations considered
- The Abstract reports a different model or population. This does not account for the numbers. The outcome (outpatient use), the pattern (physical-psychological-cognitive), the point estimates, the CIs and the p-values are identical in both places. The Methods describe a single set of insurance-stratified models (pooled across countries with country fixed effects), and no other insurance-stratified estimates appear in the paper.
- The insurance variable is coded the other way somewhere. Ruled out. The Methods define insurance as a binary variable, "covered versus not covered", and nothing in the paper reverses that coding. S1 Data labels the Fig 5 source rows Health_Insurance = No (6.2227) and Yes (3.4033), which matches the Results.
- The Results, not the Abstract, contain the swap. Ruled out. The Results assignment agrees with S1 Data, with Fig 5 (in the outpatient panel, the "No insurance" marker for this pattern is at about 6.2 and the "Yes" marker at about 3.4), with the S1 Appendix interaction OR of 0.66 (below 1, meaning weaker among the insured), with the other two patterns, and with the attenuation sentence that the Abstract and the Results share.
- Rounding or interval arithmetic. Not relevant. Each printed OR is the geometric midpoint of its CI, so the numbers are internally consistent; only the group words differ.
- A conversion or typesetting artifact in PMC. Ruled out. The publisher's HTML article page and printable PDF and the Europe PMC full-text XML carry the same Abstract wording ("insured individuals had an OR of 6.22 ... among uninsured individuals") and the same Results wording. The difference is between the words "insured" and "uninsured", not a lost character or a misaligned table cell.
Status
- Version of record. Checked on the PLOS Medicine article page (journals.plos.org). The page lists Version 1, marked "Uncorrected Proof", and Version 2. Both carry the swapped Abstract and the Results as quoted, and so does the printable PDF (text extracted with PyMuPDF). Europe PMC's full-text XML and the PMC-archived text match. Every quote above was confirmed verbatim against the PMC-archived text.
- Supplements. S1 Appendix (DOCX), S1 Checklist (STROBE) and S1 Data (XLSX, "Minimal dataset") are listed. S1 Data, sheet "Figure_5", and S1 Appendix Table N were opened and agree with the Results labels (values in the table above). They resolve which assignment is correct.
- Corrections. None found. Crossref lists one update, a publisher "new version" record dated 2026-05-11 that points to the article's own DOI. This is the move from Version 1 to Version 2, not a correction notice, and Version 2 still has the swapped labels. No correction, erratum, expression of concern or retraction was found in Crossref, PMC or Europe PMC, and the publisher page shows no correction notice.
- Comments. PubPeer's search page and API returned a Cloudflare block (HTTP 403) in this session, so PubPeer could not be checked directly. A web search for the DOI together with "correction" returned only the article and index records.
- Sources. PMC13160435; https://journals.plos.org/plosmedicine/article?id=10.1371/journal.pmed.1005087 (HTML and printable PDF); S1 Data and S1 Appendix from the same page; Crossref; Europe PMC. As of 2026-10-24.
Suggested correction
In the Abstract (Methods and findings), exchange the group labels so that the sentence agrees with the Results, Fig 5 and S1 Data:
This was especially evident for those with physical-psychological-cognitive multimorbidity: uninsured individuals had an OR of 6.22 (95% CI [5.33, 7.25]; p < 0.001), compared with 3.40 (95% CI [3.03, 3.82]; p < 0.001) among insured individuals.
Optionally, the authors could also check the printed bounds of the uninsured CI (S1 Data gives 5.3362 and 7.2565, which round to 5.34 and 7.26).