← Back to the plain-language case
Abstract says Serpin A1c rose in all three tissues; the paper's data show liver only
eLife (2026) · doi:10.7554/eLife.107332 · PMC13090031
Summary
The abstract says that under intermittent fasting "Serpin A1c emerged as the only protein commonly upregulated across all three tissues." The paper's Results and Conclusion, the Figure 3B inset table and both supplementary data files report something else: Serpin A1c goes up in liver and down in skeletal muscle and cerebral cortex. In the per-animal values of Supplementary file 3 the IF16 minus AL differences are +0.76, −0.51 and −0.55 log2 units. Supplementary file 1 reports limma logFCs of +0.78, −0.47 and −0.55. Serpin A1c is the only protein differentially expressed in all three tissues, but it is upregulated in one of them, not three. The abstract presents it as a shared, systemic response, which is the opposite of the paper's own reading in the Results, where the pattern indicates "a tissue-specific regulatory role".
What the paper reports
Abstract:
Notably, Serpin A1c emerged as the only protein commonly upregulated across all three tissues, highlighting its potential role in systemic adaptation to IF.
Results and discussion, section "Identification of shared and tissue-specific biological processes", first paragraph:
Our analysis revealed that Serpin A1c was the only protein commonly dysregulated across all three organs, suggesting a potentially central role for this protein in the systemic response to IF. The observation that Serpin A1c levels increase in the liver but decrease in muscle and cerebral cortex in response to IF suggests a tissue-specific regulatory role for this protein during metabolic adaptation to IF (Figure 3C, Supplementary file 3).
Same paragraph:
In the liver, the upregulation of Serpin A1c, a serine protease inhibitor, may reflect a protective mechanism to modulate inflammation or protein degradation as the body shifts toward fat metabolism and ketogenesis during fasting (Okagawa et al., 2024). Conversely, its reduction in muscle and cerebral cortex could indicate a reduced need for protease inhibition in these tissues, possibly to facilitate protein breakdown for energy or to utilize resources under fasting conditions (Sanfeliu et al., 2019; Pattamaprapanont et al., 2024).
The results confirmed that IF upregulates the expression levels of Serpin A1c in the liver (Figure 3D).
Conclusion, second paragraph:
Notably, our findings reveal that while some molecular responses to IF are conserved across tissues, such as the upregulation of Serpin A1c in the liver and its downregulation in muscle and cortex, others are highly tissue-specific.
Figure 3 legend:
(C) Expression levels of Serpin A1c in the liver, muscle, and cerebral cortex. (D) Alpha1-antitrypsin staining in green in the liver of both AL and IF mice. n=3 mice in each group.
The Figure 3B inset table, read from the figure image, lists Q00896 / SERPINA1C as "Up in liver", "Down in muscle" and "Down in cortex".
What the paper's own numbers show
Method. I took three data sources from the paper. (1) The per-animal log2 normalized Serpin A1c (UniProt Q00896) intensities in Supplementary file 3, sheet "Liver+Muscle+Cortex_Common DEP": n = 7 per group, labelled only "Group1" and "Group2". (2) The raw label-free intensities for the same protein in Supplementary file 1 (sheets Liver_raw, Muscle_raw, Cortex_raw), where each sample is labelled "AL" or "IF16". (3) The reported logFC and P value for Q00896 in the Supplementary file 1 DE sheets. I identified Group1 as AL by correlating its values with the log2 raw AL intensities (r = 0.999, 0.986 and 0.984 in liver, muscle and cortex). For each tissue I then computed the IF16 minus AL mean difference with a Welch 95% CI and p value. These two-group tests check direction only. They are not a re-run of the paper's limma (FlexStat) pipeline. Finally, I checked that the Figure 3A and 3B Venn segments add up to the stated totals. Every number below is printed by recompute.py.txt.
| Quantity | Location | Reported | Recomputed from the paper's numbers |
|---|---|---|---|
| Tissues in which Serpin A1c is upregulated | Abstract | 3 of 3 ("commonly upregulated across all three tissues") | 1 of 3 (liver) |
| Serpin A1c direction (liver / muscle / cortex) | Results p. 1; Conclusion; Fig 3B inset table | up / down / down | up / down / down |
| Serpin A1c, liver, IF16 − AL | Supp. file 1 Liver_DE; Supp. file 3 | logFC +0.7837, P = 0.0175 | mean 24.600 → 25.360, +0.760 [95% CI +0.217, +1.303], Welch p = 0.012; raw log2 +0.699 |
| Serpin A1c, skeletal muscle, IF16 − AL | Supp. file 1 Muscle_DE; Supp. file 3 | logFC −0.4667, P = 0.0169 | 23.570 → 23.062, −0.508 [−0.938, −0.078], Welch p = 0.025; raw log2 −0.395 |
| Serpin A1c, cerebral cortex, IF16 − AL | Supp. file 1 Cortex_DE; Supp. file 3 | logFC −0.5507, P = 0.0137 | 21.699 → 21.149, −0.551 [−1.032, −0.069], Welch p = 0.030; raw log2 −0.621 |
| Group medians, AL → IF16 (liver / muscle / cortex) | Fig 3C (box plots); Supp. file 3 | shown graphically | 24.67 → 25.39 / 23.55 → 22.93 / 21.80 → 21.21 |
| DEPs shared by all three tissues | Fig 3B; Results p. 1 | 1 (Serpin A1c, "dysregulated") | 1, consistent |
| Proteins per tissue (liver / muscle / cortex) | Fig 3A | 4777 / 2709 / 6332 | Venn segments sum to 4777 / 2709 / 6332 |
| DEPs per tissue (liver / muscle / cortex) | Fig 3B | 835 / 155 / 294 | Venn segments sum to 835 / 155 / 294 |
The three sources agree on the sign in every tissue. Normalized means, raw intensities and the reported limma logFC all give a rise in liver and a fall in muscle and cortex. The abstract's "upregulated across all three tissues" disagrees with all of them in two of the three tissues.
Figure
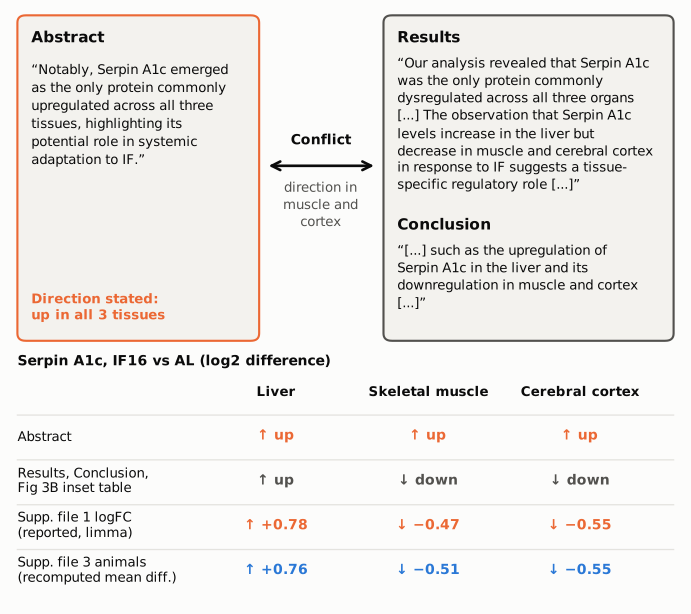
Figure 1. The abstract sentence (left) and the Results and Conclusion sentences on the same protein (right), quoted verbatim from the article as archived in PMC ("[...]" marks omitted text). The table below gives the direction of Serpin A1c change, IF16 versus AL, as each part of the paper states it. The orange values are the logFCs reported in Supplementary file 1. The blue values are mean differences recomputed by recompute.py.txt from the per-animal values in Supplementary file 3. The abstract is the only source that puts muscle and cortex as "up".
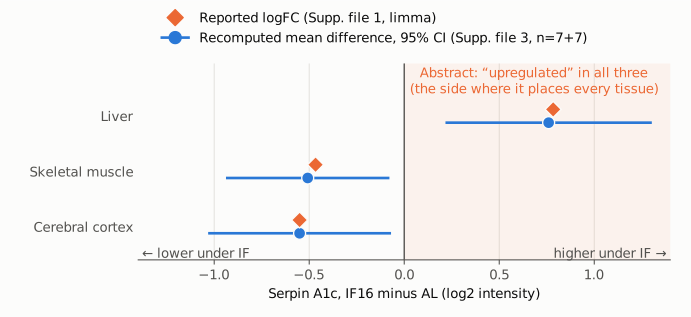
Figure 2. Serpin A1c, IF16 minus AL, in log2 intensity units for each tissue. Orange diamonds are the limma logFCs reported in Supplementary file 1. Blue circles are the mean differences recomputed from the 7 + 7 per-animal values in Supplementary file 3, with Welch 95% confidence intervals. The vertical line marks no change. The shaded region to the right is where the abstract's "upregulated across all three tissues" would place every tissue. Only liver lies there. The muscle and cortex estimates and their whole intervals lie below zero.
Why it matters
Serpin A1c is the only protein from the proteomic profiling that the abstract names, and the abstract uses it as its one concrete example of a shared, "systemic adaptation to IF". It also stands behind the closing claim of "both conserved and tissue-specific responses". As written, readers of the abstract and indexing services are told that one protein rises in liver, muscle and brain under intermittent fasting, which would make it a candidate systemic marker. The paper's data and its own Results describe the opposite pattern. The protein is significantly changed in all three tissues, but it rises in liver and falls in muscle and cortex, and the Results use this to argue for "a tissue-specific regulatory role". The orthogonal validation (immunohistochemistry, Fig 3D, n = 3 per group) covers liver only, so it cannot support a rise in the other two tissues.
The Conclusion has a related wording problem. It gives "the upregulation of Serpin A1c in the liver and its downregulation in muscle and cortex" as an example of a response "conserved across tissues". It reports the directions correctly, but a change in opposite directions is not usually described as conserved.
What is not affected: the metabolic phenotype (glucose, HbA1c, cholesterol, ketone bodies), the per-tissue differential expression and pathway enrichment results, the Venn counts in Figure 3A and 3B, the RNA–protein concordance analysis, and the shared "synaptic vesicle localization" process. The error is confined to the direction the abstract states for one protein in two tissues. The body text, figure and supplements are internally consistent.
Explanations considered
"Upregulated" is used loosely to mean "changed". The Results use the neutral word "dysregulated" for the same finding, which would have been accurate. But "commonly upregulated across all three tissues" states a direction, and the same paper uses "upregulation" and "downregulation" for opposite directions of this very protein in the Results and Conclusion. The abstract's wording cannot be read as direction-neutral.
A different measure, tissue or time point. All three tissues come from one comparison: IF16 versus ad libitum (AL), after 4 months, in male C57BL/6 mice, n = 7 per group. The paper reports no other Serpin A1c protein measurement in muscle or cortex. The immunohistochemistry covers liver only.
Transcript rather than protein. The abstract sentence is about protein ("the only protein"). The transcriptomic sections do not report Serpina1c rising in muscle or cortex. The only serpin they name for cortex is Serpina1e, which is a different gene and is described as downregulated.
Group labels swapped in Supplementary file 3. That file labels the groups only "Group1" and "Group2". The values of Group1 track the log2 raw intensities that Supplementary file 1 labels AL (r ≥ 0.98 in every tissue), and Supplementary file 1's own DE sheets, labelled IF16 versus AL, give the same signs. A swap would also flip liver to "down", contradicting the paper's liver immunohistochemistry.
Choice of statistical test. The sign of a mean difference does not depend on the test. Normalized means, raw intensities and the reported limma estimates all give the same three signs, and the muscle and cortex confidence intervals exclude zero.
Text conversion or archiving error. Not possible here. The conflict is in words ("upregulated across all three tissues"), not in symbols or numbers, and the identical sentence appears in the publisher's version-of-record HTML and PDF, in Europe PMC and in PMC.
Status
As of 2026-10-24:
- Version of record. eLife version of record doi:10.7554/eLife.107332.3, published 17 April 2026, after reviewed preprints v1 (7 October 2025) and v2 (20 March 2026). The publisher's HTML page and PDF (text extracted) have the same abstract, Results and Conclusion wording as the PMC archive and Europe PMC.
- Supplements. Supplementary files 1 and 3 (elife-107332-supp1.xlsx, supp3.xlsx) were downloaded through Europe PMC and read in Python. Their Serpin A1c values are those listed above, and the values used are copied into
recompute.py.txt. - Corrections. Crossref lists no update-to or updated-by relations for this DOI, only the preprint, version and dataset links (PXD063124, GSE290224). PMC and Europe PMC list no correction, erratum, expression of concern or retraction. The eLife page shows no notice.
- Peer review. The public reviews do not discuss the direction of the Serpin A1c change. One author response describes Serpin A1C as "a key protein common to all three organs" when introducing the liver immunohistochemistry.
- PubPeer. Web searches found no PubPeer thread or other public discussion of this point. PubPeer itself could not be searched directly because it returned a human-verification page, so a thread there cannot be ruled out.
Sources: the article as archived in PMC (PMC13090031); elifesciences.org/articles/107332 and its PDF; elifesciences.org/reviewed-preprints/107332/reviews; Supplementary files 1 and 3; Crossref, PMC and Europe PMC records for doi:10.7554/eLife.107332.
Suggested correction
In the abstract, replace
Notably, Serpin A1c emerged as the only protein commonly upregulated across all three tissues, highlighting its potential role in systemic adaptation to IF.
with wording that matches the Results and supplementary data, for example:
Notably, Serpin A1c emerged as the only protein differentially expressed in all three tissues, increasing in the liver but decreasing in muscle and cerebral cortex, suggesting tissue-specific regulation during adaptation to IF.
In the Conclusion, the opposite-direction Serpin A1c pattern would be better given as an example of a response shared across tissues in occurrence but tissue-specific in direction, rather than as a response "conserved across tissues".