← Back to the plain-language case
Abstract's baseline cognitive-component estimates differ from the Results and Table 2, changing one component's significance
Neurology (2026) · doi:10.1212/WNL.0000000000214804 · PMC13067375
Summary
The abstract reports cross-sectional estimates from the hurdle ("zero-inflation") model of CDR-SB, adjusted for EYO, for each of the three cognitive components (reserve CogR, demographic CogD, biomarker CogB). There are three estimates for asymptomatic carriers and two for symptomatic carriers. The Results text and Table 2 describe the same model and outcome and agree with each other, but all five of the abstract's estimates or intervals differ from them. The largest difference is for the demographic component in asymptomatic carriers: the abstract gives an odds ratio of 2.60 (95% CI 1.10–6.16), which excludes 1, while the Results and Table 2 give 1.24 (0.76–2.02), which includes 1. The abstract also understates the biomarker odds ratio (5.16 against 7.77). The headline reserve finding keeps its direction and significance in both versions. However, the abstract's statement that the demographic component is associated with being unimpaired at baseline is not supported by the paper's own Table 2.
What the paper reports
Abstract, "Result":
A total of 710 Dominantly Inherited Alzheimer Network (DIAN) participants were included in the analysis, comprising 271 non-DIAD carriers (nMC), 284 asymptomatic DIAD carriers (aMC), and 155 symptomatic DIAD carriers.
In asymptomatic carriers, using a zero-inflation model adjusted for EYO showed that a 1 SD increase in the reserve component (CogR) was associated with a 4.06-fold increase in the odds of being clinically unimpaired (CDR-SB = 0; 95% CI 1.84–8.95). Similarly, a 1 SD increase in the demographic (CogD) and biomarker (CogB) components increased the odds of being CDR-SB = 0 by 2.60 (95% CI 1.10–6.16) and 5.16 (95% CI 2.00–13.33), respectively.
Among symptomatic carriers, only the reserve and the biomarker components were significant. A 1 SD increase in CogR was associated with a 0.81-fold reduction in baseline CDR-SB score (95% CI 0.72–0.92), and a 1 SD increase in CogB was associated with a 0.60-fold reduction in CDR-SB (95% CI 0.50–0.71).
Results, "Cognitive Reserve, Clinical Status, and Disease Progression", first paragraph (the quotation keeps the original wording, including "multiple"):
For the asymptomatic DIAD carrier, using the zero-inflation model and after adjusting by EYO, 1 SD increase in the reserve component would multiply the odds of being CDR-SB = 0 by 3.66 (95% CI 2.11–6.38), while 1 SD increase in demographic component and biomarker component will multiple the odds by 1.24 (95% CI 0.76–2.02) and 7.77 (95% CI 3.40–17.80), respectively (Table 2).
Once symptomatic, only the reserve and the biomarker components were significant. One SD increase in reserve and in biomarker corresponds to a 0.83-fold (95% CI 0.75–0.92) and 0.60-fold (95% CI 0.52–0.69) decrease in baseline CDR-SB, respectively (Table 2).
Table 2 ("Relationships of Cognitive Components With Baseline Clinical Diagnosis in DIAD Carriers"), CDR-SB = 0 part (columns: characteristic | odds ratio | 95% CI):
Reserve component (cogR) | 3.66 | 2.11–6.38
Demographic component (cogD) | 1.24 | 0.76–2.02
Biomarker component (cogB) | 7.77 | 3.40–17.80
cogR:EYO | 1.07 | 1.02–1.13
cogD:EYO | 0.99 | 0.95–1.04
cogB:EYO | 1.06 | 0.98–1.14
Table 2, "Cognition decline" part:
Reserve component (cogR) | 0.83 | 0.75–0.92
Demographic component (cogD) | 0.94 | 0.86–1.04
Biomarker component (cogB) | 0.60 | 0.52–0.69
Methods, "Statistical Analysis":
Both cross-sectional and longitudinal models included fixed effects of EYO, the 3 cognitive components, and their interaction with EYO.
Results, same section, second paragraph. These are the longitudinal estimates in Table 3, a different model:
One SD increase in reserve, demographic, and biomarker components corresponds to a 3.29-fold (95% CI 2.06–5.26), 1.52-fold (95% CI 1.04–2.23), and 11.82-fold (95% CI 5.67–24.63) increase in odds, respectively.
Discussion, fourth paragraph:
Our study also indicates that demographic factors, for example., age, sex, education, and SES, play a significant role in maintaining asymptomatic status in individuals with DIAD.
However, after symptom onset, the demographic component's effect diminishes, with only the reserve (CogR) and biomarker (CogB) components remaining significantly associated with disease progression.
What the paper's own numbers show
Method. I set each estimate in the abstract beside the matching estimate in the Results text and Table 2. The two body sources print identical values. I checked each printed interval for internal consistency: a log-symmetric 95% CI should have its geometric midpoint, √(lower × upper), at the point estimate. From each interval I derived an approximate standard error on the log scale, SE = (ln upper − ln lower)/3.92, and a Wald z = ln(estimate)/SE with its two-sided p. These p-values are reconstructions from rounded printed values; the paper does not print p-values for these rows. I then tested three ways the two sets could both be right: rounding, evaluation of the component effects at a different EYO through the printed EYO interactions, and a mix-up with the longitudinal Table 3. Every number below is printed by recompute.py.txt.
| Quantity | Location | Reported | Recomputed from the paper's numbers |
|---|---|---|---|
| CogR, odds of CDR-SB = 0, asymptomatic | Abstract | 4.06 (1.84–8.95) | geometric midpoint 4.06; SE 0.404; z = 3.47, p ≈ 0.0005 |
| CogR, odds of CDR-SB = 0, asymptomatic | Results text; Table 2 | 3.66 (2.11–6.38) | midpoint 3.67; SE 0.282; z = 4.60, p < 0.0001; abstract ÷ Table 2 = 1.11 |
| CogD, odds of CDR-SB = 0, asymptomatic | Abstract | 2.60 (1.10–6.16) | midpoint 2.60; SE 0.439; z = 2.17, p ≈ 0.030; CI excludes 1 |
| CogD, odds of CDR-SB = 0, asymptomatic | Results text; Table 2 | 1.24 (0.76–2.02) | midpoint 1.24; SE 0.249; z = 0.86, p ≈ 0.39; CI includes 1; abstract ÷ Table 2 = 2.10 |
| CogB, odds of CDR-SB = 0, asymptomatic | Abstract | 5.16 (2.00–13.33) | midpoint 5.16; SE 0.484; z = 3.39, p ≈ 0.0007 |
| CogB, odds of CDR-SB = 0, asymptomatic | Results text; Table 2 | 7.77 (3.40–17.80) | midpoint 7.78; SE 0.422; z = 4.85, p < 0.0001; abstract ÷ Table 2 = 0.66 |
| CogR, ratio on CDR-SB, symptomatic | Abstract vs Results text; Table 2 | 0.81 (0.72–0.92) vs 0.83 (0.75–0.92) | SE 0.063 vs 0.052; ratio 0.98; both p < 0.001 |
| CogB, ratio on CDR-SB, symptomatic | Abstract vs Results text; Table 2 | 0.60 (0.50–0.71) vs 0.60 (0.52–0.69) | same point estimate; SE 0.089 vs 0.072 (different intervals) |
| Size of the gaps against rounding | all five pairs | — | OR-scale differences 0.40, 1.36, 2.61, 0.02 and 0.00, with interval limits differing in every pair. Two-decimal rounding can move a value by at most 0.01 |
| EYO shift that would turn Table 2 into the abstract value, OR × interactionᵉ | Table 2 interaction rows (1.07, 0.99, 1.06) | — | CogR +1.5 y, CogD −73.7 y, CogB −7.0 y: no single shift fits |
| Abstract vs longitudinal estimates | Table 3; Results paragraph 2 | 3.29, 1.52, 11.82 (asymptomatic); 0.92, 0.73 (symptomatic) | none equals the abstract's 4.06, 2.60, 5.16, 0.81, 0.60 |
| Abstract SE ÷ Table 2 SE | derived | — | 1.43, 1.76, 1.15 (asymptomatic); 1.20, 1.24 (symptomatic): every abstract interval is wider |
Each set is internally consistent: every interval centres on its own point estimate. So the abstract values are not a body estimate printed with the wrong interval, or the reverse. The two sets are distinct estimates of what the paper presents as the same quantity.
Figure
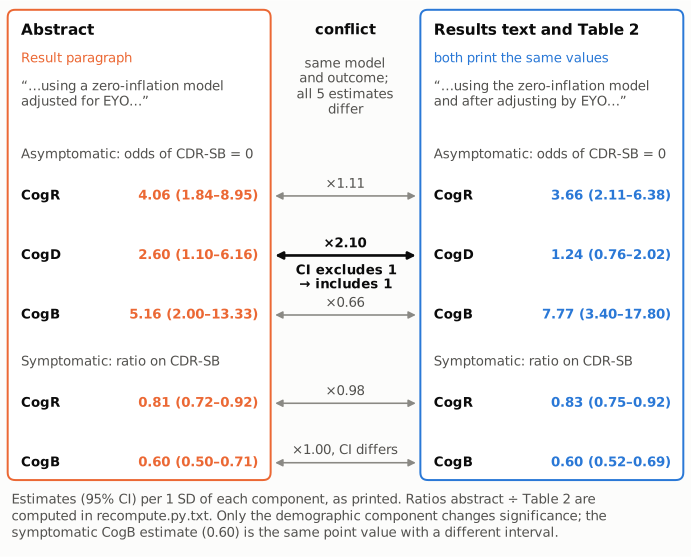
The left panel lists the abstract's five estimates (95% CI) and the right panel the matching values in the Results text and Table 2, which print identical numbers. Both panels quote the model description each source gives. Each connector gives the ratio of the abstract estimate to the Table 2 estimate, computed in recompute.py.txt. Only the demographic component (CogD) in asymptomatic carriers changes significance: its interval excludes 1 in the abstract and includes 1 in Table 2. The other four pairs differ in point estimate, in interval, or in both, but keep the same direction and significance.
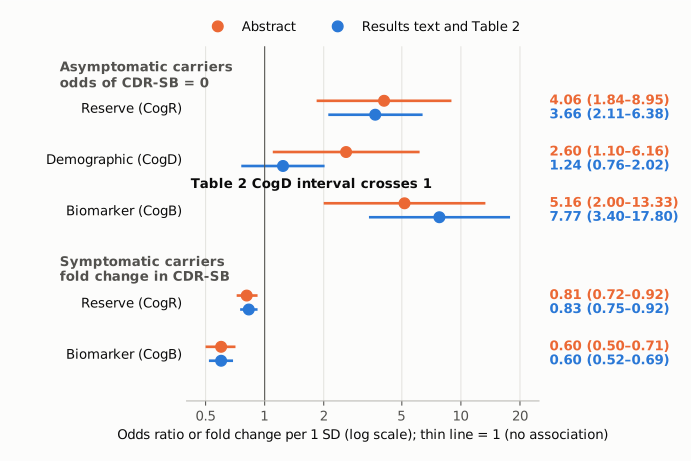
The same ten estimates on one logarithmic axis. Orange marks the abstract and blue the Results text and Table 2, each labelled with its printed value; the thin vertical line marks 1 (no association). The plot shows the sizes of the gaps that the text panels state as ratios. The biomarker odds ratio is a third lower in the abstract. The Table 2 interval for the demographic component crosses 1, while the abstract's does not.
Why it matters
The abstract is the part of the paper most readers see and the part that indexing services reproduce. In it, the demographic component (age, education, sex, race, socioeconomic status and vascular burden score, per the Methods) is presented as significantly associated with being clinically unimpaired at baseline: OR 2.60, 95% CI 1.10–6.16. The paper's own cross-sectional model gives 1.24 (0.76–2.02), an approximate p of 0.39, so the association the abstract reports is not supported by the paper's own analysis. The Discussion says that demographic factors "play a significant role in maintaining asymptomatic status". That sentence matches the abstract's figure. Among the paper's own results, it is supported only by the separate longitudinal estimate in Table 3 (1.52, 1.04–2.23; approximate p 0.031), not by the baseline Table 2 that the abstract describes.
The relative sizes of the components also change. In the abstract, the reserve odds ratio (4.06) is close to the biomarker odds ratio (5.16). In Table 2, the biomarker effect (7.77) is about twice the reserve effect (3.66). A reader comparing the protective weight of cognitive reserve with pathology burden would draw a different picture from each source.
What is not affected: the reserve component is significant in the same direction in every version (abstract 4.06, Table 2 3.66, Table 3 3.29), so the paper's central conclusion, that higher cognitive reserve goes with remaining unimpaired, does not depend on which set is correct. The two symptomatic-carrier estimates differ only slightly and stay significant.
Explanations considered
- Rounding or transcription of one digit. This does not explain the numbers. All five pairs differ, by up to 2.61 on the odds-ratio scale, and every interval in the abstract centres exactly on its own point estimate. A single mistyped value would leave the rest of the set unchanged and would usually break this internal consistency.
- A different reference EYO. Because the model contains component × EYO interactions, a component's odds ratio depends on the EYO at which it is evaluated. If the abstract used a different centring, one shift would have to convert all three Table 2 estimates to the abstract values. The printed interactions require +1.5 years for CogR, −73.7 years for CogD and −7.0 years for CogB. These shifts are incompatible with one another, and −73.7 years lies outside any plausible EYO range, so re-centring does not account for the gap.
- The abstract quotes the longitudinal model. It does not. Table 3 gives 3.29, 1.52 and 11.82 for asymptomatic carriers and 0.92 and 0.73 for symptomatic carriers; none equals an abstract value.
- Body and table disagree, so the abstract follows one of them. They do not disagree. The Results text cites Table 2 explicitly and prints the same five values, and the PMC HTML table shows the same rows. Misaligned cells, a missing minus sign or a lost superscript cannot apply: every value is a positive ratio, and the table and the prose agree.
- A conversion artefact in the archived text. This is ruled out. The quoted passages match the publisher-deposited JATS full text, read both as the live PMC page and as the Europe PMC XML.
- An earlier analysis. This is offered as context only and is not a conclusion about how the discrepancy arose. The abstract's estimates are identical, at the earlier abstract's printed precision, to those of a 2024 conference abstract on the same topic (Alzheimer's & Dementia 2024, doi:10.1002/alz.086295, PMC11710562). That abstract reports aMC n = 204 and sMC n = 115, against 284 and 155 here, and adjusts "by mutation mean AAO". Under simple 1/√n scaling, its standard errors would be about 1.18 and 1.16 times those of the larger sample. Every abstract interval is indeed wider than its Table 2 counterpart (1.15 to 1.76 times), which agrees with this, although it does not prove it. Whichever analysis produced them, the abstract's values are not the estimates that the paper's Results and Table 2 report for the 284/155-carrier sample.
Status
- Version of record. The publisher page and PDF on neurology.org returned HTTP 403 to automated access, and the PMC PDF could not be fetched headlessly. The quoted passages were therefore checked in the publisher-deposited JATS full text, read two ways: the live PMC HTML (pmc.ncbi.nlm.nih.gov/articles/PMC13067375/) and the Europe PMC fullTextXML. Both match the archived text used here exactly, and every quote above was re-checked against it by
recompute.py.txt. - Supplements. The Europe PMC supplementary-files bundle holds only the two figure images. The text cites eFigures 1–2 and eTable 1, but the publisher's supplement page returned 403. By their descriptions, these cover the tertile plots and the longitudinal CogR analyses, not the baseline zero-part estimates, so they would not decide which set is correct. Data are available on request; the paper states that the component-decomposition code is public.
- Corrections. Crossref lists no updates, and PMC and Europe PMC hold no correction, erratum, expression of concern or retraction notice for this DOI.
- PubPeer. Direct PubPeer search returned HTTP 403. A web search for the title together with PubPeer found no thread.
- Secondary coverage. A news summary of the paper (Neurology Advisor) quotes the body values (OR 3.66; 0.83).
- Sources: the PMC archive of PMC13067375; Crossref and PMC/Europe PMC notice checks for doi:10.1212/WNL.0000000000214804; Europe PMC full text of PMC11710562 (doi:10.1002/alz.086295). Status as of 2026-10-23.
Suggested correction
The authors should confirm which analysis is final and bring the abstract into line with it. If the Results text and Table 2 are correct, the abstract's Result paragraph should read:
… a 1 SD increase in the reserve component (CogR) was associated with a 3.66-fold increase in the odds of being clinically unimpaired (CDR-SB = 0; 95% CI 2.11–6.38). A 1 SD increase in the biomarker component (CogB) increased the odds of being CDR-SB = 0 by 7.77 (95% CI 3.40–17.80); the demographic component (CogD) was not significantly associated (1.24, 95% CI 0.76–2.02). … A 1 SD increase in CogR was associated with a 0.83-fold reduction in baseline CDR-SB score (95% CI 0.75–0.92), and a 1 SD increase in CogB was associated with a 0.60-fold reduction in CDR-SB (95% CI 0.52–0.69).
The Discussion sentence on demographic factors playing "a significant role in maintaining asymptomatic status" should then name the result that supports it, the longitudinal Table 3 estimate, or else be qualified. If instead the abstract's values are the intended ones, Table 2 and the Results text need correcting, along with an explanation of the sample and adjustment that produced them.