← Back to the plain-language case
Two pooled pericarditis hazard ratios in Table 2 fall outside their own cohort estimates
JAMA Cardiol (2026) · doi:10.1001/jamacardio.2026.0258 · PMC13000738
Summary
The letter pools two biobank cohorts by inverse-variance meta-analysis and reports pooled pericarditis hazard ratios (HRs) of 1.66 (95% CI, 1.17-2.35) for large CHIP and 1.88 (1.45-2.43) for DNMT3A CHIP. Neither value can come from the cohort rows printed above it in Table 2: any weighted average of the large-CHIP cohort HRs (2.15 and 1.71) must lie between 1.71 and 2.15, and any weighted average of the DNMT3A cohort HRs (1.70 and 1.63) cannot exceed 1.70. Pooling the table's own cohort rows gives 1.86 (1.43-2.42) for large CHIP and 1.66 (1.17-2.35) for DNMT3A, so the printed pooled rows match the recomputed values with the two exposures exchanged, and the myocarditis block shows the same pattern. Two interpretive sentences in the Results rest on the printed values. The main finding is not affected: the any-CHIP point estimate recomputes (HR 1.65), with a printed CI (1.29-2.10) slightly narrower than the recomputed one (1.28-2.12).
What the paper reports
Methods, second paragraph:
Inverse variance-weighted meta-analysis (using fixed-effects models when I2 < 25% and random-effects models otherwise) was performed.
Results, first paragraph:
Any CHIP was associated with 1.65-fold increased pericarditis risk (95% CI, 1.29-2.10; I2 = 0). Large CHIP (variant allele fraction ≥10%) had a similar point estimate (hazard ratio [HR], 1.66 [95% CI, 1.17-2.35]; I2 = 0). DNMT3A CHIP accounted for the association (HR, 1.88 [95% CI, 1.45-2.43]; I2 = 0), while TET2 CHIP showed a directionally concordant association (1.35 [0.76-2.40]).
Results, second paragraph (myocarditis):
Point estimates for any CHIP (HR, 1.29 [95% CI, 0.84-1.97]), large CHIP (HR, 1.53 [0.92-2.54]), and DNMT3A CHIP (HR, 1.30 [0.81-2.09]) were positive but not significant.
There was moderate heterogeneity between cohorts (I2 = 37.1%-68.2%).
Table 2, "Multivariable-Adjusted Associations of CHIP and Gene-Specific CHIP Subtypes With Myocarditis and Pericarditis After Meta-Analysis of the VUMC BioVU and NIH All of Us Cohorts". These are the rows at issue (participants | events | adjusted HR (95% CI) | P):
| Outcome, exposure | Row | Participants | Events | HR (95% CI) | P |
|---|---|---|---|---|---|
| Pericarditis, Large CHIP | All of Us cohort | 6989 | 23 | 2.15 (1.40-3.30) | <.001 |
| BioVU cohort | 7562 | 39 | 1.71 (1.23-2.38) | .001 | |
| Meta-analysis | 14 551 | 62 | 1.66 (1.17-2.35) | .004 | |
| Pericarditis, DNMT3A CHIP | All of Us cohort | 4835 | 13 | 1.70 (0.98-2.97) | .06 |
| BioVU cohort | 3754 | 20 | 1.63 (1.04-2.56) | .03 | |
| Meta | 8589 | 33 | 1.88 (1.45-2.43) | <.001 | |
| Myocarditis, Large CHIP | All of Us cohort | 7013 | 3 | 0.54 (0.17-1.68) | .28 |
| BioVU cohort | 7573 | 16 | 1.56 (0.93-2.61) | .09 | |
| Meta-analysis | 14 586 | 19 | 1.53 (0.92-2.54) | .10 | |
| Myocarditis, DNMT3A CHIP | All of Us cohort | 4839 | 4 | 1.02 (0.38-2.75) | .97 |
| BioVU cohort | 3756 | 10 | 1.87 (0.99-3.53) | .05 | |
| Meta-analysis | 8595 | 14 | 1.30 (0.81-2.09) | .28 |
Discussion, first paragraph:
We and [ref 2] found that DNMT3A—but not TET2—CHIP was associated with pericarditis, although this may simply reflect statistical power.
(Bracketed text replaces the cited study's author name.)
What the paper's own numbers show
Method. I applied the method stated in Methods to every block of Table 2. Each cohort's log HR was taken with a standard error recovered from its 95% CI, SE = [ln(upper) − ln(lower)] / (2 × 1.96). The two log HRs were pooled with inverse-variance weights, and I computed Cochran's Q and I². I used the fixed-effect result when I² < 25% and the DerSimonian-Laird random-effects result otherwise, as the paper specifies. There is also a check that needs no standard errors at all: a pooled estimate built from positive weights is a weighted average of the cohort log HRs, so it must lie between the two cohort HRs. This holds for fixed and random effects and for pooling on either the log or the HR scale. To test whether rounding to two decimals could matter, I varied every printed cohort HR and CI bound by ±0.005 (all 729 combinations of −0.005, 0 and +0.005, plus 20 000 random draws) in all eight blocks of Table 2, under both fixed and random effects. A printed two-decimal value is counted as fitting when its own rounding interval (±0.005) overlaps the recomputed range. Every number below is printed by recompute.py.txt.
| Quantity | Location | Reported | Recomputed from the paper's own rows |
|---|---|---|---|
| Range any weighted average can take, pericarditis, large CHIP | Table 2 cohort rows | 2.15 and 1.71 | must lie in [1.71, 2.15] |
| Pooled HR, pericarditis, large CHIP | Table 2; Results ¶1 | 1.66 (1.17-2.35), P = .004 | 1.86 (1.43-2.42), P = 3.2 × 10⁻⁶; Q = 0.69, I² = 0% (fixed and random effects identical) |
| Same, allowing for rounding of inputs | Table 2 | 1.66 | 1.854 to 1.870 |
| SE of pooled log HR, pericarditis, large CHIP | Table 2 | 0.178 (implied by printed CI) | 0.133; a pooled SE cannot exceed the smaller cohort SE (BioVU 0.168) when τ² = 0 |
| Range any weighted average can take, pericarditis, DNMT3A | Table 2 cohort rows | 1.70 and 1.63 | must lie in [1.63, 1.70] |
| Pooled HR, pericarditis, DNMT3A | Table 2; Results ¶1 | 1.88 (1.45-2.43), P < .001 | 1.66 (1.17-2.35), P = .0046; Q = 0.01, I² = 0% |
| Same, allowing for rounding of inputs | Table 2 | 1.88 | 1.652 to 1.663 |
| SE of pooled log HR, pericarditis, DNMT3A | Table 2 | 0.132 (implied by printed CI) | 0.178 |
| Participant and event totals, large CHIP pericarditis | Table 2 | 14 551; 62 | 6989 + 7562 = 14 551; 23 + 39 = 62 (agree) |
| Participant and event totals, DNMT3A pericarditis | Table 2 | 8589; 33 | 4835 + 3754 = 8589; 13 + 20 = 33 (agree) |
| Pooled HR, myocarditis, large CHIP | Table 2; Results ¶2 | 1.53 (0.92-2.54), P = .10 | fixed effect 1.30 (0.81-2.09), P = .27; I² = 63.5% (61.6% to 65.2% under rounding), so the stated rule gives random effects 1.04 (0.38-2.86), P = .93 |
| Pooled HR, myocarditis, DNMT3A | Table 2; Results ¶2 | 1.30 (0.81-2.09), P = .28 | 1.57 (0.92-2.67), P = .10; I² = 2.0% |
The other four pooled rows. Re-pooled the same way, the two any-CHIP rows and the pericarditis TET2 row come close to the printed values, and the myocarditis TET2 row does not. Under the rounding test, none of the four is reproduced exactly:
| Pooled row (Table 2) | Reported | Recomputed (rule-chosen model) | Range allowing rounding of inputs | Assessment |
|---|---|---|---|---|
| Pericarditis, any CHIP | 1.65 (1.29-2.10) | 1.65 (1.28-2.12), fixed effect, I² = 0% | HR 1.639-1.651; lower 1.269-1.282; upper 2.110-2.134 | HR fits. Printed CI lies inside every recomputed CI: implied SE 0.124 (0.123-0.126) vs 0.129-0.131 recomputed |
| Pericarditis, TET2 | 1.35 (0.76-2.40), P = .31 | 1.38 (0.78-2.44), P = .27, fixed effect, I² = 0% | HR 1.371-1.387; lower 0.773-0.784; upper 2.426-2.463 | Close (1.38 vs 1.35), just outside the rounding range 1.37-1.39; CI width fits (SE 0.293 vs 0.290-0.294) |
| Myocarditis, any CHIP | 1.29 (0.84-1.97), P = .24 | 1.32 (0.86-2.01), P = .20, fixed effect, I² = 11.7% (7.0%-16.2%) | HR 1.307-1.326; lower 0.857-0.871; upper 1.990-2.021 | Close (1.32 vs 1.29), just outside the rounding range 1.31-1.33; the lower bound 0.84 is also outside 0.86-0.87 |
| Myocarditis, TET2 | 0.69 (0.21-2.26), P = .54 | 0.90 (0.29-2.82), P = .86, fixed effect, I² = 13.8% (8.0%-19.0%) | Fixed effect HR 0.880-0.925; random effects 0.848-0.904 | Not reproducible (0.88-0.93 under rounding), but 0.69 lies between the cohort HRs 0.37 and 1.40, so it is not an impossible value |
So the printed pooled rows are not, in general, an exact inverse-variance pool of the printed cohort rows, and differences of about 0.01 to 0.03 on the log scale appear even in rows with no other problem (any CHIP and TET2 for pericarditis, any CHIP for myocarditis). The large-CHIP and DNMT3A pericarditis rows differ by 0.115 and 0.126 in the HR alone and, unlike those rows, lie outside the range of their own cohort HRs. Myocarditis TET2 is a separate case: its printed HR is 0.268 on the log scale from the recomputed value, which is more than the large-CHIP and DNMT3A myocarditis rows (0.160 and 0.187). Both cohort CIs in that block are close to symmetric on the log scale (1.386 vs 1.397, and 2.001 vs 1.961), as Wald intervals are, so recovering SEs from the CIs does not explain the gap. The block has only 3 events (2 and 1), and I treat it as a side observation, not as part of the main finding.
The exchange pattern. The recomputed DNMT3A pericarditis pool, 1.66 (1.17-2.35) with P = .0046, reproduces the printed large-CHIP row, 1.66 (1.17-2.35) with P = .004. The largest log difference across HR and both bounds is 0.002, and all three printed values fall within the recomputed rounding ranges (HR 1.652-1.663, lower 1.162-1.175, upper 2.338-2.364). The recomputed large-CHIP pool, 1.86 (1.43-2.42), is within 0.011 on the log scale of the printed DNMT3A row, 1.88 (1.45-2.43), a gap similar in size to those in the any-CHIP and pericarditis TET2 rows. By contrast, each printed row differs from its own recomputed pool by 0.115 (large CHIP) and 0.126 (DNMT3A) on the log scale. Myocarditis shows the same pattern. The fixed-effect pool of the large-CHIP myocarditis cohorts, 1.30 (0.81-2.09), matches the printed DNMT3A row to two decimals (HR and both CI bounds; largest log difference 0.006; P = .27 recomputed vs .28 printed), and the DNMT3A pool, 1.57 (0.92-2.67) with P = .10, is close to the printed large-CHIP row, 1.53 (0.92-2.54) with P = .10 (largest log difference 0.052). In both outcome blocks the participant and event totals in the pooled rows agree with their own cohort rows. Only the HR, CI and P cells of the large-CHIP and DNMT3A pooled rows look exchanged. This is an inference from the numbers and has not been confirmed by the authors.
On its own, each printed myocarditis value is possible: 1.53 lies between 0.54 and 1.56, and 1.30 between 1.02 and 1.87. So the myocarditis evidence rests on the match with the exchanged values, not on an impossible value. Because the myocarditis TET2 row shows that a printed myocarditis pool can differ from re-pooling by more than these rows do, the myocarditis part of the finding is weaker than the pericarditis part.
Figure
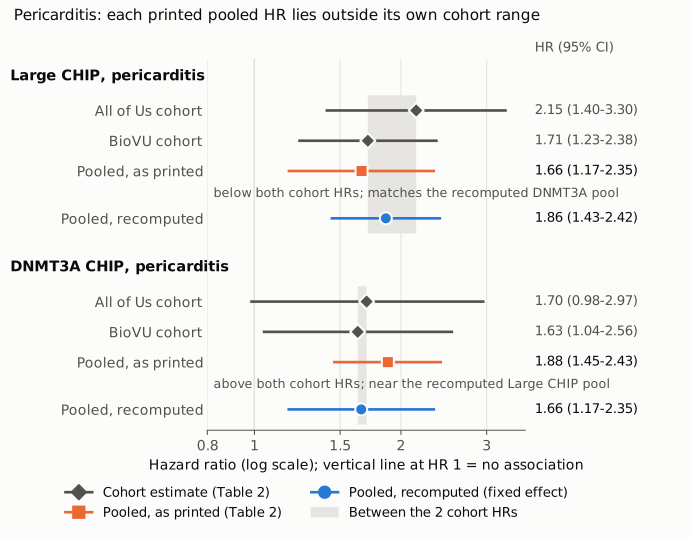
Figure 1. Pericarditis rows of Table 2 for large CHIP (top) and DNMT3A CHIP (bottom), on one log-scale HR axis. Grey diamonds with lines are the two cohort estimates and 95% CIs as printed. Orange squares are the pooled meta-analysis rows as printed. Blue circles are the fixed-effect inverse-variance pools recomputed by recompute.py.txt from the two cohort rows directly above them (I² = 0% in both blocks, so random effects give the same values). The shaded band marks the interval between the two cohort point estimates, where any weighted average has to fall. Both printed pooled values lie outside their band, one below it and one above. Each printed value sits at, or close to, the recomputed value of the other exposure. The thin vertical line marks HR = 1.
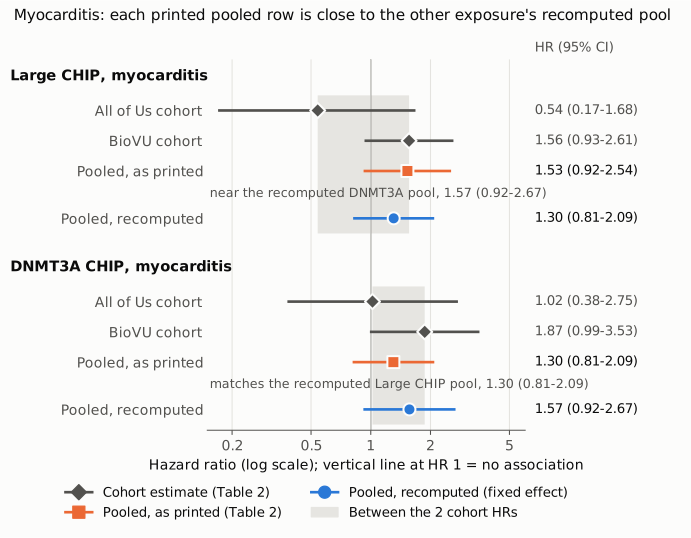
Figure 2. The same layout for the myocarditis rows of Table 2. In both blocks the printed values lie inside the band, but the printed DNMT3A pool matches the recomputed fixed-effect large-CHIP pool to two decimals, and the printed large-CHIP pool is close to the recomputed DNMT3A pool. For large CHIP the recomputed I² is 63.5%, so under the paper's stated rule the random-effects estimate, 1.04 (0.38-2.86), would apply. The figure shows the fixed-effect value because that is the one matching a printed row.
Why it matters
- Two interpretive claims rest on the printed values. The Results say large CHIP "had a similar point estimate" to any CHIP (1.66 vs 1.65). Recomputed from the cohort rows, large CHIP is 1.86 (1.43-2.42) against 1.65 for any CHIP. The Results also say "DNMT3A CHIP accounted for the association" with HR 1.88. Recomputed, DNMT3A is 1.66 (1.17-2.35), essentially equal to any CHIP (1.65) rather than above it.
- The stated significance of each estimate changes in degree, not in direction. Recomputed, large CHIP is more significant than printed (P ≈ 3 × 10⁻⁶ rather than .004) and DNMT3A less so (P ≈ .005 rather than < .001). Both stay below .05, so the Discussion's statement that DNMT3A, but not TET2, CHIP was associated with pericarditis still holds.
- The main conclusion is unaffected. The any-CHIP pericarditis point estimate (1.65) recomputes from its cohort rows; the printed CI (1.29-2.10) is slightly narrower than the recomputed 1.28-2.12, which does not change the conclusion. The letter's conclusion that CHIP is a reproducible risk factor for pericarditis does not depend on the exchanged rows, and neither does its title. The letter has no structured abstract or key points that repeat the values.
- These rows are the ones later syntheses would extract. The letter is framed as a replication of a UK Biobank analysis, and its large-CHIP and gene-specific pooled estimates are the figures a comparison or a later meta-analysis would take from it.
Explanations considered
- Rounding of the printed inputs. Does not account for it. Varying every HR and CI bound by ±0.005 moves the large-CHIP pericarditis pool only between 1.854 and 1.870, and the DNMT3A pool only between 1.652 and 1.663. Rounding cannot bring the smaller large-CHIP cohort HR below 1.705 or the larger DNMT3A cohort HR above 1.705. Neither 1.66 nor 1.88 can be reached.
- Random effects instead of fixed effects. Does not account for it. Q is 0.69 and 0.01, so I² = 0 and τ² = 0, and the random-effects pool equals the fixed-effect pool. The paper itself prints I² = 0 for both. In any case a random-effects estimate is still a positively weighted average and must lie between the cohort HRs.
- Different weights or scale (for example, weighting by sample size or events, or averaging HRs rather than log HRs). Does not account for it. Any positively weighted average of 2.15 and 1.71 lies between them, and the same holds for 1.70 and 1.63.
- A one-stage pooled model on individual-level data rather than inverse-variance pooling. Not supported by the paper. Methods specify inverse variance-weighted meta-analysis, and the Results report I² for the pooled estimates, which belongs to a two-stage analysis. It would also not explain why each printed value matches the pool of the other exposure so closely.
- The authors' pooling differs slightly from re-pooling the rounded table values. This is likely, and it accounts for the small gaps in the any-CHIP and TET2 rows (see above): the authors would have pooled unrounded log HRs and SEs, possibly from different software defaults. It cannot account for the two pericarditis rows. Whatever the inputs, SEs or between-study variance, an inverse-variance pool (fixed or random effects) gives each cohort a positive weight, so the pooled HR is a weighted average of the cohort HRs and must lie between them. The printed cohort HRs, even allowing for rounding, bound the large-CHIP pool below by 1.705 and the DNMT3A pool above by 1.705, so 1.66 and 1.88 cannot come from them.
- The cohort rows, not the pooled rows, are wrong. Cannot be excluded from the published text alone. Two points favour an exchange in the pooled rows: the printed pooled values reproduce the recomputed pools of the other exposure to within 0.002 to 0.011 on the log scale, and the cohort rows and pooled totals agree with each other in every block. Only the authors' unrounded cohort estimates can settle it.
- A conversion or typesetting artifact in the archive. Ruled out. The publisher's full text (jamanetwork.com, reached through the DOI) and the PMC archive carry the same numbers cell for cell, and the Results text repeats the same values as the table. There are no minus signs, superscripts or merged cells involved.
- A correction already issued. None found (see Status).
- Side observation, not part of the main finding. The Results report myocarditis heterogeneity of "I2 = 37.1%-68.2%". From the printed rows, the four myocarditis I² values are 11.7%, 63.5%, 2.0% and 13.8%, and only large CHIP exceeds 25%. With two cohorts and rounded inputs I² is imprecise, so I do not treat this as an error, but the authors may wish to check it alongside the pooled rows.
- Side observation: myocarditis TET2. The printed pool, 0.69 (0.21-2.26), cannot be reproduced from its cohort rows, 1.40 (0.35-5.66) and 0.37 (0.05-2.63): re-pooling gives 0.90 (0.29-2.82), and 0.88 to 0.93 allowing for rounding (0.85 to 0.90 under random effects). The value lies within the cohort range, so it is not impossible, and with only 3 events a different estimation approach for this block cannot be excluded. I do not count it as an error.
Status
- Version of record. On 2026-10-24 I checked the publisher's full text at https://jamanetwork.com/journals/jamacardiology/fullarticle/2846692, reached through the DOI. Its Results sentences and the Table 2 rows for large CHIP and DNMT3A CHIP, under both outcomes, are identical to the PMC archive. Europe PMC's full-text XML for this article agrees as well. I checked every quotation above verbatim against the PMC-archived text with
src/show.py. - Supplements. The article has one supplement,
jamacardiol-e260258-s001.pdf(file name as distributed by PMC/Europe PMC), a one-page Data Sharing Statement. It contains no extra tables, forest plots or cohort-level estimates. Individual-level data are available only under BioVU and All of Us data access agreements. - Corrections and comments. As of 2026-10-24 I found no correction, erratum, retraction or expression of concern.
src/known.pyreturns no Crossref update relations, no PMC notices and no Europe PMC notices. The Europe PMC record (PMID 41848713) lists no comments or corrections, and the publisher page links no correction notice. PubPeer's search page returned HTTP 403 and its API asked for human verification, so I could not query it directly. A web search for the title together with "PubPeer" found no thread for this article. - Sources. PMC article PMC13000738; https://doi.org/10.1001/jamacardio.2026.0258 (publisher full text); Europe PMC full-text XML and supplementary files; Crossref; Europe PMC; PubPeer; web search.
Suggested correction
In Table 2, replace the pooled (meta-analysis) rows for large CHIP and DNMT3A CHIP, under both pericarditis and myocarditis, with values recomputed from the cohort-level estimates using the stated inverse-variance method. From the rounded table values these are approximately:
| Outcome, exposure | Printed | Recomputed from Table 2 cohort rows |
|---|---|---|
| Pericarditis, large CHIP | 1.66 (1.17-2.35), P = .004 | 1.86 (1.43-2.42), P < .001 |
| Pericarditis, DNMT3A CHIP | 1.88 (1.45-2.43), P < .001 | 1.66 (1.17-2.35), P = .005 |
| Myocarditis, large CHIP | 1.53 (0.92-2.54), P = .10 | fixed effect 1.30 (0.81-2.09), P = .27; or, since I² ≈ 64%, random effects 1.04 (0.38-2.86), P = .93 |
| Myocarditis, DNMT3A CHIP | 1.30 (0.81-2.09), P = .28 | 1.57 (0.92-2.67), P = .10 |
The authors should confirm these values from the unrounded cohort estimates. In the Results, the first paragraph would then read approximately:
Large CHIP (variant allele fraction ≥10%) had a higher point estimate (HR, 1.86 [95% CI, 1.43-2.42]; I2 = 0). DNMT3A CHIP was also associated with pericarditis (HR, 1.66 [95% CI, 1.17-2.35]; I2 = 0)
The myocarditis sentence would be updated in the same way. The authors may also wish to say which model (fixed or random effects) was applied to the large-CHIP myocarditis rows, given an I² of about 64%, and to check the reported myocarditis I² range.