← Back to the plain-language case
Abstract's adjusted odds ratios for education and prenatal care differ from the paper's own Results
Lancet Reg Health Am (2026) · doi:10.1016/j.lana.2026.101434 · PMC12995907
Summary
The Abstract reports that higher maternal education (aOR 2·41, 95% CI 2·35–2·48) and receipt of prenatal care (aOR 2·64, 95% CI 2·56–2·73) were associated with documented adequate partner treatment. The paper's national multivariable model, given in the Results text and in Fig. 2, has different values for the same two associations: 1·48 (1·39–1·59) for higher vs primary education and 3·05 (2·92–3·20) for prenatal care. In both cases the two intervals do not overlap. The race estimates in the same Abstract sentence match the Results exactly. Neither Abstract value appears anywhere else in the paper, and the Abstract's education interval is too narrow to be possible for a higher-vs-primary contrast given the Table 1 counts. Both associations keep their direction and statistical significance, but the Abstract overstates the education association, understates the prenatal-care association, and presents the two as about equal, while the Results show prenatal care as much the stronger of the two.
What the paper reports
Abstract, Findings:
Higher maternal education (aOR 2·41, 95% CI 2·35–2·48) and receipt of prenatal care (aOR 2·64, 95% CI 2·56–2·73) were associated with partner treatment, whereas odds were lower among Black (aOR 0·85, 95% CI 0·82–0·89) and Mixed women (aOR 0·81, 95% CI 0·79–0·84) and in the North region.
Abstract, Methods:
Multivariable logistic regression estimated adjusted odds ratios (aORs) and 95% CIs.
Results, paragraph on the national multivariable model:
Multivariable analysis included 214,259 participants, with 4069 exclusions due to missing maternal age. Prenatal care was the factor most strongly associated with adequate partner treatment (adjusted odds ratio [aOR] 3·05, 95% CI 2·92–3·20; p < 0·001).
Higher maternal education remained positively associated with partner treatment (higher vs primary: aOR 1·48, 1·39–1·59; secondary vs primary: aOR 1·23, 1·20–1·27; both p < 0·001)
Compared with White women, lower odds persisted among Black (aOR 0·85, 0·82–0·89; p < 0·001) and Mixed women (aOR 0·81, 0·79–0·84; p < 0·001)
Fig. 2 caption:
Unadjusted ORs are from separate univariable logistic regression models; aORs are from the multivariable logistic regression model including maternal age, race, education, prenatal care, and macro-region.
Fig. 2 itself is an image. Read from the figure file (gr2.jpg): pre-natal care "Yes", unadjusted 3·33 (3·22 – 3·46) and adjusted 3·05 (2·92 – 3·20); "Higher education", unadjusted 1·85 (1·73 – 1·97) and adjusted 1·48 (1·39 – 1·59). Fig. 3 (gr3.jpg), the region-stratified models, gives prenatal care "Yes" aORs of 2·11, 2·58, 3·70, 4·50 and 4·87 and higher-education aORs of 1·39, 1·72, 1·48, 1·38 and 1·41 (North, Northeast, Central-West, Southeast, South).
Discussion, second paragraph:
Prenatal care emerged as the strongest predictor of partner treatment, with approximately threefold higher odds compared with women without prenatal follow-up.
Table 1 (columns: all cases, n = 218,328 | adequate partner treatment, n = 50,609 | no adequate partner treatment, n = 167,719 | p-value), education and prenatal-care rows:
Primary | 94,267 (43·2%) | 19,367 (38·3%) | 74,900 (44·7%) | <0·001
Higher | 4427 (2·03%) | 1431 (2·83%) | 2996 (1·79%) | <0·001
No | 32,162 (14·7%) | 2627 (5·2%) | 29,535 (17·6%) | <0·001
Yes | 180,009 (82·4%) | 46,943 (92·8%) | 133,066 (79·3%) | <0·001
What the paper's own numbers show
Method. I compared each Abstract estimate with every other estimate of the same association in the paper: the Results text, Fig. 2 (adjusted and unadjusted) and Fig. 3 (five regional models). From the Table 1 counts I computed crude odds ratios with Woolf 95% CIs. From each printed 95% CI I recovered the implied standard error of the log odds ratio, SE = ln(upper/lower)/(2 × 1·96), together with the largest SE the two-decimal rounding allows. I then compared those SEs with a lower bound that holds for any maximum-likelihood logistic model fitted to these cases with model-based standard errors. When the model contains the levels of a categorical variable, the fitted probabilities within each level sum to the observed number of events in that level. As a result, the variance of the log odds ratio between two levels can be no smaller than the crude Woolf variance 1/a + 1/b + 1/c + 1/d computed from the level counts, whatever other covariates are in the model. Any subset of the cases, such as the n = 214,259 model sample or a single region, has smaller counts, so the bound only increases. Finally I searched every merge of levels of the model variables in Table 1 for a crude OR near 2·41 or 2·64. Every number below is printed by recompute.py.txt.
| Quantity | Location | Reported | Recomputed from the paper's numbers |
|---|---|---|---|
| Higher education, adjusted | Abstract | 2·41 (2·35–2·48) | Appears nowhere else in the paper |
| Higher vs primary education, adjusted | Results text; Fig. 2 | 1·48 (1·39–1·59) | Does not overlap the Abstract interval; the Abstract OR is 1·63 times larger (2·24 times on the log scale) |
| Higher vs primary education, crude | Fig. 2 (unadjusted); Table 1 counts | 1·85 (1·73–1·97) | 1·85 (1·73–1·97) from 1431/2996 vs 19,367/74,900, matching Fig. 2, so the Abstract value is not the crude OR either |
| SE(log OR) implied by the education interval | Abstract | 2·35–2·48 | 0·0137 (at most 0·0148 allowing for rounding) |
| SE(log OR) implied by the education interval | Results; Fig. 2 | 1·39–1·59 | 0·0343 |
| Smallest SE(log OR) possible for higher vs primary | Table 1 counts | — | 0·0331. The Abstract interval is 0·41 times this. Even counting only the 1431 treated women with higher education, SE ≥ 0·0264; the Abstract interval would need at least 4570 such women |
| Prenatal care, adjusted | Abstract | 2·64 (2·56–2·73) | Appears nowhere else in the paper |
| Prenatal care yes vs no, adjusted | Results text; Fig. 2 | 3·05 (2·92–3·20) | Does not overlap the Abstract interval; the Abstract OR is 0·87 times the Results value |
| Prenatal care yes vs no, crude | Table 1 counts | — | 3·97 (3·81–4·13) |
| SE(log OR) implied by the prenatal interval | Abstract | 2·56–2·73 | 0·0164 (at most 0·0174 allowing for rounding) |
| SE(log OR) implied by the prenatal interval | Results; Fig. 2 | 2·92–3·20 | 0·0234 |
| Smallest SE(log OR) possible for prenatal yes vs no | Table 1 counts | — | 0·0211. The Abstract interval is 0·78 times this. Even pooling "Ignored/Unknown" with "No", the bound is 0·0182 |
| Regional aORs, prenatal care | Fig. 3 | 2·11, 2·58, 3·70, 4·50, 4·87 | None is 2·64. The closest, Northeast 2·58 (2·37–2·80), has SE 0·0425, about 2.6 times the Abstract's |
| Regional aORs, higher education | Fig. 3 | 1·39, 1·72, 1·48, 1·38, 1·41 | None is near 2·41 |
| Black and Mixed vs White, adjusted | Abstract vs Results | 0·85 (0·82–0·89) and 0·81 (0·79–0·84) in both | Identical, so the Abstract sentence uses the national model for race |
| Relative strength, log OR of prenatal care ÷ log OR of higher education | Abstract vs Results | 2·64 vs 2·41; 3·05 vs 1·48 | 1·10 in the Abstract, 2·84 in the Results |
| Crude OR near 2·41 or 2·64 from any merge of levels | Table 1 (race, region, education, prenatal care) | — | None within 0·06 |
Table 1 is internally consistent: every variable sums to 50,609 treated and 167,719 untreated cases. The Results and Fig. 2 intervals are compatible with the bound (1·04 and 1·11 times it), as they should be. The Abstract intervals are not.
One smaller observation is separate from the claim. The Fig. 2 unadjusted OR for prenatal care "Yes", 3·33 (3·22–3·46), is not the Table 1 crude OR for yes vs no (3·97). It is reproduced exactly by yes vs "No" and "Ignored/Unknown" pooled: 3·33 (3·22–3·46). The "Ignored/Unknown" row in Fig. 2, 2·28 (2·11–2·47), is reproduced by ignored vs no alone. This suggests that the unadjusted "Yes" estimate may use a different reference group from the rest of the block. It does not affect the adjusted estimates.
Figure
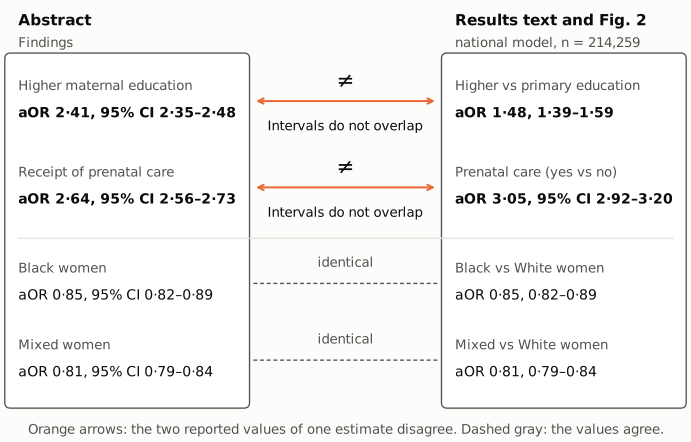
Figure 1. Short excerpts from the Abstract (Findings, left) and from the Results text, whose values Fig. 2 repeats (right), for the four associations the Abstract quantifies. Orange arrows join two reported values of the same association that disagree: higher education 2·41 (2·35–2·48) vs 1·48 (1·39–1·59), and prenatal care 2·64 (2·56–2·73) vs 3·05 (2·92–3·20). In each case the intervals do not overlap. Dashed gray lines join values that are identical: Black women 0·85 (0·82–0·89) and Mixed women 0·81 (0·79–0·84). The excerpts are shortened; the full sentences are quoted above.
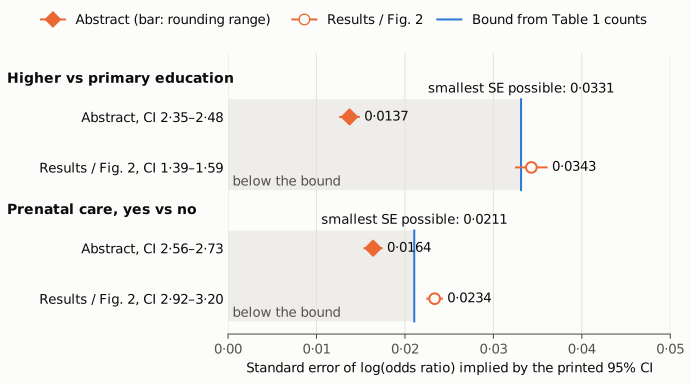
Figure 2. The standard error of the log odds ratio implied by each printed 95% CI, for higher vs primary education (top) and prenatal care yes vs no (bottom), on one linear axis that starts at zero. Orange diamonds are the Abstract intervals and hollow orange circles the Results / Fig. 2 intervals. The short orange bars show the range of SEs consistent with two-decimal rounding of the printed limits. The blue line in each group is the smallest SE any logistic model fitted to these cases can have, computed from the Table 1 counts (0·0331 and 0·0211). The shaded area to its left is unattainable. Both Results intervals lie just above the bound, and both Abstract intervals lie inside the unattainable area, the education interval at less than half the bound.
Why it matters
The Abstract is the most-read part of the paper and the only place, apart from the Results text and figures, where the paper puts numbers on its main associations. The title, the Research in context panel and the Conclusions describe these associations without numbers. In the Abstract:
- The education association is overstated. 2·41 is 63% larger than the Results' 1·48, and 2·24 times larger on the log-odds scale. The Abstract's interval (2·35–2·48) also suggests a precision that the 4427 women with higher education cannot provide.
- The prenatal-care association is understated. 2·64 is 13% smaller than 3·05. The Discussion's statement of "approximately threefold higher odds" matches the Results, not the Abstract.
- The relative ranking is altered. The Abstract presents education and prenatal care as roughly equal (log-OR ratio 1·10). In the Results, prenatal care is the strongest predictor, with a log OR 2·84 times that of higher education. The Discussion states that "public health prioritization should be guided primarily by effect size", so the size and ranking of these two associations are what a reader would act on.
The direction and statistical significance of both associations are the same in the Abstract and the Results. So are the paper's qualitative conclusions: partner treatment is low, it is more likely with prenatal care and higher education, and it is less likely among Black and Mixed women. The race estimates in the Abstract are correct. The error is in the reported size of two of the four quantified associations in the Abstract.
Explanations considered
- Rounding or typesetting of the same estimate. This does not account for the numbers. The intervals do not overlap for either association, and the differences (2·41 vs 1·48; 2·64 vs 3·05) are far larger than rounding. The publisher-supplied full text archived in PMC and Europe PMC has the same values, so a conversion artifact is excluded.
- The Abstract gives unadjusted odds ratios. This does not account for the numbers. The unadjusted ORs are 1·85 for higher education (Fig. 2 and Table 1) and 3·33 (Fig. 2) or 3·97 (Table 1) for prenatal care. The Abstract also labels its values "aOR".
- The Abstract gives a regional estimate. This does not account for the numbers. None of the five regional aORs in Fig. 3 equals 2·41 or 2·64, and every regional interval is far wider than the Abstract's. The SE bound also applies to any region, since each is a subset of the cases.
- The Abstract uses a different contrast, such as secondary-or-higher vs primary education. The paper does not describe one. An interval as narrow as 2·35–2·48 is possible only for a contrast between large groups, such as secondary vs primary (bound 0·0119). The paper reports that contrast as 1·23 (1·20–1·27), and the crude OR for secondary-or-higher vs primary is 1·47. For prenatal care, even pooling "Ignored/Unknown" with "No" gives a bound (0·0182) above the Abstract's largest possible SE (0·0174). Among the model variables in Table 1, no merge of levels gives a crude OR within 0·06 of either value. Arbitrary merges of the timing-of-diagnosis variable, which is not in the model, come within 0·06. All of them have SE of at least 0·0189, so they cannot produce the Abstract intervals either.
- The Abstract comes from a different model or an earlier version of the analysis. The paper gives no information on this, so it cannot be checked. Any logistic model fitted to these 218,328 cases, or to a subset of them, with model-based standard errors is excluded by the SE bound for the education interval, and also for the prenatal interval. A model fitted to a larger set of cases is not excluded by the bound. Such a model would have to count more women with documented partner treatment than the 50,609 in Table 1 (for example, at least 4570 treated women with higher education rather than 1431). The paper's outcome excludes the 78,734 records with missing partner-treatment status. The paper does not state how its CIs were computed. Robust (sandwich) standard errors are not mentioned, and the Results intervals are consistent with model-based ones.
- The Abstract values are correct and the Results and Fig. 2 are wrong. This is unlikely. Fig. 2, the Results text and the Discussion agree with each other. The Results and Fig. 2 intervals are compatible with the Table 1 counts, and the Abstract's education interval is not.
Status
- Version of record. The publisher's own pages could not be read: doi.org redirected to linkinghub.elsevier.com, which returned only a redirect stub, and thelancet.com and sciencedirect.com returned HTTP 403. The same text was checked in three archived copies of the publisher's full text: the PMC article page, the Europe PMC full-text XML (publisher-supplied JATS), and the local PMC archive. All three carry the Abstract values 2·41 (2·35–2·48) and 2·64 (2·56–2·73) and the Results values 3·05 (2·92–3·20) and 1·48 (1·39–1·59). In the text, 2·41 and 2·64 occur only in the Abstract. Every quote above was checked verbatim against the PMC-archived text, except the figure values, which were read from the figure images.
- Figures and supplements. I read the figure images Fig. 2 (gr2.jpg) and Fig. 3 (gr3.jpg) from the Europe PMC supplementary-files bundle. Neither contains 2·41 (2·35–2·48) or 2·64 (2·56–2·73). The only supplement, mmc1.pdf, holds Supplementary Table 1 (variable definitions and SINAN field codes) and Supplementary Table 2 (included vs excluded cases), with no regression output; it does not resolve the discrepancy. No code or analysis dataset is deposited. The data are public SINAN/SINASC records, but refitting the model was out of scope.
- Corrections and comments. As of 2026-10-23 I found no correction, erratum, retraction or expression of concern. Crossref lists no update relations for the DOI (update-to and updated-by absent, relation empty). PMC and Europe PMC list no correction or comment links (PMID 41858869), and the PMC page carries only the standard editorial note on maps and affiliations. The PubPeer API was blocked by an automated-access challenge, so PubPeer could not be checked directly; a web search for the title together with correction, erratum or PubPeer found nothing.
- Sources. PMC article PMC12995907; Europe PMC full-text XML and supplementary files (gr2.jpg, gr3.jpg, mmc1.pdf); Crossref API; Europe PMC search; PubPeer; general web search.
Suggested correction
- Replace the Abstract's education and prenatal-care estimates with the values from the national multivariable model, stating the education contrast explicitly. For example: "Higher maternal education (higher vs primary: aOR 1·48, 95% CI 1·39–1·59) and receipt of prenatal care (aOR 3·05, 95% CI 2·92–3·20) were associated with partner treatment".
- If 2·41 (2·35–2·48) and 2·64 (2·56–2·73) come from another analysis, identify that analysis (model, sample, contrast and CI method) in the Methods and Results, and explain why the Abstract reports it instead of the main model.
- Minor, separate: check the reference group of the Fig. 2 unadjusted OR for prenatal care "Yes" (3·33), which matches yes vs "No" and "Ignored/Unknown" pooled rather than yes vs no (3·97), and state the reference in the figure if it differs from the adjusted estimate's.