← Back to the plain-language case
Cohort 2 is reported as 361,258 participants in Table 2 but 32,220 in the flowchart
Psychol Med (2026) · doi:10.1017/S0033291726103328 · PMC12902173
Summary
The paper analyses two matched cohorts from Taiwan's one-million-person Longitudinal Health Insurance Database (LHID): psychological distress (PD, meaning depression or anxiety) followed for incident IBS (Cohort 1), and IBS followed for incident PD (Cohort 2). For Cohort 2, the Results text and Table 2 describe 361,258 participants (180,629 per arm), while the sample-selection flowchart (Figure 1) gives a final follow-up N of 32,220 (16,110 per arm), 11.2 times smaller. The paper's own follow-up event percentages (2,031 = 12.6% and 1,308 = 8.1%) fit only the flowchart's 16,110 per arm, and the width of the headline hazard-ratio interval fits the roughly 3,300 events in that smaller sample. Table 2 therefore cannot describe the cohort that was analysed. It also reports 45.77% of the IBS arm "With PD" at baseline in a cohort defined by excluding prior PD. Cohort 1 shows the same pattern (Table 1: 234,361 per arm; flowchart: 18,402 per arm).
What the paper reports
Results, "Baseline characteristics: Cohort 2 (IBS predicting psychological distress)":
Table 2 summarizes the baseline characteristics of 361,258 participants, divided evenly into IBS (n = 180,629) and non-IBS controls (n = 180,629).
Table 2, column headers and the first block (rows "Without PD" and "With PD"):
Variable | IBS(n = 180,629) | Without IBS(n = 180,629) | p-value
Without PD | 97,948 (54.23%) | 148,971 (82.47%) |
With PD | 82,681 (45.77%) | 31,658 (17.53%) |
Results, the same section, "Psychological distress outcomes":
The prevalence of psychological distress was substantially higher among individuals with IBS (45.77%) compared with controls (17.53%, p < .001).
Methods, "Cohort 2: IBS predicting psychological distress", on the definition of the cohort:
Those with any depressive or anxiety disorder before the index date were excluded to ensure incident outcome assessment.
A consolidated flowchart including all exclusions (prior IBS, prior psychological distress, and missing data) and final analytic sample sizes is shown in Figure 1.
Figure 1 flowchart, Cohort 2 (list items, rendered as text in PMC and in the publisher's HTML):
Newly diagnosed IBS cases (2002–2012): 16,110
Excluded prior depressive or anxiety disorders: 3,231 excluded
IBS cohort: 16,110
Matched controls: 16,110 Final follow-up N for PD outcomes: 32,220
Results, "Cohort 2: IBS predicting incident depression or anxiety":
In the reverse analysis, during a mean follow-up of 6.9 years, 2,031 IBS patients (12.6%) developed either depression or anxiety, compared to 1,308 (8.1%) in the control group.
Cohort 1 has the same kind of discrepancy. Results, "Baseline characteristics: Cohort 1":
A total of 468,722 participants were included, with 234,361 individuals in each group after matching.
Figure 1 flowchart, Cohort 1:
Newly diagnosed depressive/anxiety disorders (2002–2012): 18,402
Psychological distress group: 18,402
Matched controls: 18,402 Final follow-up N for IBS outcome: 36,804
Results, Cohort 1 follow-up, and the Cohort 1 baseline IBS prevalence:
During a mean follow-up period of 7.3 years, 1,498 individuals (8.1%) in the psychological distress group developed IBS, compared to 921 (5.0%) in the control group.
The prevalence of IBS at baseline was significantly higher in the psychological distress group compared to controls (32.11% vs. 12.04%, p < .001)
The Cohort 1 definition (Methods) and the Discussion:
Individuals with a prior diagnosis of IBS (ICD-9-CM: 564.1) before the index date were excluded to ensure incident outcome assessment.
Our findings apply only to incident cases, as individuals with any history of IBS or prior depressive/anxiety disorders were excluded from both cohorts.
The large sample enabled robust subgroup and interaction analyses.
What the paper's own numbers show
Method. I took every sample size, count and percentage for both cohorts from the Results text, the Figure 1 flowchart text, Tables 1–4 and the Methods description of the LHID. I checked (i) each stated total against twice the per-arm N; (ii) that each block of Table 2 sums to its column header; (iii) which denominators reproduce the printed follow-up event percentages, by finding every per-arm N for which the printed event count divided by N rounds to the printed percentage; (iv) the flowchart's own subtraction; (v) the number of events implied by the width of each overall adjusted hazard ratio's 95% CI. For (v) I used the standard approximation for a 1:1 comparison, var(log HR) ≈ 4/D, and also computed the interval expected from the reported event counts, SE ≈ √(1/d₁ + 1/d₂), and the interval expected if the Table N had produced events at the printed rates. Finally, I compared the cohort sizes with the size of the LHID. Patient-level data are not available, so the models cannot be refitted. Every number below is printed by recompute.py.txt.
| Quantity | Location | Reported | Recomputed from the paper's numbers |
|---|---|---|---|
| Cohort 2 total N | Results text; Table 2 headers | 361,258 (180,629 per arm) | 180,629 × 2 = 361,258, internally consistent |
| Cohort 2 final follow-up N | Figure 1 flowchart | 32,220 (16,110 per arm) | 16,110 × 2 = 32,220, internally consistent |
| Ratio of the two Cohort 2 totals | — | — | 361,258 / 32,220 = 11.21; difference 329,038 (164,519 per arm) |
| Table 2 block sums (PD status, sex, age group, urbanization, income) | Table 2 | n = 180,629 per column | every block sums to 180,629 in both columns |
| Depression + anxiety = "With PD" | Table 2 | 82,681 and 31,658 | 15,806 + 66,875 = 82,681; 7,339 + 24,319 = 31,658 |
| IBS-arm follow-up events | Results | 2,031 (12.6%) | 2,031 / 16,110 = 12.61%; 2,031 / 180,629 = 1.12% |
| Control-arm follow-up events | Results | 1,308 (8.1%) | 1,308 / 16,110 = 8.12%; 1,308 / 180,629 = 0.72% |
| Per-arm N that reproduces both printed percentages | derived | — | 16,056 to 16,183: contains 16,110, excludes 180,629 |
| IBS cohort after excluding prior PD | Figure 1 flowchart | 16,110 new cases, 3,231 excluded, cohort 16,110 | 16,110 − 3,231 = 12,879, not 16,110 |
| IBS arm "With PD" at baseline | Table 2; Results | 82,681 (45.77%) | 82,681 / 180,629 = 45.77%, in a cohort that excluded prior PD; 25.6 times the flowchart's 3,231 exclusions and 40.7 times the 2,031 follow-up events |
| Cohort 2 aHR 1.46 (1.37–1.56): events implied by CI width | Results; Table 4 | — | SE(log HR) = 0.0331; 4/SE² ≈ 3,644 events (3,288–4,061 allowing for rounding of the limits); reported events 2,031 + 1,308 = 3,339, inside that range |
| CI expected from 3,339 events | derived | 1.37–1.56 | 1.36–1.57 (matches) |
| CI expected if 180,629 per arm had the printed rates | derived | — | 22,759 + 14,631 = 37,390 events; CI 1.43–1.49 (does not match; the reported interval is 3.1 times as wide) |
| Cohort 1 total N | Results text; Table 1 headers | 468,722 (234,361 per arm) | 234,361 × 2 = 468,722 |
| Cohort 1 final follow-up N | Figure 1 flowchart | 36,804 (18,402 per arm) | 18,402 × 2 = 36,804; ratio 468,722 / 36,804 = 12.74 |
| Cohort 1 follow-up events | Results | 1,498 (8.1%) and 921 (5.0%) | /18,402 = 8.14% and 5.00%; /234,361 = 0.64% and 0.39%; N reproducing both: 18,381–18,606 |
| Cohort 1 aHR 1.55 (1.42–1.69): events implied by CI width | Results; Table 3 | — | ≈ 2,028 (1,885–2,188), slightly fewer than the 2,419 reported (1,498 + 921), i.e. the reported interval is a little wider than the events alone imply; both are far from the 30,701 implied by the Table N. CI from 2,419 events 1.43–1.68; from Table N at printed rates (30,701 events) 1.51–1.59, 3.8 times narrower than reported |
| PD arm with IBS at baseline | Table 1; Results | 75,244 (32.11%) | 75,244 / 234,361 = 32.11%, in a cohort that excluded prior IBS |
| Adults in the LHID | Methods | 1,000,000 − 1,982 − 2,614 | 995,404 |
| Cohort 1 eligible population | Figure 1 flowchart | "990,0xx" | 995,404 − 5,412 = 989,992, which is not of the form 990,0xx either |
| Exposed arms of both cohorts | Tables 1 and 2 | 234,361 + 180,629 | 414,990 = 41.7% of LHID adults |
| Exposed arms of both cohorts | Figure 1 flowchart | 18,402 + 16,110 | 34,512 = 3.5% of LHID adults |
The two exposed groups essentially cannot share people. Cohort 1 excludes anyone with IBS before the PD diagnosis, and Cohort 2 excludes anyone with PD before the IBS diagnosis, so each person can be exposed in at most one cohort (apart from anyone first diagnosed with both on the same date). Taken at face value, Tables 1 and 2 would mean that 41.7% of all adults in the database received a first diagnosis of PD or of IBS between 2002 and 2012, with the other condition absent beforehand. The flowchart's figures correspond to 3.5%.
Both totals for each cohort are internally consistent. Table 2's blocks all sum to 180,629, and the flowchart's numbers multiply out to 32,220. The two descriptions cannot both refer to the same matched sample. The follow-up percentages and the CI widths fit the flowchart, so the survival analyses appear to have been run on about 16,110 patients per arm in Cohort 2 (and about 18,402 in Cohort 1). It is not stated what population Tables 1 and 2 describe.
Figure
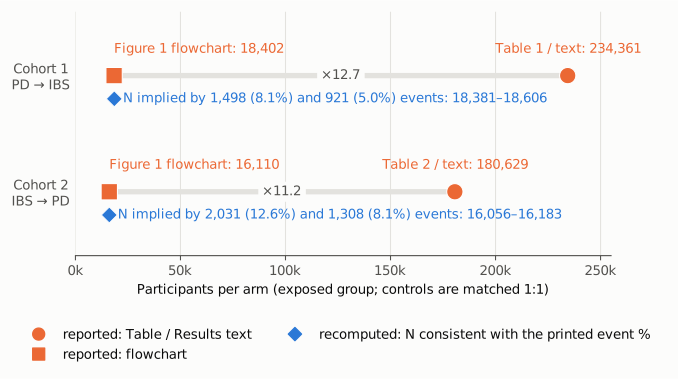
Figure 1. Participants per arm for each cohort on one linear axis starting at zero. Orange markers are printed in the paper: circles are the Table and Results-text values (234,361 for Cohort 1, 180,629 for Cohort 2), and squares are the Figure 1 flowchart values (18,402 and 16,110). The grey bar and the label on it give the ratio between the two printed values (12.7 and 11.2). The blue diamond marks the range of per-arm N (narrower than the marker at this scale) for which both printed follow-up percentages are reproduced from the printed event counts (Cohort 2: 2,031 at 12.6% and 1,308 at 8.1% give 16,056–16,183; Cohort 1: 1,498 at 8.1% and 921 at 5.0% give 18,381–18,606), computed by recompute.py.txt. In both cohorts this range contains the flowchart value and excludes the Table value.
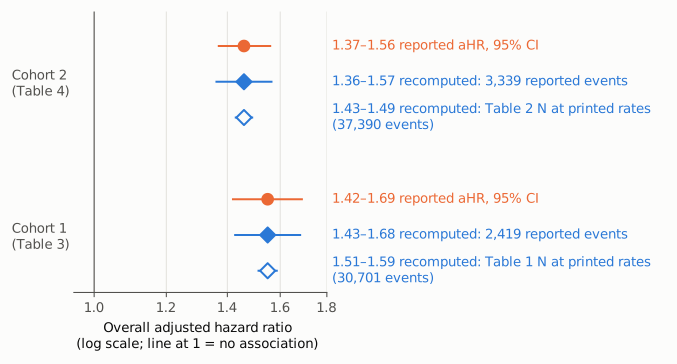
Figure 2. Overall adjusted hazard ratios on one log-scale axis; the vertical line marks HR = 1. Orange circles are the reported aHRs and 95% CIs (Table 4: 1.46, 1.37–1.56; Table 3: 1.55, 1.42–1.69). Filled blue diamonds are the intervals expected from the reported numbers of events (3,339 and 2,419), with SE(log HR) = √(1/d₁ + 1/d₂); they agree closely with the reported intervals (for Cohort 1 the reported interval is slightly wider than 2,419 events alone imply, which corresponds to about 2,028 events). Open blue diamonds are the intervals expected if the Table sample sizes had produced events at the printed rates (37,390 and 30,701 events); they are about three to four times narrower than reported (3.1x for Cohort 2, 3.8x for Cohort 1, measured as SE(log HR) and identical for the linear width). The reported precision is what the flowchart-sized cohorts would give, not what the Table-sized cohorts would give.
Why it matters
Cohort 2 is one of the paper's two primary analyses. Its sample size is given in the Results text and in Table 2 as 361,258, about eleven times the 32,220 in the flowchart that the Methods identify as showing the "final analytic sample sizes". The follow-up events and the precision of the hazard ratio fit the smaller number, so the hazard ratios were most likely estimated on about 32,000 people. Their direction and statistical significance are probably not affected by the misstated N.
What is affected is the description of the study population. Table 2, the Results paragraphs that summarize it ("well matched", the income and comorbidity contrasts, the 45.77% vs 17.53% PD prevalence) and the corresponding Table 1 material for Cohort 1 cannot describe the analysed cohorts. They report N values 11–13 times too large and a large prevalence of the very condition that each cohort was defined to exclude: 82,681 IBS patients "With PD" in Cohort 2 and 75,244 PD patients "With IBS" in Cohort 1. A reader cannot use these tables to judge baseline balance, comorbidity burden or generalizability, and the Discussion's "The large sample enabled robust subgroup and interaction analyses" rests in part on the larger figures. Anyone extracting the sample size for a systematic review or meta-analysis would take 361,258 (or 468,722) from the text, overstating the size of these cohorts eleven- to thirteen-fold.
The flowchart has its own problem. It lists 16,110 newly diagnosed IBS cases, then 3,231 exclusions for prior PD, and then an IBS cohort of 16,110 again, where 12,879 would be expected. So it is not clear whether 16,110 is the number before or after the exclusion.
A separate inconsistency adds to the uncertainty. The abstract gives "IBS was associated with increased risks of depression (adjusted hazard ratio [aHR] = 1.55) and anxiety (aHR = 1.68)", but 1.55 and 1.68 are the overall and female HRs for the opposite direction (PD → IBS) in Table 3. The body reports no depression- or anxiety-specific HRs, and the abstract's 1.45 and 1.51 for "depression and anxiety ... developing IBS" do not appear as point estimates anywhere in the body. Table 4's overall HR for IBS → PD is 1.46.
Explanations considered
- Table 2 describes the population before exclusions or before matching. This does not account for the numbers. Table 2 shows identical sex, age, age-group and urbanization counts in both columns, each with p = 1.000, so it describes a 1:1 matched sample, the same stage as the flowchart's "After matching 1:1 with controls". The Results text also says the participants were "divided evenly", and the Cohort 1 text says "234,361 individuals in each group after matching".
- Table 2 comes from a larger database (for example the full NHIRD rather than the 1-million-person LHID). Nothing in the paper says so. The Methods state that the cohorts were drawn from the LHID, a one-million-person subset of the NHIRD (as does Supplementary Table S1), and no table note gives another source. Even so, the event percentages in the Results fit only the flowchart denominators, so the paper's own analyses use the smaller cohorts.
- The rows count visits, claims or person-years rather than people. This does not account for the numbers. The rows are counts of people by sex, age group, urbanization level and income, each block sums exactly to the column N, and the percentages are of that N.
- The follow-up percentages use a different denominator from Table 2 on purpose. Nothing in the paper says so. The text gives "2,031 IBS patients (12.6%)" with no other denominator, and 12.6% is 2,031/16,110. A different denominator would mean that the analysed cohort is not the one in Table 2, which is the inconsistency itself.
- The "With PD" row in Table 2 (and "With IBS" in Table 1) reports outcomes during follow-up, not baseline status. This does not resolve the problem either. The Results place these figures under "Baseline characteristics" and call the Table 1 figure "The prevalence of IBS at baseline". Read as outcomes, 82,681 would contradict the 2,031 events reported for the same arm (40.7 times larger).
- The flowchart is wrong and the Tables are right. This is not consistent with the rest of the paper. The event percentages and the width of the hazard-ratio intervals both fit the flowchart sizes. With 180,629 per arm and events at the printed rates, the interval would be about 1.43–1.49, not 1.37–1.56. The Table sizes would also mean that 41.7% of the database's adults were incident cases of one condition without the other.
- A conversion or typesetting artifact in PMC. This is excluded. The publisher's HTML on cambridge.org and the Europe PMC JATS XML carry the same numbers: 361,258 and 180,629 in the text and Table 2 headers, and 16,110 / 3,231 / 16,110 / 16,110 / 32,220 in the flowchart.
- The supplement clarifies the cohorts. It does not (see Status). It gives no cohort sizes, and the "complete flow diagram (Figure S1)" that the supplementary text refers to is a cumulative-incidence plot.
Status
- Version of record. The publisher's HTML article page (doi.org redirects to cambridge.org/core) carries the same Results text ("361,258 participants, divided evenly into IBS (n = 180,629) and non-IBS controls (n = 180,629)"), the same flowchart text (16,110 / 3,231 excluded / 16,110 / 16,110 / 32,220) and the same follow-up sentence (2,031, 12.6%; 1,308, 8.1%). On that page Table 2 is an image. The Europe PMC full-text XML has Table 2 headers "IBS(n = 180,629)" and "Without IBS(n = 180,629)" and the same flowchart items. Every quote above was confirmed verbatim against the PMC-archived text.
- Supplements. One supplementary file (doi:10.1017/S0033291726103328.sm001, a .docx) was downloaded and read. It holds Supplementary Table S1 (LHID sampling and attrition: 1,000,000 sampled, 1,982 excluded for missing demographics, 2,614 under 18), Tables S2–S3 (interaction aHRs, no Ns) and Figures S1–S5 (cumulative-incidence curves without numbers at risk, and forest plots). It gives no cohort sizes. Its text refers to a "complete flow diagram (Figure S1)", but Figure S1 is a cumulative-incidence plot. Data are available from the authors on request.
- Corrections and comments. As of 2026-10-23 I found no correction, erratum, expression of concern or retraction. Crossref lists no update relations for the DOI. PMC and Europe PMC (PMID 41667938) list no correction or comment links. The Cambridge article page shows no correction notice, and the article page's metadata lists no corrections, retractions or addenda. A web search for the title with "correction", "erratum" or "PubPeer" returned nothing relevant. PubPeer could not be checked directly: its API returned HTTP 403 to automated access.
- Sources. PMC article PMC12902173; publisher page at cambridge.org (doi:10.1017/S0033291726103328); supplementary file S0033291726103328sup001.docx; Europe PMC full-text XML; Crossref; PubPeer (not reachable).
Suggested correction
- State which population Tables 1 and 2 describe. If the analysed cohorts are those in Figure 1 (18,402 and 16,110 per arm, as the event percentages and hazard-ratio precision indicate), replace Tables 1 and 2 and the Results paragraphs that summarize them with the baseline characteristics of those cohorts, and correct "468,722" / "234,361" and "361,258" / "180,629" in the Results text.
- Explain why Tables 1 and 2 show 75,244 PD patients with IBS and 82,681 IBS patients with PD at baseline in cohorts defined by excluding those conditions, or remove these rows if they do not describe baseline status.
- Reconcile the Cohort 2 flowchart: 16,110 newly diagnosed IBS cases minus 3,231 exclusions should not leave an IBS cohort of 16,110. Give the counts before and after exclusion, and give the Cohort 1 eligible population as a number instead of "990,0xx" (995,404 − 5,412 = 989,992, which does not fit "990,0xx" either).
- Correct the abstract's hazard ratios so that each one matches a reported estimate in the body for the stated direction and outcome (for IBS → PD, Table 4 gives 1.46 overall), or add the depression- and anxiety-specific estimates to the Results.
- Reword statements that rest on the larger sample sizes, such as "The large sample enabled robust subgroup and interaction analyses", if the analysed cohorts are the smaller ones.