← Back to the plain-language case
Abstract reports univariate hazard ratios as adjusted estimates and attaches them to the wrong treatments
Lancet Reg Health Eur (2025) · doi:10.1016/j.lanepe.2025.101402 · PMC12859599
Summary
The Abstract states that "in the adjusted multivariate model" immunotherapy and targeted therapy had hazard ratios (HRs) for second primary cancer (SPC), vs chemotherapy, of 0.470 (95% CI 0.338–0.654) and 0.701 (0.574–0.855). In the Results these same two HR/CI pairs are reported as the univariate Cox estimates, with the treatments the other way round: 0.470 for targeted therapy and 0.701 for immunotherapy. The adjusted multivariate estimates in the Results, repeated in the Discussion, are 0.768 (0.622–0.947) for immunotherapy and 0.556 (0.385–0.803) for targeted therapy. The paper's own event counts and incidence rates support the Results' assignment: the width of each interval matches the number of events in the group the Results name, and the crude rate ratios rank targeted therapy as the more protective treatment. As a result, the Abstract overstates the adjusted risk reduction for immunotherapy (53% vs 23%), understates it for targeted therapy (30% vs 44%), and reverses which treatment looks more protective after adjustment. Both treatments remain associated with lower SPC risk in every version.
What the paper reports
In the adjusted multivariate model, both immunotherapy and targeted therapy were associated with a reduced risk of SPCs: HR = 0.470 (95% CI 0.338–0.654) and HR = 0.701 (95% CI 0.574–0.855), respectively. Additional associated factors with SPCs included metastatic disease, HR = 0.456 (95% CI 0.377–0.552); history of tobacco use, HR = 1.599 (95% CI 1.127–2.269); and current smoking, HR = 1.319 (95% CI 0.923–1.884) p < 0.001.
Abstract, Findings
In the univariate Cox regression, the following factors were explored for their association with the development of SPCs: type of treatment received, age at diagnosis, sex, tumour stage, histological type, and smoking habits were explored. Both targeted therapy and immunotherapy, when compared to chemotherapy, were identified as protective factors with HR = 0.470 (95% CI 0.338–0.654) and HR = 0.701 (95% CI 0.574–0.855), respectively.
Results, "Factors associated with second primary cancer", paragraph 1
Other factors associated with the development of SPCs included metastatic disease HR = 0.456 (95% CI 0.377–0.552), history of tobacco use HR = 1.599 (95% CI 1.127–2.269), and active tobacco use HR = 1.319 (95% CI 0.923–1.884); p < 0.001.
Results, "Factors associated with second primary cancer", paragraph 3 (between the univariate paragraph and the adjusted-model paragraph)
In the adjusted multivariate model, the effect of treatment was confirmed with immunotherapy and targeted therapy, HR = 0.768 (95% CI 0.622–0.947) and HR = 0.556 (95% CI 0.385–0.803); p < 0.001, respectively. Other associated factors such as age HR = 1.028 (95% CI 1.018–1.039), small cell histology HR = 0.704 (95% CI 0.513–0.965), and metastatic disease HR = 0.518 (95% CI 0.428–0.626); p < 0.001, were also found.
Results, "Factors associated with second primary cancer", paragraph 4
Multivariate Cox regression analysis confirmed that both immunotherapy and targeted therapy were protective for SPC compared to chemotherapy with HR = 0.768 (95% CI 0.622–0.947) and HR = 0.556 (95% CI 0.385–0.803); p < 0.001, respectively.
Discussion, paragraph 1
The inputs used for the checks below:
A total of 480 patients (2.3%) developed a SPC. The incidence rate per 100 person-years were 1.059 for the immunotherapy group, 0.661 for the targeted therapy group, and 1.791 for the chemotherapy group. […] By treatment group, 298 patients (62.1%) had received chemotherapy, 142 (29.6%) immunotherapy, and 40 (8.3%) targeted therapy. The proportion of patients who developed an SPC was lowest in the targeted therapy group (1.5%) followed by the immunotherapy group (2.1%) and the chemotherapy group (2.9%) (Table 3).
Results, "Characteristics of the population with a second primary cancer by treatment type", paragraph 1
How the Abstract uses the result:
Patients treated with immunotherapy and targeted therapy exhibited a significantly lower incidence of SPCs. Tobacco use was a key associated factor.
Abstract, Interpretation
What the paper's own numbers show
Method. The Abstract, Results and Discussion values were compared as printed. Two checks show which treatment each HR/CI pair belongs to. (1) The standard error of a log HR implied by a printed 95% CI is ln(upper/lower)/(2 × 1.96). For a Cox HR comparing two groups, this SE is approximately √(1/d₁ + 1/d₀), where d₁ and d₀ are the event counts in the two groups (142 immunotherapy, 40 targeted therapy and 298 chemotherapy events; Results and Table 3). The approximation is close for an unadjusted comparison and somewhat larger after adjustment. (2) The crude incidence-rate ratio of each group vs chemotherapy was computed from the reported rates per 100 person-years. Each CI was also checked for internal consistency: its log-scale midpoint should equal the printed HR. All numbers come from recompute.py.txt.
| Quantity | Location | Reported | Recomputed from the paper's own numbers |
|---|---|---|---|
| Immunotherapy vs chemotherapy, "adjusted multivariate" | Abstract, Findings | 0.470 (0.338–0.654) | Results and Discussion give the adjusted HR as 0.768 (0.622–0.947). 0.470 (0.338–0.654) is the Results' univariate value for targeted therapy |
| Targeted therapy vs chemotherapy, "adjusted multivariate" | Abstract, Findings | 0.701 (0.574–0.855) | Results and Discussion give the adjusted HR as 0.556 (0.385–0.803). 0.701 (0.574–0.855) is the Results' univariate value for immunotherapy |
| SE(log HR) implied by 0.470 (0.338–0.654) | Abstract; Results ¶1 | — | 0.1684. Expected from events: targeted therapy (40 vs 298) 0.1684, immunotherapy (142 vs 298) 0.1020. Ratio implied/expected 1.000 for targeted therapy, 1.651 for immunotherapy |
| SE(log HR) implied by 0.701 (0.574–0.855) | Abstract; Results ¶1 | — | 0.1017. Matches immunotherapy (ratio 0.997), not targeted therapy (0.604) |
| SE(log HR) implied by adjusted 0.768 (0.622–0.947) | Results ¶4; Discussion | immunotherapy | 0.1072, 1.052 × the immunotherapy event-based value. Consistent |
| SE(log HR) implied by adjusted 0.556 (0.385–0.803) | Results ¶4; Discussion | targeted therapy | 0.1875, 1.114 × the targeted-therapy event-based value. Consistent |
| Log-scale midpoint of each CI | all four pairs | 0.470, 0.701, 0.768, 0.556 | 0.470, 0.701, 0.767, 0.556. Each pair is internally consistent, so no digit has been garbled |
| Crude SPC rate ratio vs chemotherapy | from rates per 100 person-years (1.059, 0.661, 1.791) | — | Immunotherapy 0.591 (0.484–0.722), targeted therapy 0.369 (0.265–0.513). Targeted therapy is the more protective group, as in the Results' univariate assignment |
| 12-month cumulative incidence ratio vs chemotherapy | Abstract; Results (1.22%, 0.85%, 0.67%) | — | Immunotherapy 0.697, targeted therapy 0.549. Same ordering |
| Hazard reduction, immunotherapy (100 × (1 − HR)) | Abstract vs Results ¶4 | 53.0% (abstract) | 23.2% (adjusted model). The abstract's figure is 2.28 times the adjusted one |
| Hazard reduction, targeted therapy | Abstract vs Results ¶4 | 29.9% (abstract) | 44.4% (adjusted model) |
| Which treatment is more protective after adjustment | Abstract vs Results ¶4 | immunotherapy (0.470 < 0.701) | targeted therapy (0.556 < 0.768) |
| Metastatic disease, listed in the abstract after the "adjusted" treatment HRs | Abstract vs Results ¶3, ¶4 | 0.456 (0.377–0.552) | 0.456 is the Results ¶3 value (between the univariate and adjusted paragraphs). The adjusted-model value is 0.518 (0.428–0.626) |
| Current smoking, "p < 0.001" | Abstract; Results ¶3 | 1.319 (0.923–1.884) | The CI includes 1. The Wald p implied by the CI is 0.13 (z = 1.52), so the "p < 0.001" cannot refer to this term on its own |
| Wald p implied by the adjusted CIs | Results ¶4; Discussion ("p < 0.001") | — | Immunotherapy z = −2.46, p = 0.014; targeted therapy z = −3.13, p = 0.0017. These are significant at 0.05, but neither is below 0.001; the printed p may refer to a joint test of the treatment variable |
| Crude SPC proportions | Abstract; Results; Table 3 | 2.9%, 2.1%, 1.5% | 298/10,137 = 2.94%, 142/6,820 = 2.08%, 40/2,628 = 1.52% with the followed-up denominators of Supplementary Figure S1 (sum 19,585). These are consistent and not part of the error |
So the Abstract's two "adjusted" treatment HRs are the univariate pair, with the treatment labels swapped. The event-count check fits the Results' labelling exactly (ratios 0.997 and 1.000) and misfits the Abstract's labelling by factors of 1.65 and 0.60. The crude rate ratios point the same way. The adjusted estimates in the body are consistent with the event counts and with the expected modest SE inflation after covariate adjustment.
Figure
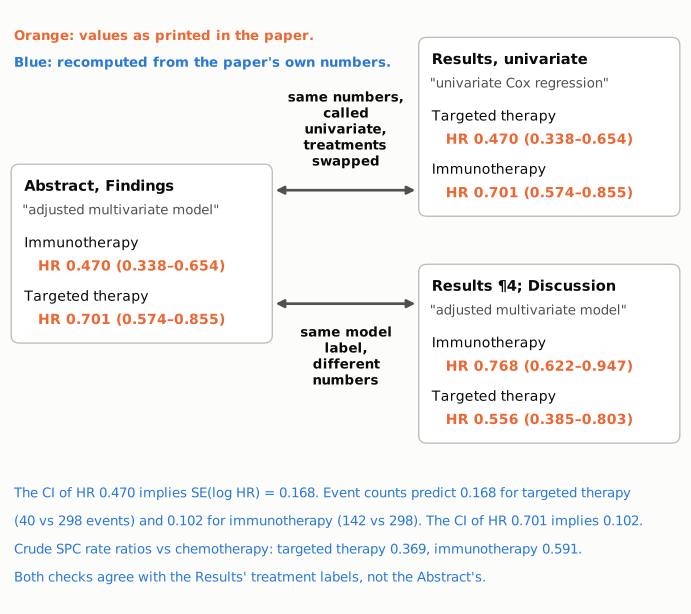
Figure 1. Where each treatment HR appears in the paper and how it is labelled. Orange text gives the values as printed. The left panel is the Abstract's "adjusted multivariate model". The upper right panel is the Results' univariate Cox paragraph, which carries the same two HR/CI pairs with the treatment labels reversed. The lower right panel is the Results' adjusted multivariate paragraph, repeated in the Discussion, which carries different values under the same model label as the Abstract. The blue text below summarises the checks recomputed from the paper's own event counts and incidence rates (see recompute.py.txt). Both checks agree with the treatment labels in the Results.
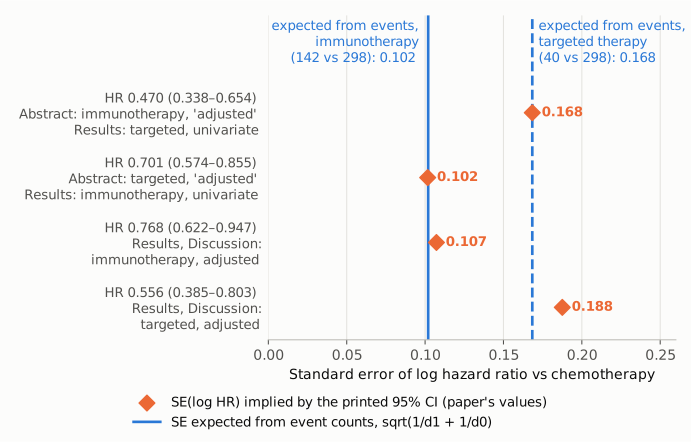
Figure 2. For each of the four printed treatment HRs, the orange diamond is the standard error of the log HR implied by its 95% CI. The blue vertical lines are the approximate standard errors expected from the event counts, √(1/d₁ + 1/d₀): 0.102 for immunotherapy vs chemotherapy (142 vs 298 events, solid) and 0.168 for targeted therapy vs chemotherapy (40 vs 298 events, dashed). The interval of HR 0.470, which the Abstract assigns to immunotherapy, sits exactly on the targeted-therapy line. The interval of HR 0.701, which the Abstract assigns to targeted therapy, sits on the immunotherapy line. The two adjusted intervals from the Results lie just to the right of their own group's line, as expected after covariate adjustment. The axis starts at zero.
Why it matters
- The headline adjusted estimates. The Abstract is where readers, guideline authors and evidence syntheses usually take effect sizes from. Readers who take the Abstract's adjusted immunotherapy HR (0.470) would record a 53% lower SPC hazard, whereas the paper's adjusted model gives 23% (HR 0.768). For targeted therapy they would record 30% (HR 0.701) instead of 44% (HR 0.556).
- The ranking of treatments. After adjustment, the Abstract makes immunotherapy look more protective than targeted therapy. The body's adjusted model, the univariate model and the crude data (1.5% vs 2.1%; 0.661 vs 1.059 per 100 person-years) all rank targeted therapy first.
- Unadjusted shown as adjusted. The Discussion itself notes that the treatment associations "are likely influenced by the underlying clinical profiles of patients receiving each treatment". The Abstract presents unadjusted estimates as adjusted ones, so readers cannot see how much adjustment changed them. For immunotherapy the hazard reduction shrinks from 30% (univariate 0.701) to 23% (adjusted 0.768).
- Other factors in the Abstract. The Abstract's "additional associated factors" are also the values from Results ¶3, not the adjusted model (adjusted metastatic disease HR 0.518 vs 0.456 in the Abstract). The adjusted-model paragraph reports no tobacco HRs. Current smoking, given with "p < 0.001", has a CI that includes 1 (implied p = 0.13). The Interpretation ("Tobacco use was a key associated factor") rests on these values.
- What stands. All four treatment CIs exclude 1, so the qualitative conclusion holds in every version: both immunotherapy and targeted therapy are associated with lower SPC risk than chemotherapy. The crude incidence figures, cumulative incidence curves and SPC site distribution are not affected.
Explanations considered
- The abstract reports a different model (Fine–Gray rather than Cox). Does not account for it. The Methods describe "Univariate and multivariate Fine and Gray sub distribution hazard models … with sub hazard ratios (sHR)" as well as Cox models, but the paper reports no sHR for any covariate. In the body, 0.470 and 0.701 are called univariate Cox HRs, and the only values called adjusted multivariate are 0.768 and 0.556, both in the Results and in the Discussion. No passage gives 0.470 or 0.701 as an adjusted estimate from any model. If the Abstract came from another adjusted model, it would also be unlikely to reproduce the univariate CIs to three decimals.
- A subgroup analysis. Does not account for it. The within-subgroup multivariate HRs in Results ¶2 are 2.117 (0.989–4.534), 2.171 (1.160–4.063) and 1.411 (0.717–2.777), which are different numbers.
- The Results, not the Abstract, has the treatments swapped. Not supported. The CI widths match the event counts of the groups the Results names (implied/expected SE ratio 1.000 for 0.470 as targeted therapy, 0.997 for 0.701 as immunotherapy), and not the Abstract's assignment (1.65 and 0.60). The crude rate ratios (targeted 0.369, immunotherapy 0.591) and the 12-month cumulative incidences (0.67% vs 0.85%) also rank targeted therapy as more protective.
- A typo or digit transposition. Does not account for it. Each HR sits at the log-scale midpoint of its CI, so every pair is internally consistent. Four values (both HRs and both CIs) move together.
- A conversion or rendering artefact. Excluded. The values are in running text, not table cells. The publisher's typeset PDF carries the same wording and numbers (see Status).
- A supplementary table that reports 0.470/0.701 as adjusted. Not found. Supplementary Table S1 is a Cox model for overall survival, not for SPCs. Its treatment HRs (targeted 0.696/0.598, immunotherapy 0.719/0.564) match none of the disputed values.
Status
- Version of record. Checked in the publisher's typeset PDF (creator Elsevier, "The Lancet Regional Health - Europe, 56 (2025) 101402", 20 pages), obtained through the PMC /pdf/ endpoint. The Abstract, univariate-paragraph and adjusted-paragraph passages appear word for word. In the PDF text, 0.470 occurs only in the Abstract and in the univariate paragraph. The Europe PMC full-text XML, the live PMC page and the local PMC archive copy carry the same text. Every quotation above was checked verbatim against the archive copy. The ScienceDirect and thelancet.com pages refused automated access (HTTP 403 or a challenge page).
- Supplements. Both supplementary files were checked (Europe PMC supplementary files): mmc1.docx (a list of group members) and mmc2.pdf (5 pages: Figure S1 CONSORT diagram, Figure S2 overall survival curves, Table S1 Cox model for overall survival). Figure S1 confirms the SPC counts (immunotherapy 142/6,820, targeted therapy 40/2,628, chemotherapy 298/10,137). No supplement contains a Cox or Fine–Gray table for SPCs, so the treatment HRs appear only in the running text.
- Corrections. Crossref lists no update-to or updated-by relation for the DOI. PMC and Europe PMC list no correction, erratum, retraction or expression of concern (PMID 41624086; checked 2026-10-23).
- PubPeer. pubpeer.com refused automated access (HTTP 403). A web search for the title with "PubPeer" returned no PubPeer page. Europe PMC's link services for PMID 41624086 list only BioStudies, with no PubPeer link. The absence of a PubPeer thread is therefore likely but not confirmed.
- As of 2026-10-23.
Suggested correction
- In the Abstract, Findings, replace the treatment sentence with the adjusted estimates the Results and Discussion report: immunotherapy HR 0.768 (95% CI 0.622–0.947) and targeted therapy HR 0.556 (95% CI 0.385–0.803), vs chemotherapy. If the univariate values are kept as well, label them as univariate and attach them to the right treatments: targeted therapy 0.470 (0.338–0.654), immunotherapy 0.701 (0.574–0.855).
- Make the Abstract's "additional associated factors" match the model it describes. For the adjusted model, give metastatic disease 0.518 (0.428–0.626), age 1.028 (1.018–1.039) and small cell histology 0.704 (0.513–0.965). Report the adjusted tobacco HRs if the model included smoking, as the Methods list it among the covariates.
- Give a p value for each term, or say which test "p < 0.001" refers to. As printed, it is attached to current smoking, whose CI includes 1, and to two adjusted treatment HRs whose CIs imply p = 0.014 and p = 0.0017.
- Consider adding a table of the univariate and multivariate SPC models (Cox and, as the Methods describe, Fine–Gray) so that each estimate's model and covariate set is explicit. If needed, revise the Interpretation sentence on tobacco use to match the adjusted results.